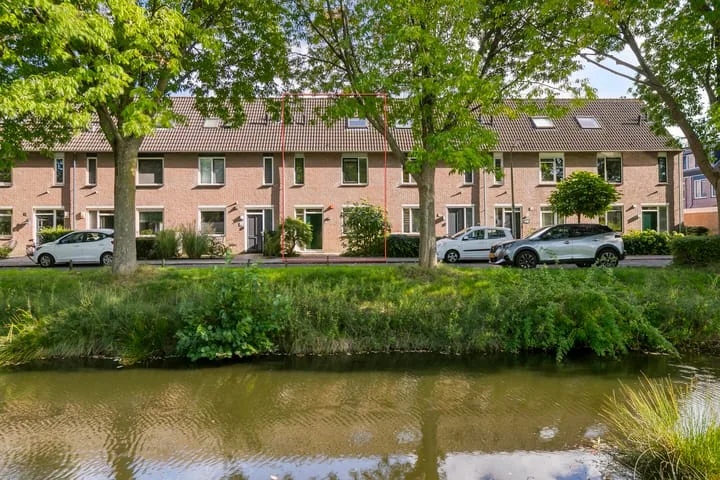
Houses sold in Hoogland

View 94 sold houses in Hoogland

Connected to: Vastgoed Nederland NVM Makelaars

On this page you will find recently sold homes in Hoogland. Use this overview to better estimate selling prices, popular neighborhoods, and the local housing supply before you choose a real estate agent. Also view the current housing supply with 115 houses in Hoogland.

Selection

Search and filter homes

Set your preferences and discover homes that suit you.

Total supply 241.444
Filters

Set price, area and other characteristics. Adjust a filter or click on Show homes. Location changes directly above.

Reset filters

You search for

  • Place Hoogland
  • Status Sold

Huis verkopen in Hoogland? Vergelijk verkoopmakelaars

Bekijk recente verkopen en ontvang gratis offertes van lokale verkoopmakelaars in Hoogland.

Free request a quote

  • Quotes in Hoogland
  • Non-binding
  • Personal
  • Gratis tarieven vergelijken

Recent verkocht in Hoogland? Lees de verkoopgerichte gids huis verkopen in Hoogland, vergelijk verkoopmakelaars in Hoogland of bekijk de beste verkoopmakelaars in Hoogland voor referentie bij jouw keuze.

Vergelijk meerdere offertes

Makelaars maken scherpere voorstellen als ze weten dat je vergelijkt — vraag offertes aan voor verkoop of aankoop.

Frequently asked questions about sold homes in Hoogland

Short answers about housing prices, sold homes and comparing real estate agents in Hoogland.

Residential and neighborhood statistics in Hoogland

View current location data on residents, WOZ development, housing stock, energy consumption, business activity and safety in Hoogland. In 2025 were there 10.125 residents. The average WOZ value in 2025 is EUR 487.520.

These figures help to better assess and compare the housing stock in Hoogland with recent sold homes. Orient yourself then on suitable top real estate agents in Hoogland for sales advice in this region.

Residents

10.125

Last year: 2025

Average WOZ

EUR 487.520

Last year: 2025

Average income per person.

EUR 35.598

Source: AllNumbers

Crimes (current year)

239

Total registered

Demographics and WOZ development

Inhabitants per year

Inhabitants per year in Hoogland
Year Residents
2021 10.305
2022 10.245
2023 10.180
2024 10.140
2025 10.125

Annual WOZ value

WOZ value per year in Hoogland
Year Average WOZ
2021 EUR 365.923
2022 EUR 404.109
2023 EUR 471.727
2024 EUR 465.173
2025 EUR 487.520

Composition of residents

Age build-up

65+: 2.535 0-15: 1.450 15-25: 1.145 25-45: 2.015 45-65: 2.985

Education level

Hoger

2.770

Praktisch

1.490

Middelbaar

3.140

Origin of residents (2025)

Europa

455

Nederland

8.755

Buiten Europa

915

Housing stock and construction periods

Types of homes

Hoekwoningen 926
Appartementen 578
Tussenwoningen 2.116
Vrijstaande woningen 404
Twee-onder-één-kap woningen 313

Construction period of buildings

Voor 1700 6
1700 tot 1900 37
1900 tot 1925 43
1925 tot 1950 95
1950 tot 1970 519
1970 tot 1980 1.792
1980 tot 1990 1.011
1990 tot 2000 503
2000 tot 2010 101
2010 tot 2020 47
2020 en later 27

Energy and sustainability

Energy label distribution

Label C

1.919

Label B

921

Label A

669

Label D

449

Label E

152

Label F

135

Label G

119

Label A+

48

Label A+++

19

Label A++

15

Label A++++

9

Label A+++++

0

Average energy consumption per year

Average energy consumption per year in Hoogland
Year Gas (m3) Electricity (kWh)
2020 1.222 3.078
2021 1.393 3.169
2022 1.084 2.925
2023 906 2.739
2024 877 2.800

Consumption per house type

Hoekwoning

Gas: 938 • Electricity: 2.709

Huurwoning

Gas: 721 • Electricity: 1.995

Koopwoning

Gas: 955 • Electricity: 2.907

Appartement

Gas: 621 • Electricity: 1.929

Tussenwoning

Gas: 814 • Electricity: 2.460

Vrijstaande woning

Gas: 1.405 • Electricity: 4.142

Twee-onder-één-kap woning

Gas: 1.153 • Electricity: 3.206

Business activity in Hoogland (2025)

Handel en HORECA 160
Nijverheid en energie 170
Zakelijke dienstverlening 370
Overheid, onderwijs en zorg 310
Landbouw, bosbouw en visserij 35
Vervoer, informatie en communicatie 95
Financiele diensten en onroerendgoed 60
Cultuur, recreatie en overige diensten 160

Total number of company establishments: 1.370

Recent crime statistics

Recent crime statistics in Hoogland
Period Crimes
jan 2025 12
jan 2026 21
jul 2025 20
jun 2025 15
mei 2025 15
mrt 2025 20
nov 2024 20
nov 2025 17
okt 2024 17
okt 2025 24
sep 2024 7
sep 2025 29

These figures give an indicative picture of safety trends in the living environment of Hoogland.

Frequently asked questions about living in Hoogland

Short answers based on current local statistics, handy for a quick comparison of the living environment.

Hoeveel inwoners heeft Hoogland?

Hoogland telt in 2025 ongeveer 10.125 inwoners.

Wat is de gemiddelde WOZ-waarde in Hoogland?

De gemiddelde WOZ-waarde in Hoogland is in 2025 circa € 487.520.

Wat is het gemiddelde inkomen per inwoner in Hoogland?

Het gemiddelde inkomen per inwoner in Hoogland ligt rond € 35.598 per jaar.

Hoe veilig is wonen in Hoogland?

Voor het huidige jaar gaat het om ongeveer 239 geregistreerde misdrijven. Gebruik deze cijfers als indicatie en vergelijk trends per periode.

Welke woningtypen komen het meest voor in Hoogland?

In Hoogland komt vooral "Tussenwoningen" veel voor, met ongeveer 2.116 woningen.

Gratis vrijblijvende offertes ontvangen

Vergelijk meerdere makelaars en kies de beste match.