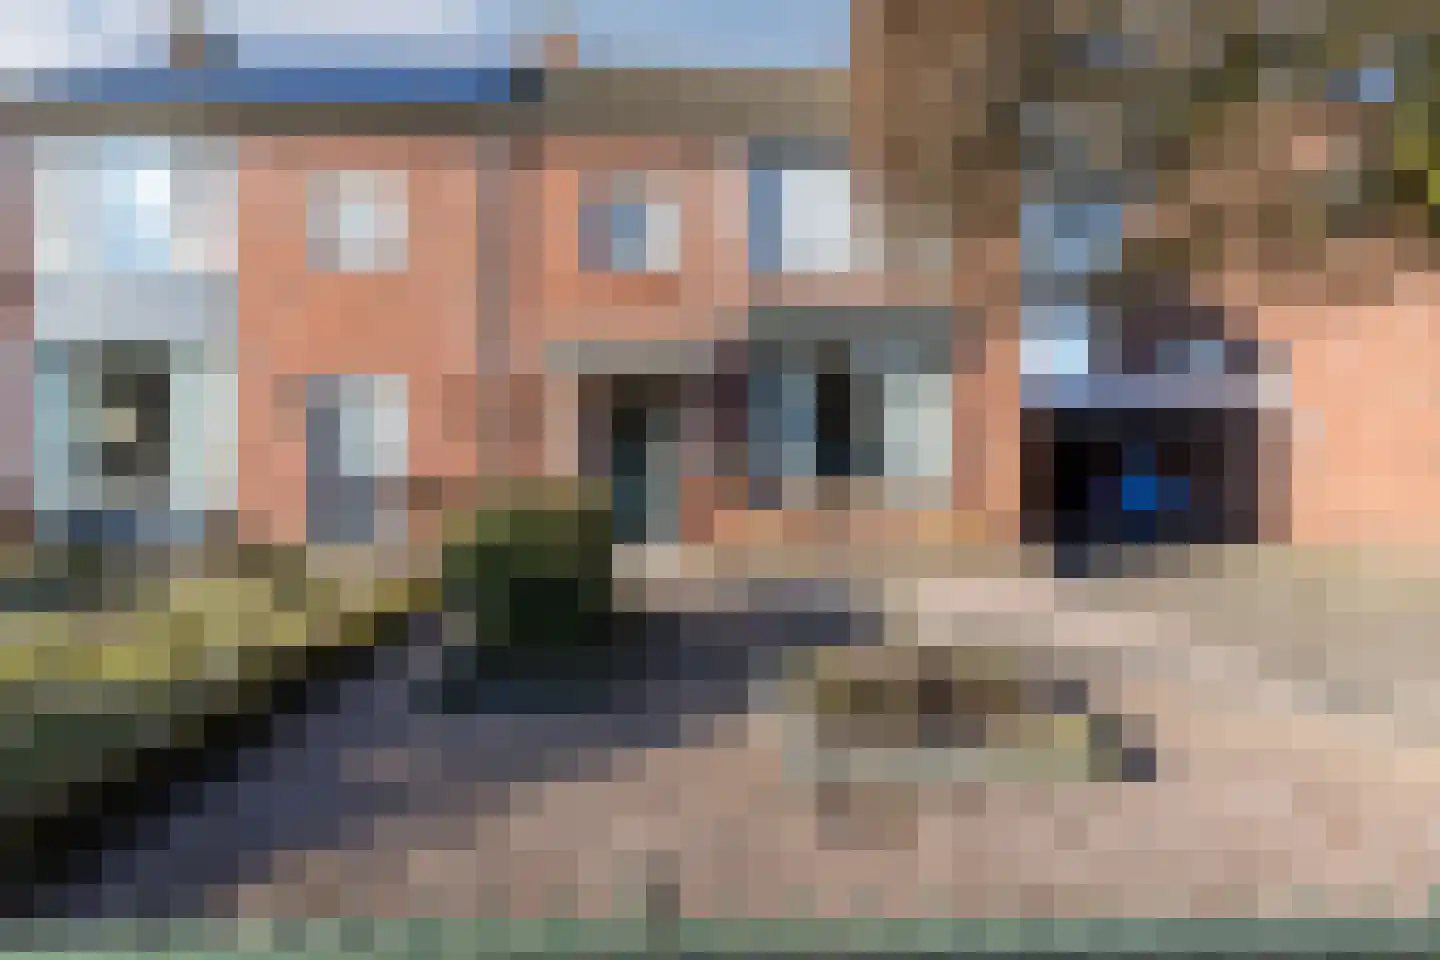
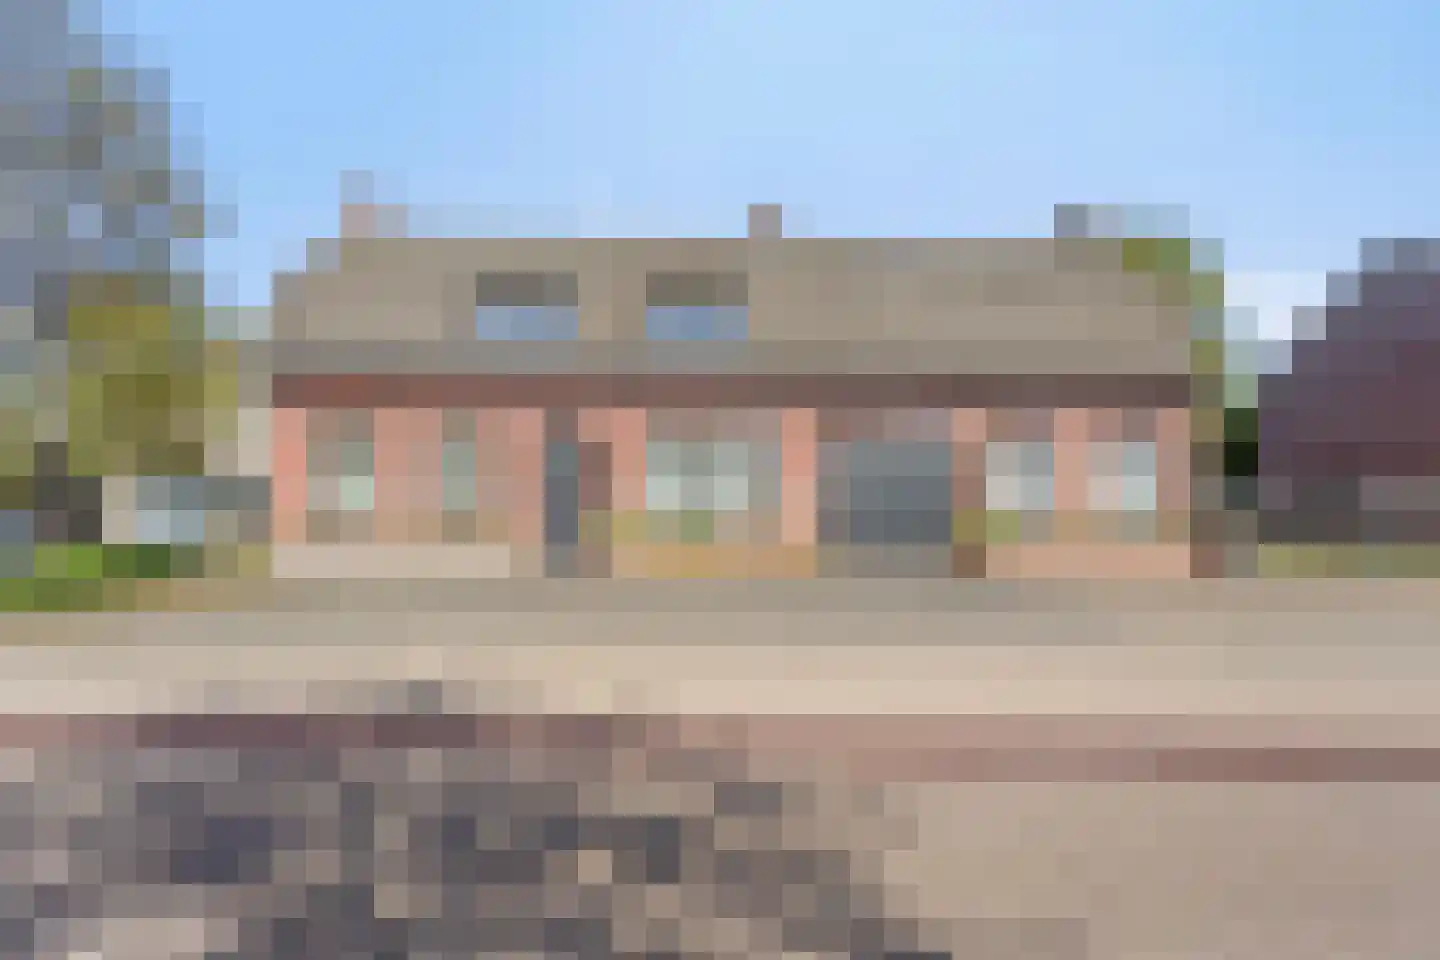
- Sold
Irislaan 6
5595EH Leende
€ 1.150.000 k.k.
€ 5.399/m²
- Living area
- 213 m²
- Land area
- 1200 m²
- Bedrooms
- 4
View 26 sold houses in Leende
Type to search. Use arrow down and arrow up to navigate through results and press Enter to open.
Hidden search suggestions.
Compare sold homes in Leende or view the current offering in this location directly.
On this page you will find recently sold homes in Leende. Use this overview to better estimate selling prices, popular neighborhoods, and the local housing supply before you choose a real estate agent. Also view the current housing supply with 40 houses in Leende.
5595EH Leende
€ 1.150.000 k.k.
€ 5.399/m²
5595AH Leende
€ 480.000 k.k.
€ 4.103/m²
5595AV Leende
€ 525.000 k.k.
€ 4.268/m²
5595EE Leende
€ 699.000 k.k.
€ 3.718/m²
5595AG Leende
€ 395.000 k.k.
€ 3.761/m²
5595BW Leende
€ 450.000 k.k.
€ 4.166/m²
5595EL Leende
€ 595.000 k.k.
€ 3.814/m²
5595DG Leende
€ 650.000 k.k.
€ 4.304/m²
5595BW Leende
€ 410.000 k.k.
€ 4.408/m²
5595AA Leende
€ 798.000 k.k.
€ 5.082/m²
5595HJ Leende
€ 930.000 k.k.
€ 5.344/m²
5595GL Leende
€ 1.060.000 k.k.
€ 4.796/m²
5595CX Leende
€ 795.000 k.k.
€ 5.335/m²
5595ER Leende
€ 699.000 k.k.
€ 0/m²
5595CL Leende
€ 625.000 k.k.
€ 0/m²
5595EH Leende
€ 575.000 k.k.
€ 0/m²
5595CE Leende
€ 350.000 k.k.
€ 0/m²
5595CD Leende
€ 375.000 k.k.
€ 0/m²
5595CS Leende
€ 525.000 k.k.
€ 0/m²
5595CV Leende
€ 539.000 k.k.
€ 5.336/m²
5595EM Leende
€ 475.000 k.k.
€ 2.683/m²
5595AA Leende
€ 795.000 k.k.
€ 4.228/m²
5595HG Leende
€ 398.000 k.k.
€ 3.980/m²
5595AN Leende
€ 895.000 k.k.
€ 4.124/m²
5595AW Leende
€ 529.500 k.k.
€ 3.114/m²
5595GC Leende
€ 795.000 k.k.
€ 3.457/m²
Bekijk recente verkopen en ontvang gratis offertes van lokale verkoopmakelaars in Leende.
Zelf je woning verkopen in Leende? Vergelijk verkoopmakelaars in Leende of bekijk de beste verkoopmakelaars in Leende als referentie bij jouw keuze.
Makelaars maken scherpere voorstellen als ze weten dat je vergelijkt — vraag offertes aan voor verkoop of aankoop.
Short answers about housing prices, sold homes and comparing real estate agents in Leende.
The costs of a real estate agent in Leende vary per office, property type and sales approach. Therefore, compare multiple quotes and also look at the real estate agents in Leende to better compare rates, presentation and local experience.
On this page we currently show 26 sold houses in Leende from our selection. This helps you to better assess recent transactions and the local housing market.
Houses sold in Leende give insight into asking prices, house types and neighborhoods where recent transactions have taken place. Compare this also with the current housing stock in Leende to better understand the market.
You can use sold homes as a first market indication, but a local real estate agent can better take into account finishing, location, maintenance and current demand in Leende.
Vergelijk makelaars in Leende op lokale verkoopervaring, reviews, verwachte opbrengst, courtage en marketingaanpak. Bekijk verkoopmakelaars in Leende of de top 10 makelaars in Leende om snel sterke kantoren te ontdekken.
View current location data on residents, WOZ development, housing stock, energy consumption, business activity and safety in Leende. In 2025 were there 4.770 residents. The average WOZ value in 2025 is EUR 523.989.
These figures help to better assess and compare the housing stock in Leende with recent sold homes. Orient yourself then on suitable top real estate agents in Leende for sales advice in this region.
Residents
4.770
Last year: 2025
Average WOZ
EUR 523.989
Last year: 2025
Average income per person.
EUR 34.620
Source: AllNumbers
Crimes (current year)
179
Total registered
| Year | Residents |
|---|---|
| 2021 | 4.515 |
| 2022 | 4.545 |
| 2023 | 4.610 |
| 2024 | 4.600 |
| 2025 | 4.770 |
| Year | Average WOZ |
|---|---|
| 2021 | EUR 403.945 |
| 2022 | EUR 437.572 |
| 2023 | EUR 480.737 |
| 2024 | EUR 499.075 |
| 2025 | EUR 523.989 |
Hoger
1.220
Praktisch
770
Middelbaar
1.490
Europa
470
Nederland
4.045
Buiten Europa
255
Label C
479
Label A
447
Label B
303
Label G
180
Label F
152
Label D
143
Label E
76
Label A+++
47
Label A++++
31
Label A+
28
Label A++
28
Label A+++++
0
| Year | Gas (m3) | Electricity (kWh) |
|---|---|---|
| 2020 | 1.620 | 3.645 |
| 2021 | 1.833 | 3.649 |
| 2022 | 1.437 | 3.439 |
| 2023 | 1.174 | 3.234 |
| 2024 | 1.114 | 3.332 |
Hoekwoning
Gas: 995 • Electricity: 2.895
Huurwoning
Gas: 940 • Electricity: 2.309
Koopwoning
Gas: 1.228 • Electricity: 3.456
Appartement
Gas: 737 • Electricity: 2.069
Tussenwoning
Gas: 839 • Electricity: 2.255
Vrijstaande woning
Gas: 1.443 • Electricity: 4.042
Twee-onder-één-kap woning
Gas: 1.165 • Electricity: 3.185
Total number of company establishments: 800
| Period | Crimes |
|---|---|
| jan 2025 | 7 |
| jan 2026 | 15 |
| jul 2025 | 13 |
| jun 2025 | 11 |
| mei 2025 | 16 |
| mrt 2025 | 15 |
| nov 2024 | 6 |
| nov 2025 | 11 |
| okt 2024 | 16 |
| okt 2025 | 19 |
| sep 2024 | 15 |
| sep 2025 | 20 |
These figures give an indicative picture of safety trends in the living environment of Leende.
Short answers based on current local statistics, handy for a quick comparison of the living environment.
Leende telt in 2025 ongeveer 4.770 inwoners.
De gemiddelde WOZ-waarde in Leende is in 2025 circa € 523.989.
Het gemiddelde inkomen per inwoner in Leende ligt rond € 34.620 per jaar.
Voor het huidige jaar gaat het om ongeveer 179 geregistreerde misdrijven. Gebruik deze cijfers als indicatie en vergelijk trends per periode.
In Leende komt vooral "Vrijstaande woningen" veel voor, met ongeveer 828 woningen.