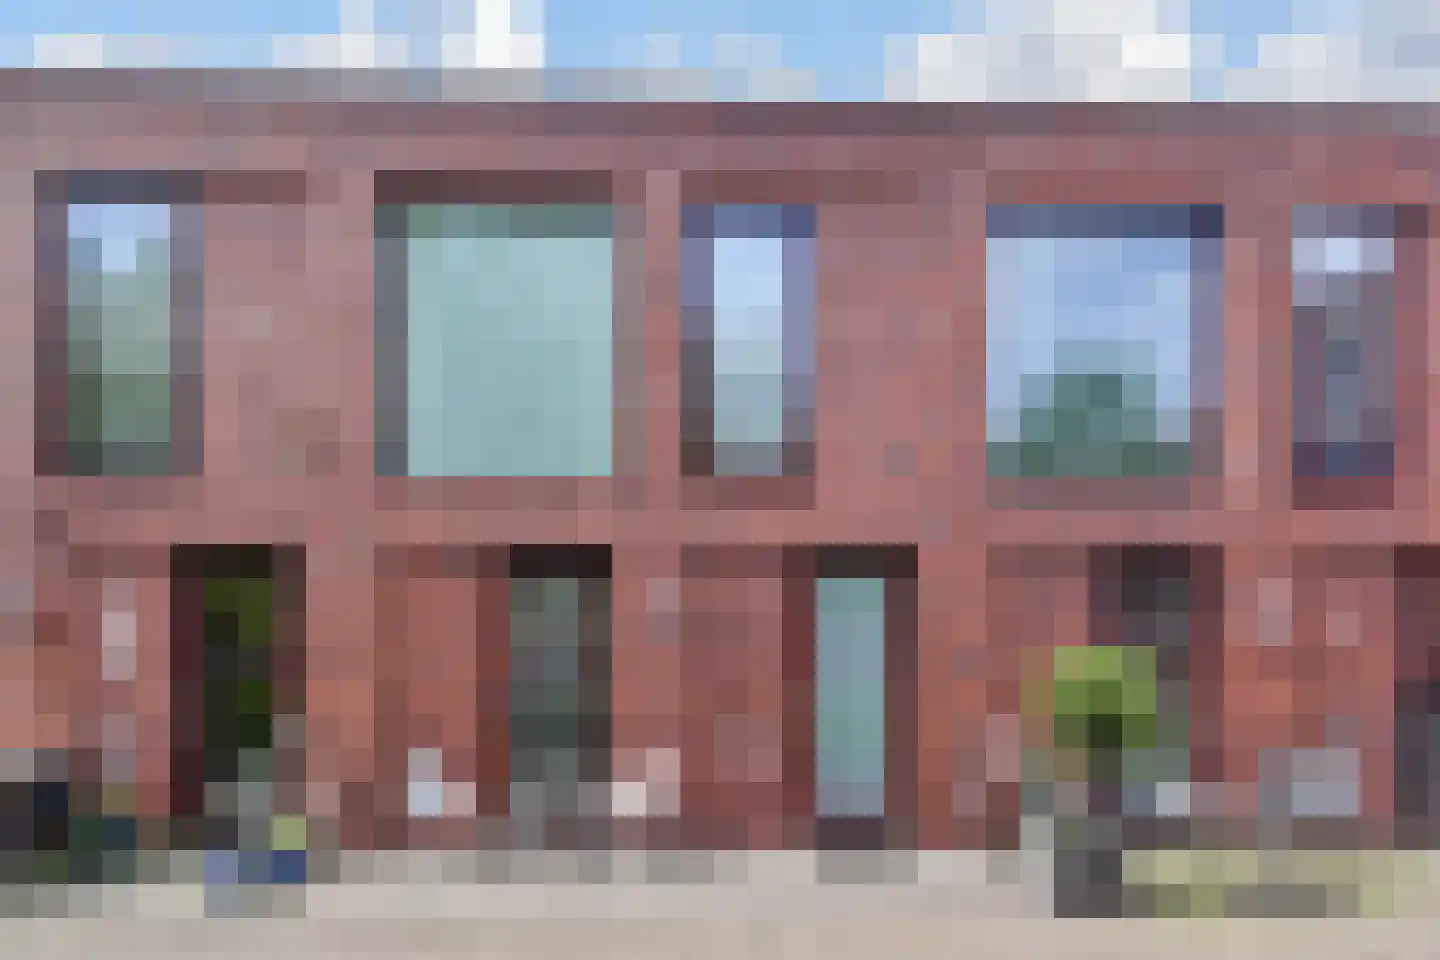
- Sold
Berkenhof 35
2631GJ Nootdorp
€ 575.000 k.k.
- Living area
- 122 m²
- Land area
- 153 m²
- Bedrooms
- 4
View 125 sold houses in Nootdorp
Type to search. Use arrow down and arrow up to navigate through results and press Enter to open.
Hidden search suggestions.
Compare sold homes in Nootdorp or view the current offering in this location directly.
On this page you will find recently sold homes in Nootdorp. Use this overview to better estimate selling prices, popular neighborhoods, and the local housing supply before you choose a real estate agent. Also view the current housing supply with 179 houses in Nootdorp.
2631GJ Nootdorp
€ 575.000 k.k.
2631ED Nootdorp
€ 22.500 k.k.
2631VM Nootdorp
€ 500.000 k.k.
€ 5.376/m²
2631LC Nootdorp
€ 500.000 k.k.
€ 4.464/m²
2631WB Nootdorp
€ 1.095.000 k.k.
€ 5.703/m²
2631ML Nootdorp
€ 949.500 k.k.
€ 4.654/m²
2631LA Nootdorp
€ 595.000 k.k.
€ 4.685/m²
2632AB Nootdorp
€ 449.500 k.k.
€ 4.241/m²
2632BG Nootdorp
€ 585.000 k.k.
€ 4.466/m²
2631BZ Nootdorp
€ 540.000 k.k.
€ 5.625/m²
2631PX Nootdorp
€ 1.095.000 k.k.
€ 5.793/m²
2631TD Nootdorp
€ 570.000 k.k.
€ 4.871/m²
2631LH Nootdorp
€ 675.000 k.k.
€ 4.821/m²
2632DA Nootdorp
€ 515.000 k.k.
€ 4.055/m²
2631TM Nootdorp
€ 875.000 k.k.
€ 5.368/m²
2631VC Nootdorp
€ 549.000 k.k.
€ 4.815/m²
2631CP Nootdorp
€ 739.000 k.k.
€ 6.598/m²
2631TL Nootdorp
€ 675.000 k.k.
€ 4.753/m²
2632GE Nootdorp
€ 550.000 k.k.
€ 4.135/m²
2631AV Nootdorp
€ 495.000 k.k.
€ 6.346/m²
2631XG Nootdorp
€ 725.000 k.k.
€ 4.898/m²
2632DS Nootdorp
€ 885.000 k.k.
€ 5.299/m²
2631JG Nootdorp
€ 550.000 k.k.
€ 4.867/m²
2631ST Nootdorp
€ 650.000 k.k.
€ 4.814/m²
2631TX Nootdorp
€ 883.000 k.k.
€ 5.450/m²
2631VV Nootdorp
€ 1.125.000 k.k.
€ 6.215/m²
2631HR Nootdorp
€ 525.000 k.k.
€ 4.133/m²
2631HE Nootdorp
€ 390.000 k.k.
€ 5.200/m²
Bekijk recente verkopen en ontvang gratis offertes van lokale verkoopmakelaars in Nootdorp.
Recent verkocht in Nootdorp? Lees de verkoopgerichte gids huis verkopen in Nootdorp, vergelijk verkoopmakelaars in Nootdorp of bekijk de beste verkoopmakelaars in Nootdorp voor referentie bij jouw keuze.
Makelaars maken scherpere voorstellen als ze weten dat je vergelijkt — vraag offertes aan voor verkoop of aankoop.
Short answers about housing prices, sold homes and comparing real estate agents in Nootdorp.
The costs of a real estate agent in Nootdorp vary per office, property type and sales approach. Therefore, compare multiple quotes and also look at the real estate agents in Nootdorp to better compare rates, presentation and local experience.
On this page we currently show 125 sold houses in Nootdorp from our selection. This helps you to better assess recent transactions and the local housing market.
Houses sold in Nootdorp give insight into asking prices, house types and neighborhoods where recent transactions have taken place. Compare this also with the current housing stock in Nootdorp to better understand the market.
Je kunt verkochte woningen gebruiken als eerste marktindicatie, maar een lokale makelaar kan beter rekening houden met afwerking, ligging, onderhoud en actuele vraag in Nootdorp. Plan de volgende stap via de gids huis verkopen in Nootdorp.
Vergelijk makelaars in Nootdorp op lokale verkoopervaring, reviews, verwachte opbrengst, courtage en marketingaanpak. Bekijk verkoopmakelaars in Nootdorp of de top 10 makelaars in Nootdorp om snel sterke kantoren te ontdekken.
View current location data on residents, WOZ development, housing stock, energy consumption, business activity and safety in Nootdorp. In 2025 were there 18.820 residents. The average WOZ value in 2025 is EUR 548.000.
These figures help to better assess and compare the housing stock in Nootdorp with recent sold homes. Orient yourself then on suitable top real estate agents in Nootdorp for sales advice in this region.
Residents
18.820
Last year: 2025
Average WOZ
EUR 548.000
Last year: 2025
Average income per person.
EUR 40.200
Source: AllNumbers
Crimes (current year)
530
Total registered
| Year | Residents |
|---|---|
| 2021 | 19.000 |
| 2022 | 19.040 |
| 2023 | 19.020 |
| 2024 | 18.965 |
| 2025 | 18.820 |
| Year | Average WOZ |
|---|---|
| 2021 | EUR 407.000 |
| 2022 | EUR 432.000 |
| 2023 | EUR 512.000 |
| 2024 | EUR 523.000 |
| 2025 | EUR 548.000 |
Hoger
5.160
Praktisch
3.750
Middelbaar
5.430
Europa
1.530
Nederland
13.200
Buiten Europa
4.085
Label A
3.384
Label B
1.418
Label C
1.177
Label A+
588
Label D
311
Label F
174
Label E
157
Label A++
125
Label G
110
Label A+++
51
Label A+++++
9
Label A++++
6
| Year | Gas (m3) | Electricity (kWh) |
|---|---|---|
| 2020 | 800 | 3.270 |
| 2021 | 900 | 3.300 |
| 2022 | 690 | 3.060 |
| 2023 | 610 | 2.850 |
| 2024 | 590 | 2.890 |
Hoekwoning
Gas: 820 • Electricity: 2.890
Huurwoning
Gas: 460 • Electricity: 2.170
Koopwoning
Gas: 670 • Electricity: 3.130
Appartement
Gas: 290 • Electricity: 2.120
Tussenwoning
Gas: 550 • Electricity: 2.700
Vrijstaande woning
Gas: 1.130 • Electricity: 4.610
Twee-onder-één-kap woning
Gas: 780 • Electricity: 3.620
Total number of company establishments: 2.675
| Period | Crimes |
|---|---|
| jan 2025 | 43 |
| jan 2026 | 52 |
| jul 2025 | 41 |
| jun 2025 | 54 |
| mei 2025 | 44 |
| mrt 2025 | 31 |
| nov 2024 | 43 |
| nov 2025 | 41 |
| okt 2024 | 49 |
| okt 2025 | 45 |
| sep 2024 | 57 |
| sep 2025 | 41 |
These figures give an indicative picture of safety trends in the living environment of Nootdorp.
Short answers based on current local statistics, handy for a quick comparison of the living environment.
Nootdorp telt in 2025 ongeveer 18.820 inwoners.
De gemiddelde WOZ-waarde in Nootdorp is in 2025 circa € 548.000.
Het gemiddelde inkomen per inwoner in Nootdorp ligt rond € 40.200 per jaar.
Voor het huidige jaar gaat het om ongeveer 530 geregistreerde misdrijven. Gebruik deze cijfers als indicatie en vergelijk trends per periode.
In Nootdorp komt vooral "Tussenwoningen" veel voor, met ongeveer 2.889 woningen.