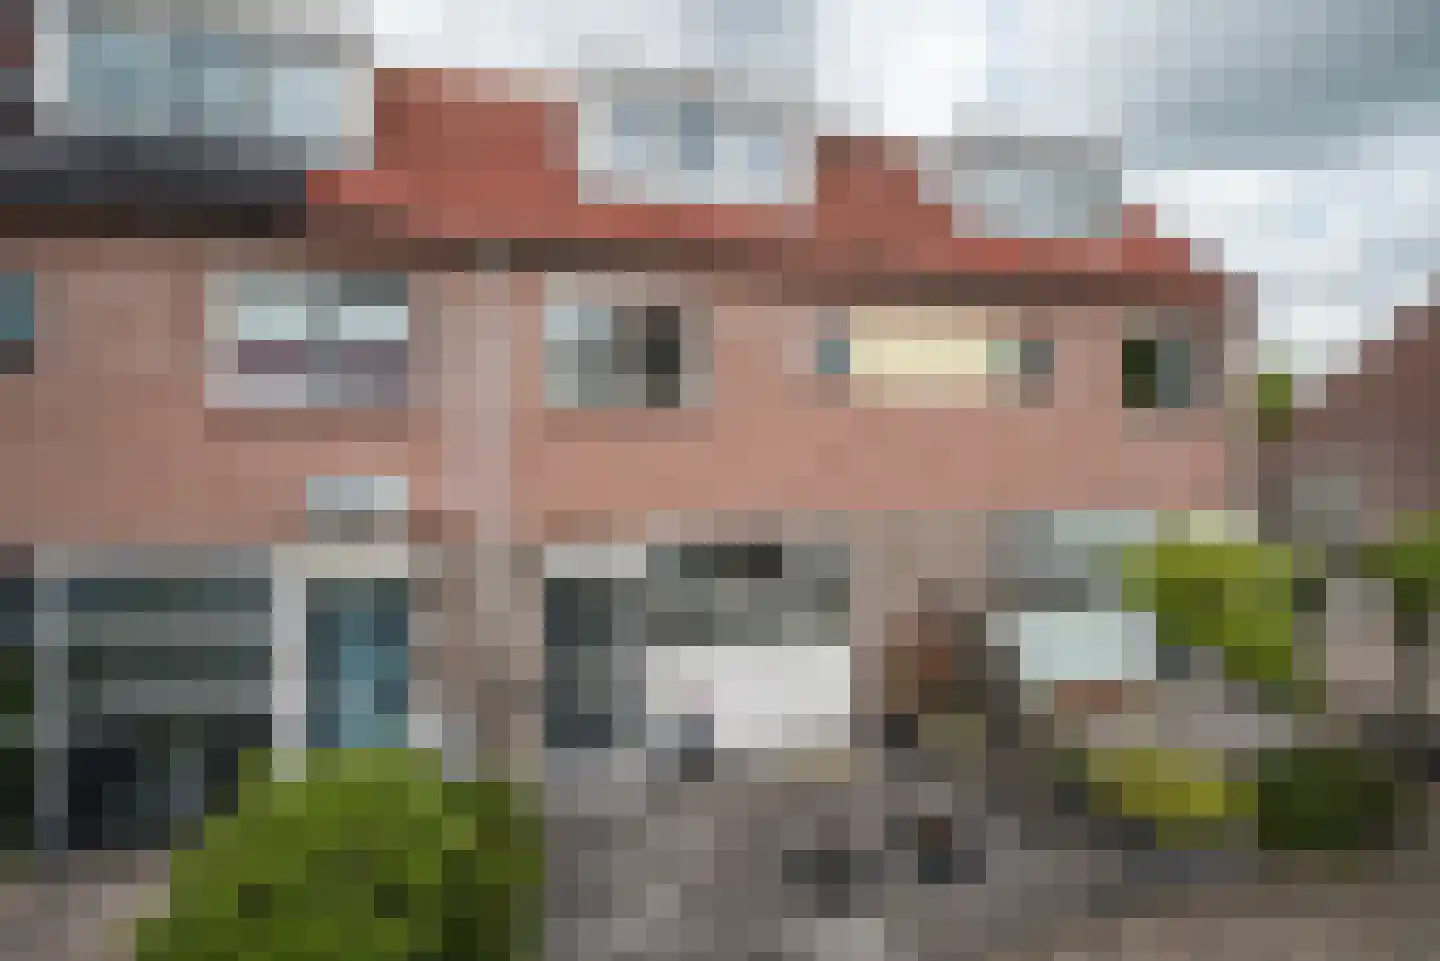
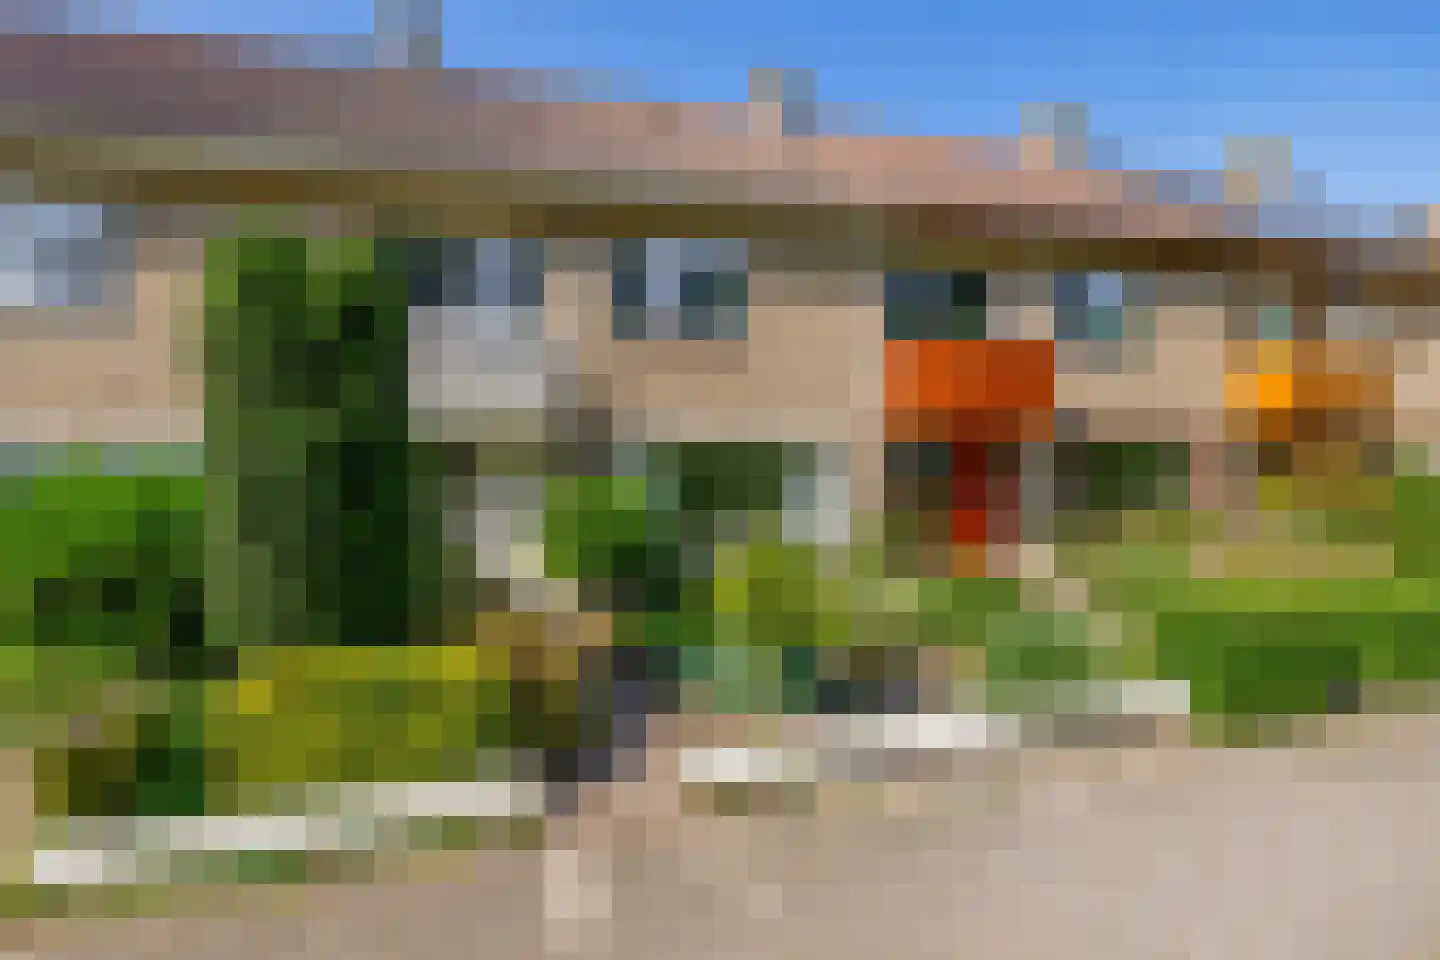
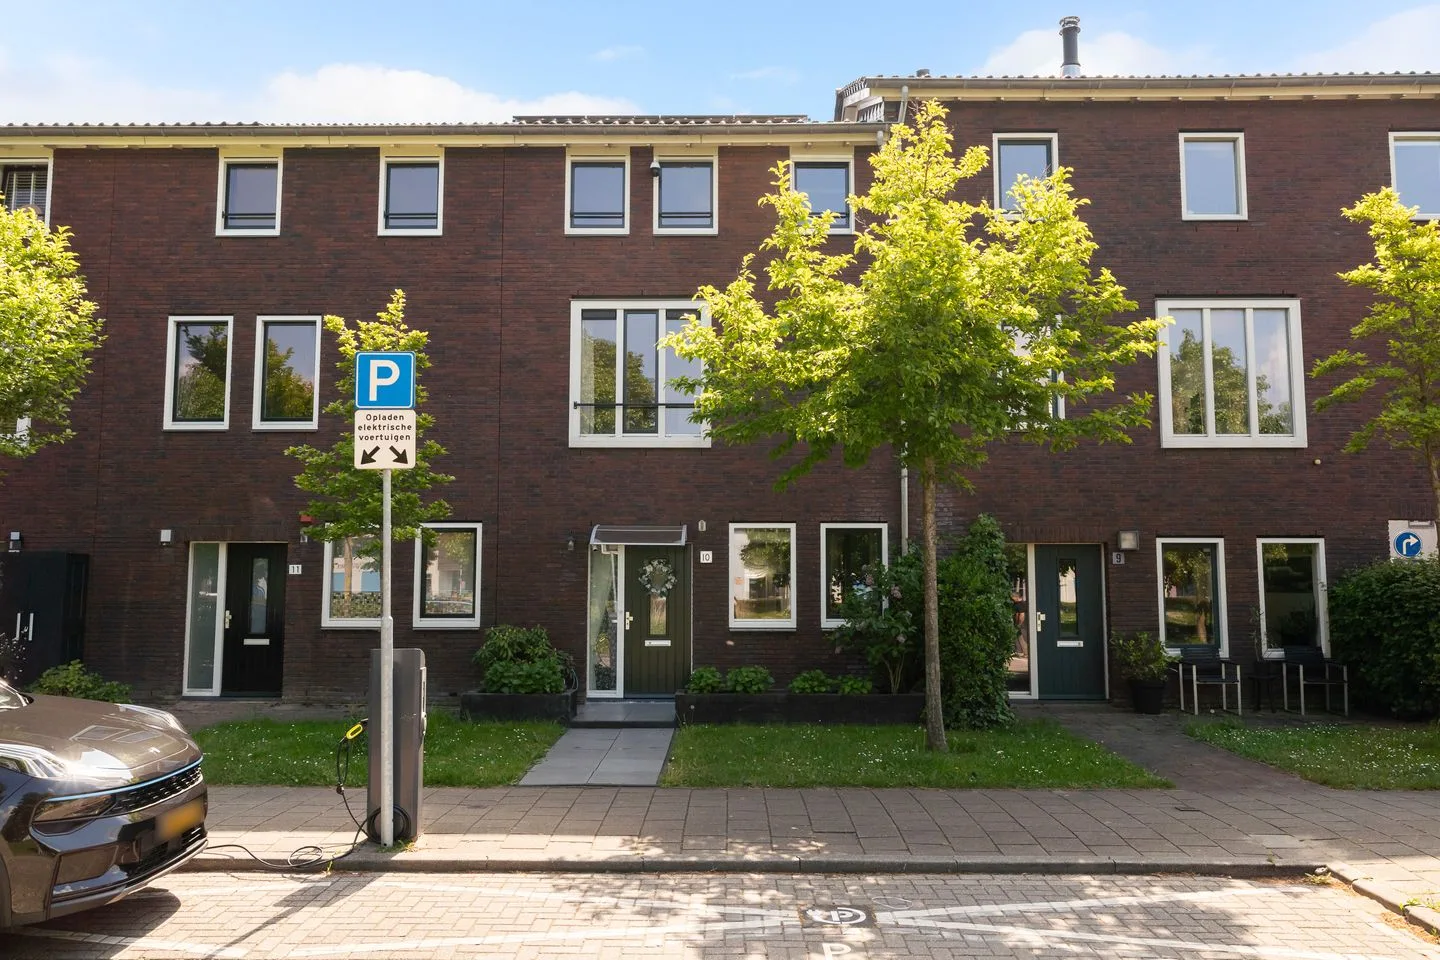
- Available
Pikeur 3
2632GE Nootdorp
€ 525.000 k.k.
€ 4.688/m²
- Living area
- 112 m²
- Land area
- —
- Bedrooms
- 3
Searching in 176 houses in Nootdorp
Type to search. Use arrow down and arrow up to navigate through results and press Enter to open.
Hidden search suggestions.
View current properties in Nootdorp or search targeted on street, postal code and property characteristics.
View the current housing stock in Nootdorp and quickly filter by price, living area, rooms and more. There are currently 176 houses in this place within our selection. View also 121 sold houses in Nootdorp for extra insight into the local housing market.
2632GE Nootdorp
€ 525.000 k.k.
€ 4.688/m²
2631VM Nootdorp
€ 500.000 k.k.
€ 5.376/m²
2631CB Nootdorp
€ 1.650.000 k.k.
€ 4.377/m²
2631SM Nootdorp
€ 595.000 k.k.
€ 4.837/m²
2631XJ Nootdorp
€ 750.000 k.k.
€ 4.573/m²
2632GM Nootdorp
€ 400.000 k.k.
€ 4.819/m²
2632GD Nootdorp
€ 439.000 k.k.
€ 5.289/m²
2631HW Nootdorp
€ 645.000 k.k.
€ 4.329/m²
2631VB Nootdorp
€ 525.000 k.k.
€ 4.861/m²
2632GM Nootdorp
€ 550.000 k.k.
€ 4.167/m²
2632BH Nootdorp
€ 475.000 k.k.
€ 4.358/m²
2631VL Nootdorp
€ 525.000 k.k.
€ 4.907/m²
2631NH Nootdorp
€ 1.550.000 k.k.
€ 6.327/m²
2631LC Nootdorp
€ 589.000 k.k.
€ 5.078/m²
2631SZ Nootdorp
€ 1.250.000 k.k.
€ 6.510/m²
2631TR Nootdorp
€ 1.025.000 k.k.
€ 5.256/m²
2632EL Nootdorp
€ 569.500 k.k.
€ 4.746/m²
2631JJ Nootdorp
€ 575.000 k.k.
€ 4.915/m²
2632DA Nootdorp
€ 589.000 k.k.
€ 4.462/m²
2631DS Nootdorp
€ 595.000 k.k.
€ 4.798/m²
2631BM Nootdorp
€ 685.000 k.k.
€ 4.628/m²
2631TT Nootdorp
€ 529.000 k.k.
€ 4.853/m²
2631PJ Nootdorp
€ 1.650.000 k.k.
€ 5.830/m²
2631BN Nootdorp
€ 250.000 k.k.
€ 3.378/m²
2631MH Nootdorp
€ 935.000 k.k.
€ 5.312/m²
2631XJ Nootdorp
€ 700.000 k.k.
2632GM Nootdorp
€ 575.000 k.k.
2632EL Nootdorp
€ 569.500 k.k.
Get free quotes from real estate agents with local market knowledge. Compare more than 306 real estate agents in Nootdorp.
Selling a home in Nootdorp? View the sales-oriented guide sell a house in Nootdorp, compare all real estate agents in Nootdorp or view the top 10 real estate agents in Nootdorp for extra context to your choice.
Real estate agents make sharper offers when they know you're comparing — ask for quotes for sale or purchase.
Practical answers about housing supply, sales and comparing real estate agents in Nootdorp.
The costs of a real estate agent in Nootdorp depend on commission, setup costs, property presentation and the chosen service. Compare the 306 real estate agents in Nootdorp via the real estate agent page and request multiple quotes to compare rates and approach well.
Within our selection, we are currently showing 176 houses in Nootdorp. View also the sold houses in Nootdorp to compare the current offering with recent transactions.
Take into account not only price and living area but also maintenance, energy label, location, outdoor space and sales status. This way you compare houses in Nootdorp on more than just the asking price.
A local real estate agent knows the neighborhoods, recent transactions and demand in Nootdorp. By comparing 306 real estate agents in the region you get a better insight into prices, sales strategy and expected yield; the top 10 in Nootdorp provides a useful starting point.
Yes, when making a sales plan, a valuation in Nootdorp is wise. You gain insight into a realistic asking price and can then compare offers from real estate agents specifically.
View current location data on residents, WOZ development, housing stock, energy consumption, business activity and safety in Nootdorp. In 2025 were there 18.820 residents. The average WOZ value in 2025 is EUR 548.000.
These figures help to better assess and compare the housing stock in Nootdorp with recent sold homes. Orient yourself then on suitable top real estate agents in Nootdorp for sales advice in this region.
Residents
18.820
Last year: 2025
Average WOZ
EUR 548.000
Last year: 2025
Average income per person.
EUR 40.200
Source: AllNumbers
Crimes (current year)
530
Total registered
| Year | Residents |
|---|---|
| 2021 | 19.000 |
| 2022 | 19.040 |
| 2023 | 19.020 |
| 2024 | 18.965 |
| 2025 | 18.820 |
| Year | Average WOZ |
|---|---|
| 2021 | EUR 407.000 |
| 2022 | EUR 432.000 |
| 2023 | EUR 512.000 |
| 2024 | EUR 523.000 |
| 2025 | EUR 548.000 |
Hoger
5.160
Praktisch
3.750
Middelbaar
5.430
Europa
1.530
Nederland
13.200
Buiten Europa
4.085
Label A
3.384
Label B
1.418
Label C
1.177
Label A+
588
Label D
311
Label F
174
Label E
157
Label A++
125
Label G
110
Label A+++
51
Label A+++++
9
Label A++++
6
| Year | Gas (m3) | Electricity (kWh) |
|---|---|---|
| 2020 | 800 | 3.270 |
| 2021 | 900 | 3.300 |
| 2022 | 690 | 3.060 |
| 2023 | 610 | 2.850 |
| 2024 | 590 | 2.890 |
Hoekwoning
Gas: 820 • Electricity: 2.890
Huurwoning
Gas: 460 • Electricity: 2.170
Koopwoning
Gas: 670 • Electricity: 3.130
Appartement
Gas: 290 • Electricity: 2.120
Tussenwoning
Gas: 550 • Electricity: 2.700
Vrijstaande woning
Gas: 1.130 • Electricity: 4.610
Twee-onder-één-kap woning
Gas: 780 • Electricity: 3.620
Total number of company establishments: 2.675
| Period | Crimes |
|---|---|
| jan 2025 | 43 |
| jan 2026 | 52 |
| jul 2025 | 41 |
| jun 2025 | 54 |
| mei 2025 | 44 |
| mrt 2025 | 31 |
| nov 2024 | 43 |
| nov 2025 | 41 |
| okt 2024 | 49 |
| okt 2025 | 45 |
| sep 2024 | 57 |
| sep 2025 | 41 |
These figures give an indicative picture of safety trends in the living environment of Nootdorp.
Short answers based on current local statistics, handy for a quick comparison of the living environment.
Nootdorp telt in 2025 ongeveer 18.820 inwoners.
De gemiddelde WOZ-waarde in Nootdorp is in 2025 circa € 548.000.
Het gemiddelde inkomen per inwoner in Nootdorp ligt rond € 40.200 per jaar.
Voor het huidige jaar gaat het om ongeveer 530 geregistreerde misdrijven. Gebruik deze cijfers als indicatie en vergelijk trends per periode.
In Nootdorp komt vooral "Tussenwoningen" veel voor, met ongeveer 2.889 woningen.