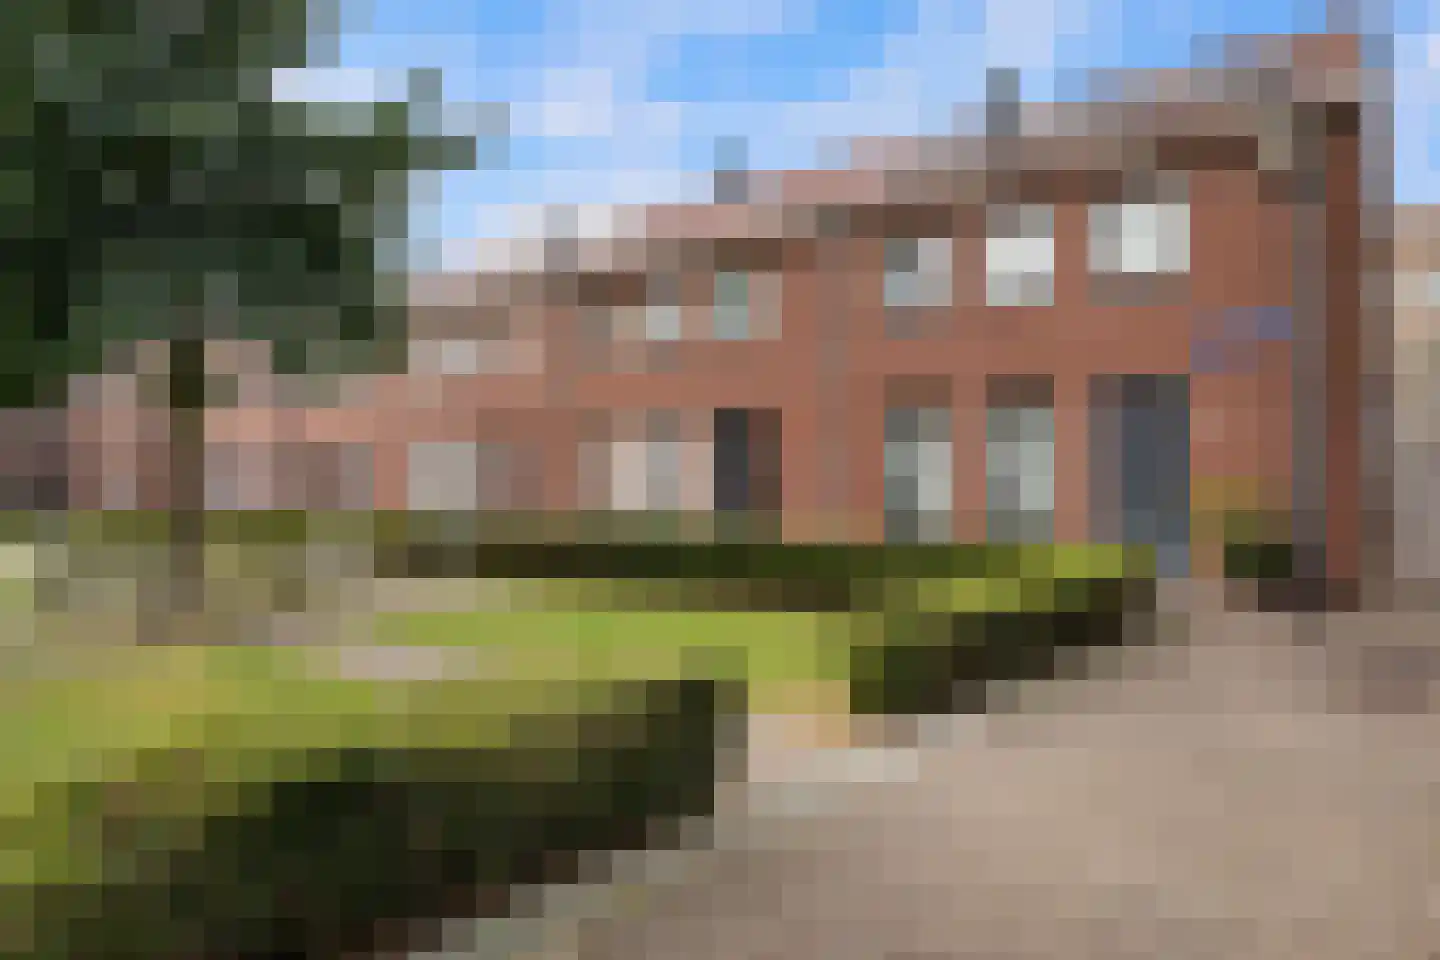
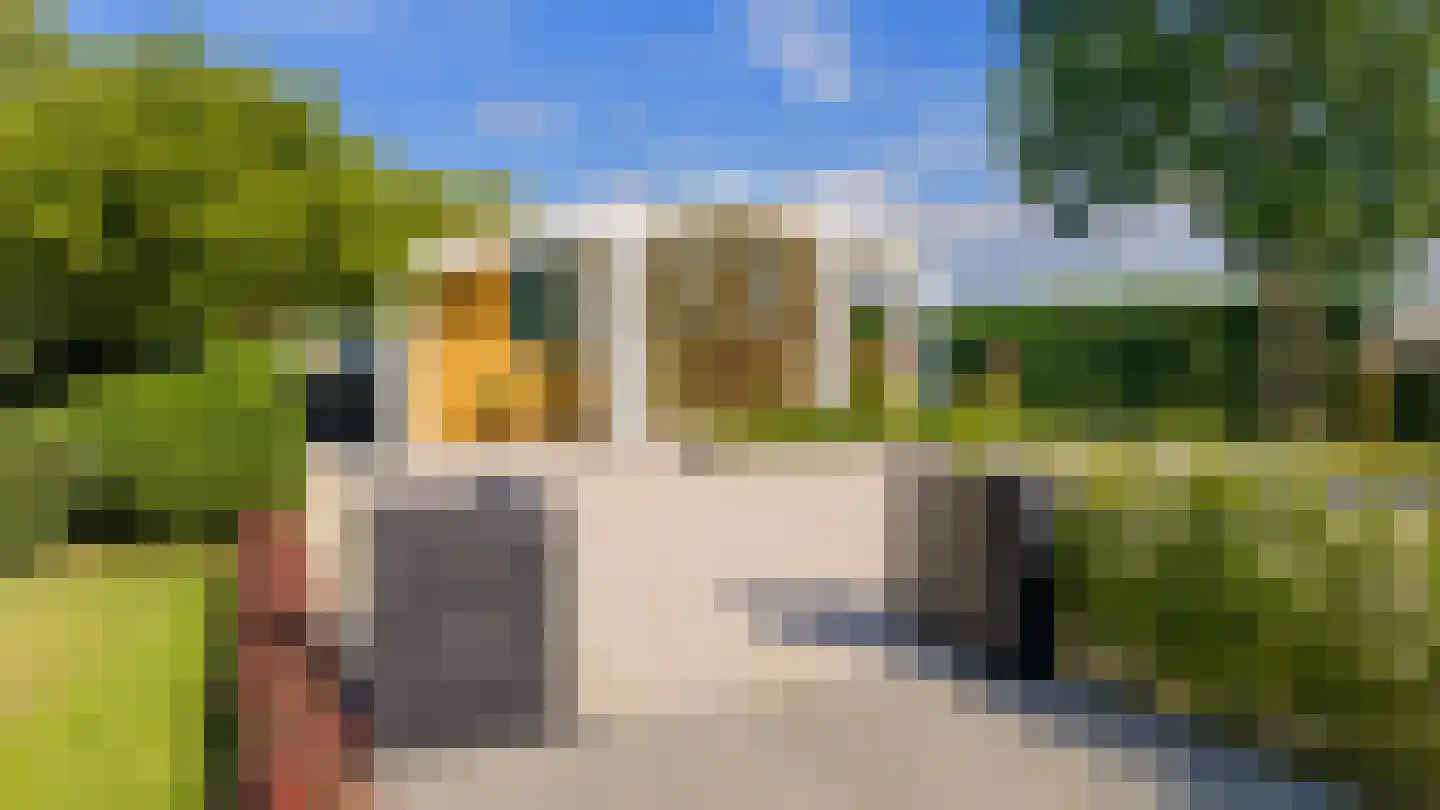
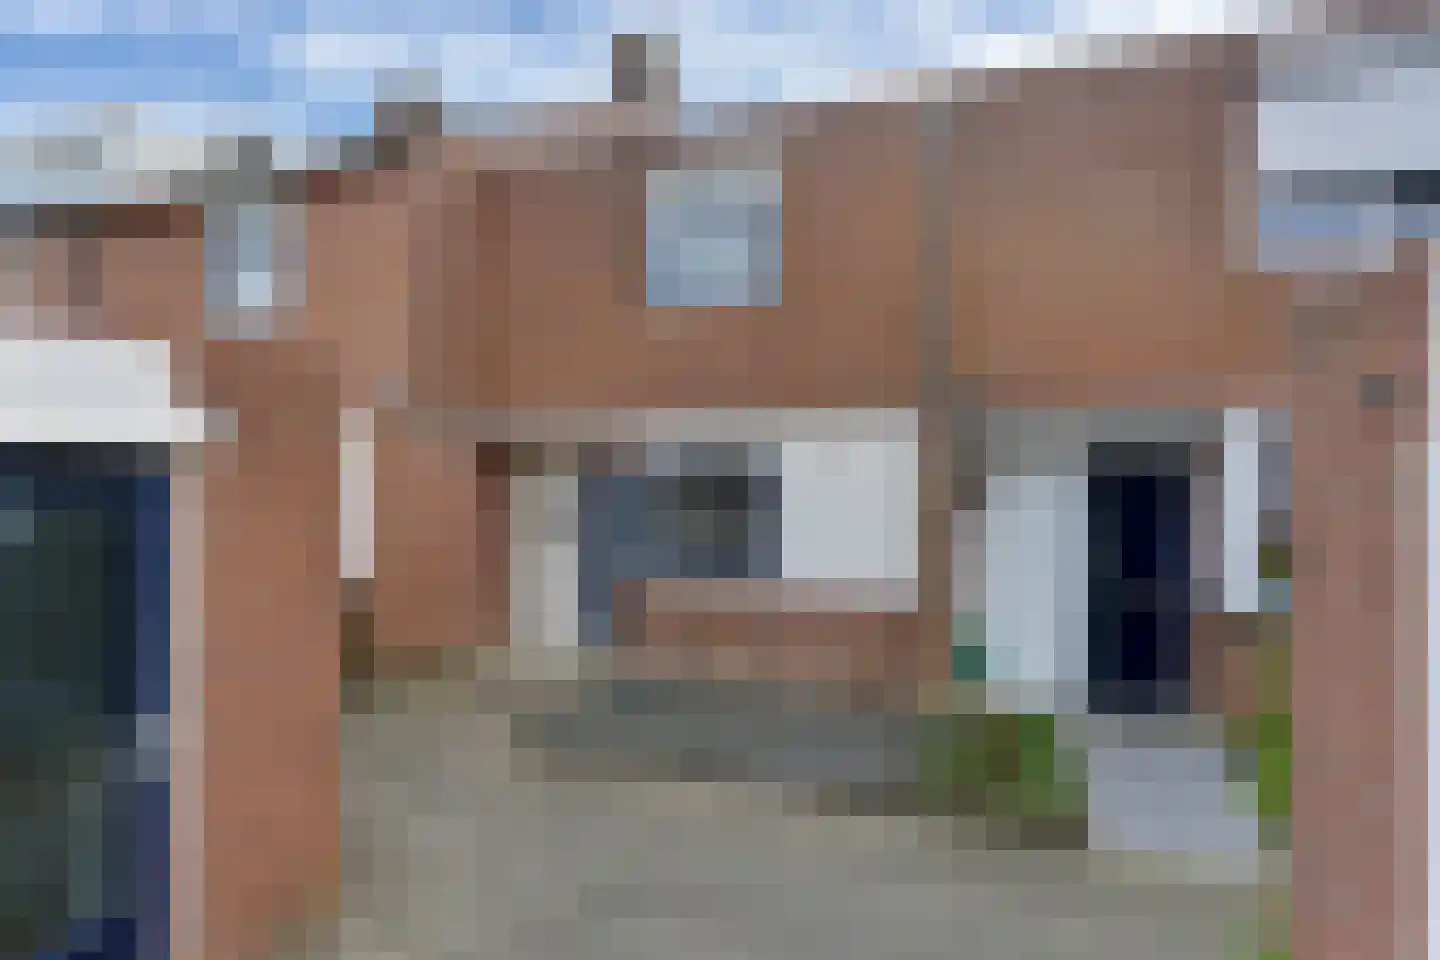
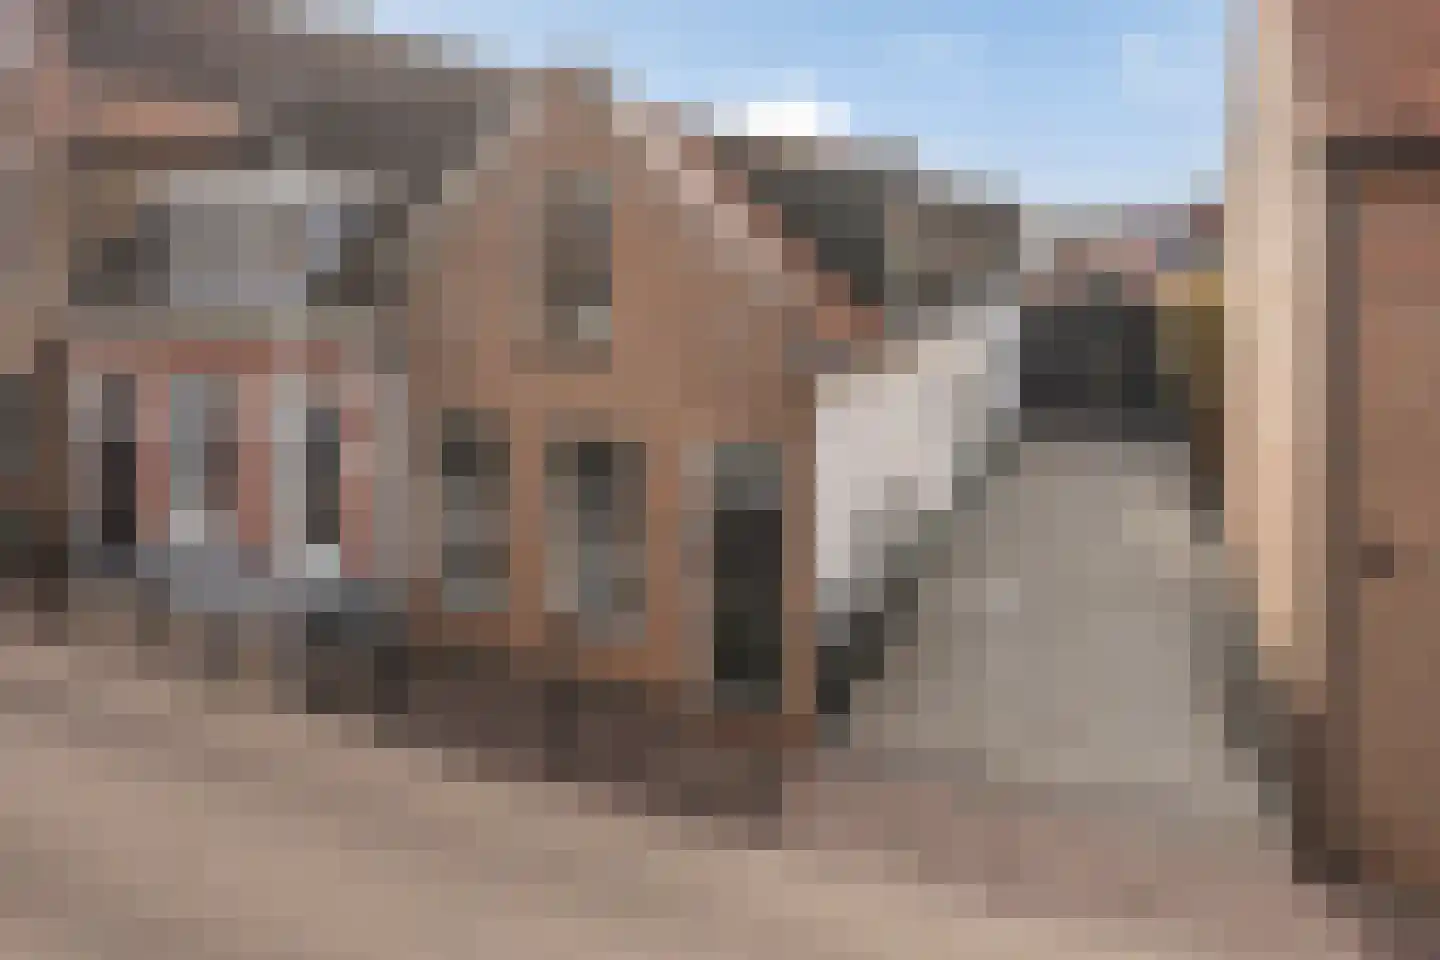
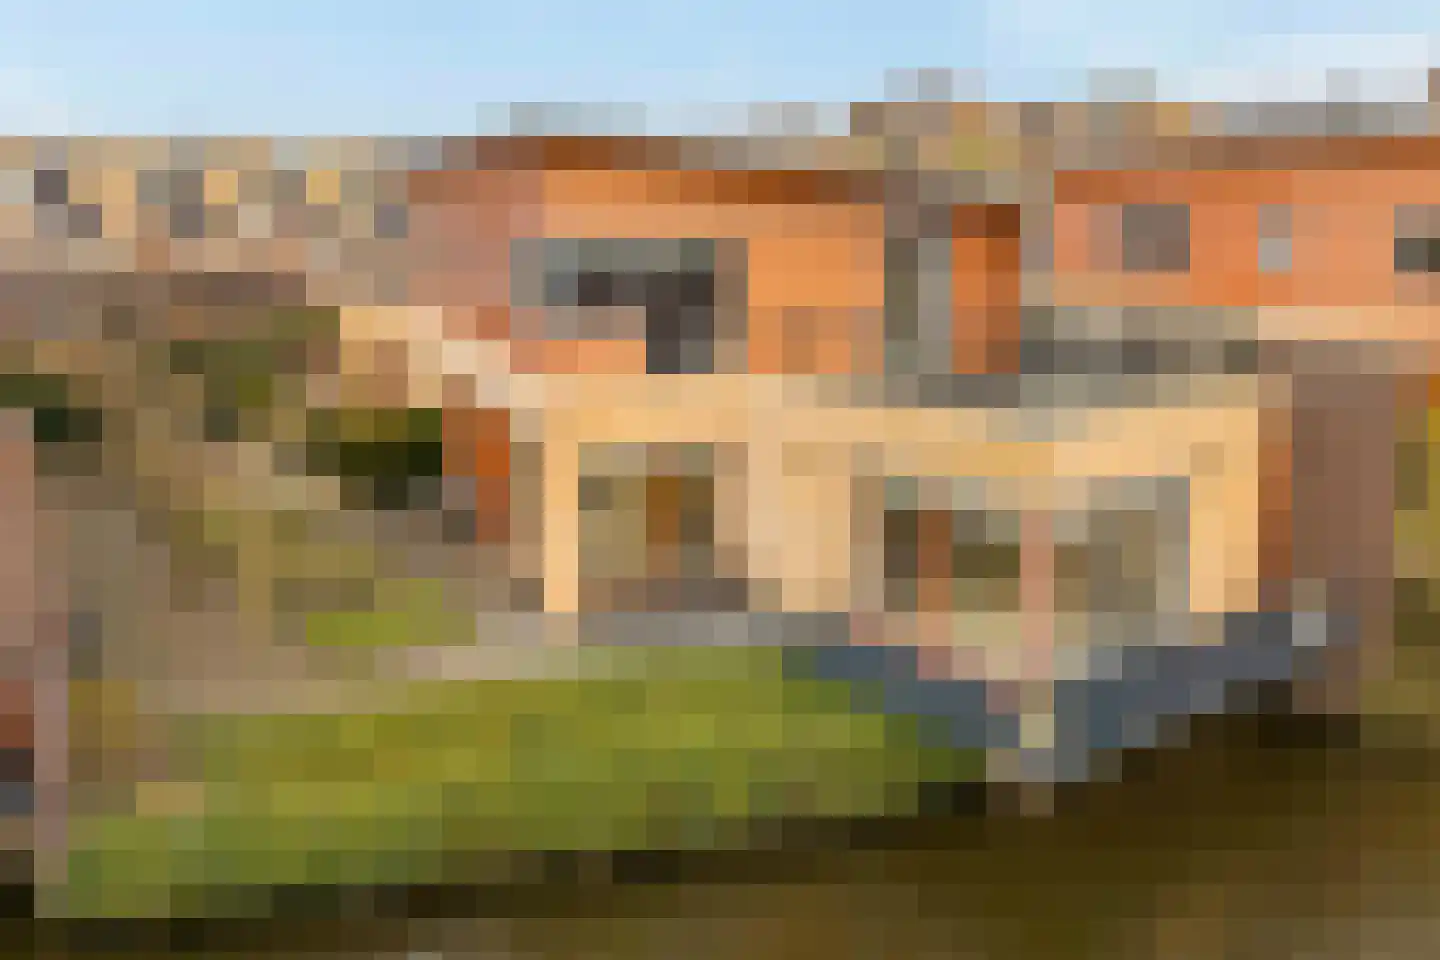
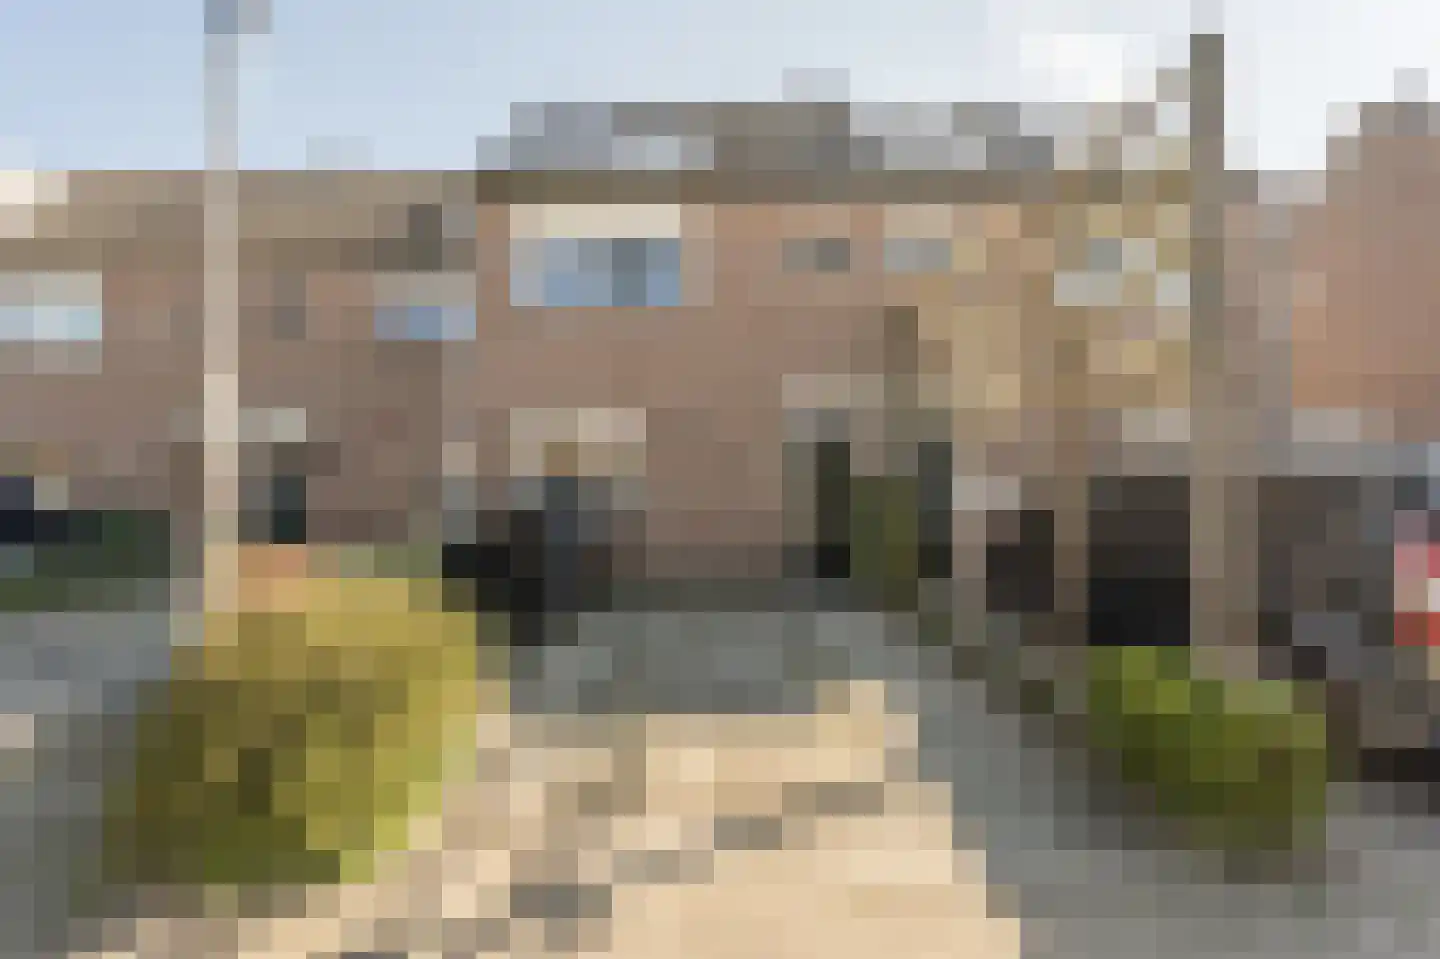
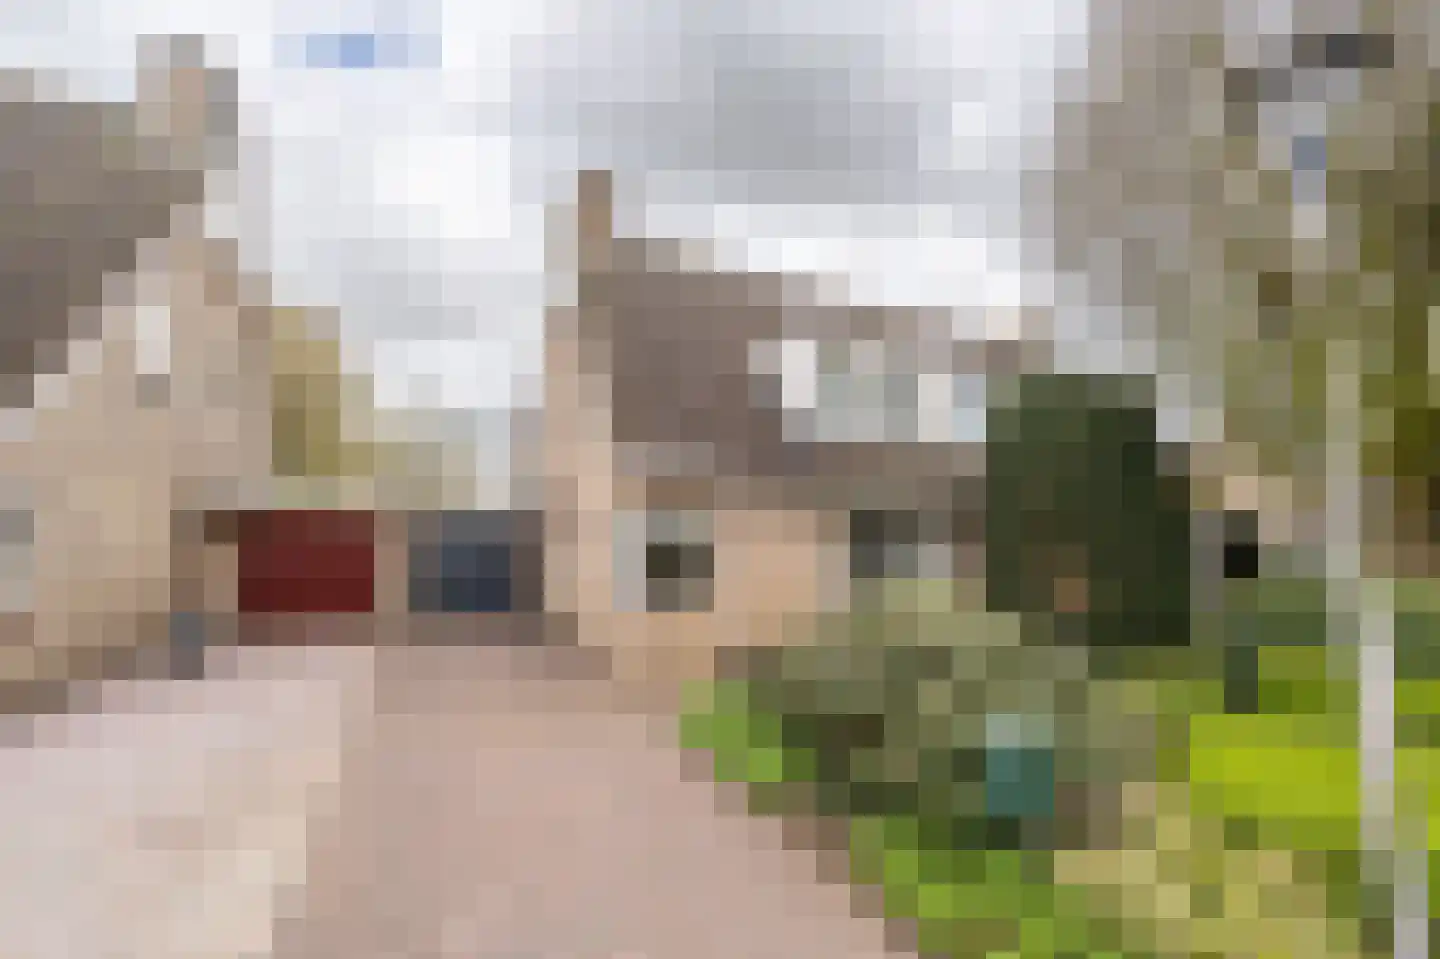
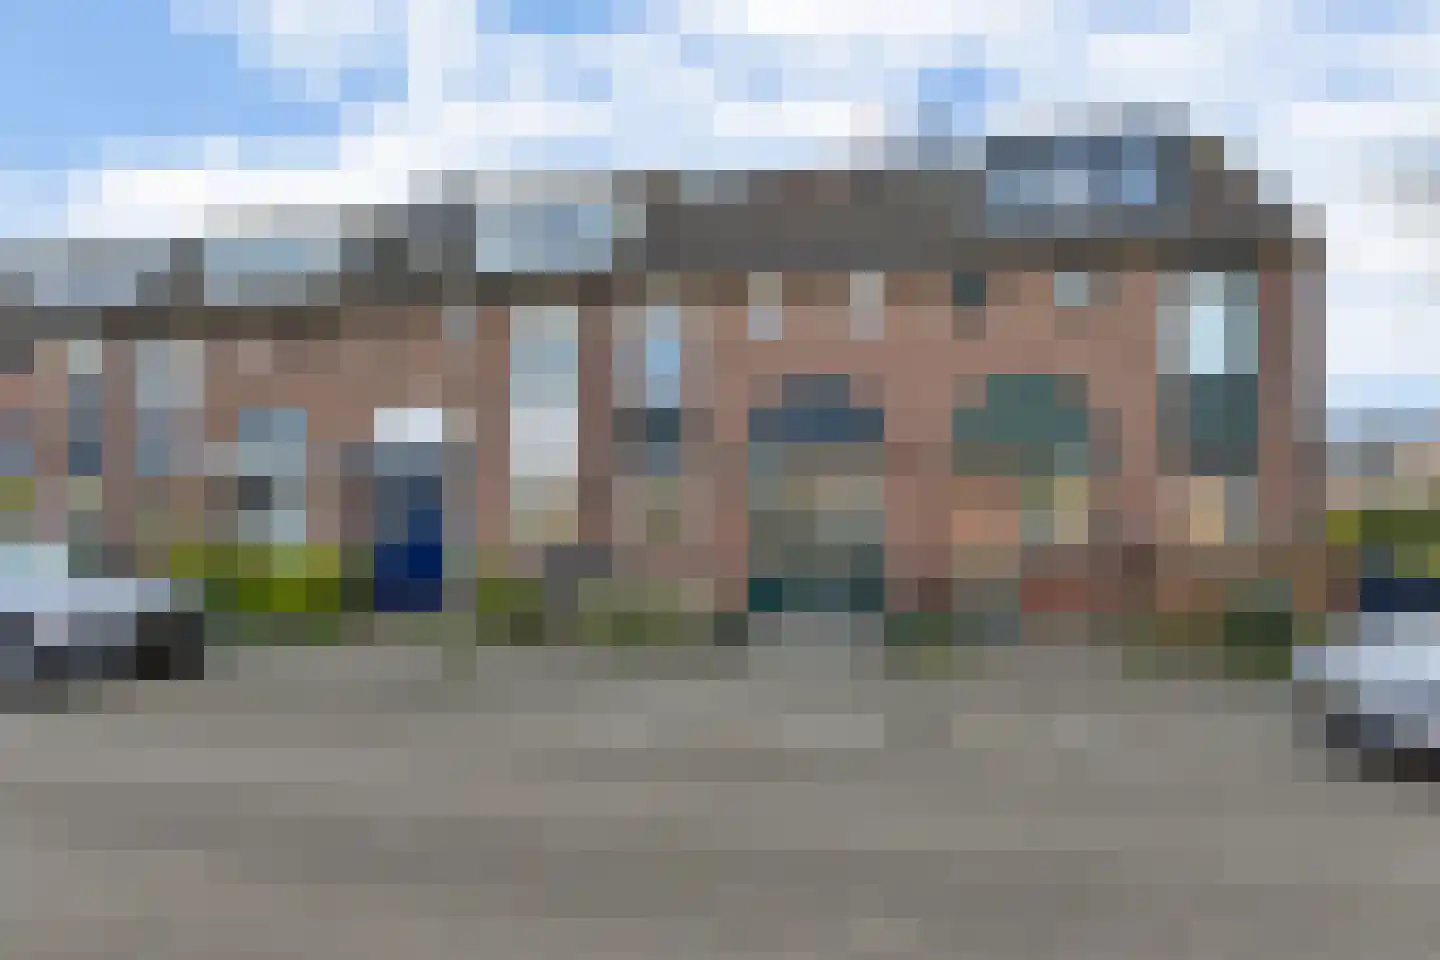
Woningaanbod in Oud-Beijerland

Gevonden: 282 houses in Oud-Beijerland binnen je selectie

Connected to: Vastgoed Nederland NVM Makelaars

Bekijk het actuele woningaanbod in Oud-Beijerland en filter snel op prijs, woonoppervlakte, kamers en meer. Er staan momenteel 282 houses in deze plaats binnen onze selectie. Bekijk daarnaast 218 verkochte houses in Oud-Beijerland voor extra inzicht in de lokale woningmarkt.

Selection

Search and filter homes

Set your preferences and discover homes that suit you.

Total supply 239.855
Filters

Set price, area and other characteristics. Adjust a filter or click on Show homes. Location changes directly above.

Reset filters

You search for

  • Place Oud-Beijerland

Woning verkopen in Oud-Beijerland? Vergelijk makelaarsoffertes

Ontvang gratis offertes van makelaars met lokale marktkennis in Oud-Beijerland.

Free request a quote

  • Quotes in Oud-Beijerland
  • Non-binding
  • Personal
  • Free property website

Woning verkopen in Oud-Beijerland? Vergelijk makelaars die de lokale woningmarkt kennen. Bekijk ook alle makelaars in Oud-Beijerland of de top 10 makelaars in Oud-Beijerland voor extra context bij je keuze.

Save an average of €5000,-

By comparing brokers and requesting quotes

Veelgestelde vragen over woningen in Oud-Beijerland

Praktische antwoorden over woningaanbod, verkoop en makelaars vergelijken in Oud-Beijerland.

Residential and neighborhood statistics in Oud-Beijerland

View current location data on residents, WOZ development, housing stock, energy consumption, business activity and safety in Oud-Beijerland. In 2025 were there 25.065 residents. The average WOZ value in 2025 is EUR 397.000.

Deze cijfers helpen om het woningaanbod in Oud-Beijerland beter te beoordelen en te vergelijken met recente verkochte woningen. Oriënteer je daarna op passende topmakelaars in Oud-Beijerland voor verkoopadvies in deze regio.

Residents

25.065

Last year: 2025

Average WOZ

EUR 397.000

Last year: 2025

Average income per person.

EUR 36.200

Source: AllNumbers

Crimes (current year)

728

Total registered

Demographics and WOZ development

Inhabitants per year

Inhabitants per year in Oud-Beijerland
Year Residents
2021 24.665
2022 24.825
2023 24.895
2024 24.860
2025 25.065

Annual WOZ value

WOZ value per year in Oud-Beijerland
Year Average WOZ
2021 EUR 285.000
2022 EUR 314.000
2023 EUR 364.000
2024 EUR 379.000
2025 EUR 397.000

Composition of residents

Age build-up

65+: 5.875 0-15: 3.995 15-25: 2.940 25-45: 5.645 45-65: 6.610

Education level

Hoger

5.810

Praktisch

4.300

Middelbaar

8.110

Origin of residents (2025)

Europa

1.175

Nederland

21.710

Buiten Europa

2.180

Housing stock and construction periods

Types of homes

Hoekwoningen 2.358
Appartementen 2.733
Tussenwoningen 4.792
Vrijstaande woningen 811
Twee-onder-één-kap woningen 581

Construction period of buildings

Voor 1700 5
1700 tot 1900 170
1900 tot 1925 441
1925 tot 1950 523
1950 tot 1970 1.822
1970 tot 1980 1.958
1980 tot 1990 2.092
1990 tot 2000 1.097
2000 tot 2010 807
2010 tot 2020 603
2020 en later 197

Energy and sustainability

Energy label distribution

Label C

3.856

Label A

2.763

Label B

1.928

Label D

853

Label G

574

Label E

449

Label F

374

Label A+++

282

Label A+

248

Label A++

94

Label A++++

77

Label A+++++

7

Average energy consumption per year

Average energy consumption per year in Oud-Beijerland
Year Gas (m3) Electricity (kWh)
2020 1.080 2.950
2021 1.210 3.030
2022 920 2.800
2023 790 2.620
2024 760 2.700

Consumption per house type

Hoekwoning

Gas: 900 • Electricity: 2.810

Huurwoning

Gas: 640 • Electricity: 2.000

Koopwoning

Gas: 860 • Electricity: 2.920

Appartement

Gas: 530 • Electricity: 1.940

Tussenwoning

Gas: 750 • Electricity: 2.540

Vrijstaande woning

Gas: 1.290 • Electricity: 4.240

Twee-onder-één-kap woning

Gas: 1.050 • Electricity: 3.250

Business activity in Oud-Beijerland (2025)

Handel en HORECA 650
Nijverheid en energie 405
Zakelijke dienstverlening 855
Overheid, onderwijs en zorg 525
Landbouw, bosbouw en visserij 40
Vervoer, informatie en communicatie 215
Financiele diensten en onroerendgoed 285
Cultuur, recreatie en overige diensten 345

Total number of company establishments: 3.325

Recent crime statistics

Recent crime statistics in Oud-Beijerland
Period Crimes
jan 2025 65
jan 2026 63
jul 2025 62
jun 2025 85
mei 2025 46
mrt 2025 74
nov 2024 54
nov 2025 59
okt 2024 65
okt 2025 68
sep 2024 52
sep 2025 53

These figures give an indicative picture of safety trends in the living environment of Oud-Beijerland.

Frequently asked questions about living in Oud-Beijerland

Short answers based on current local statistics, handy for a quick comparison of the living environment.

Hoeveel inwoners heeft Oud-Beijerland?

Oud-Beijerland telt in 2025 ongeveer 25.065 inwoners.

Wat is de gemiddelde WOZ-waarde in Oud-Beijerland?

De gemiddelde WOZ-waarde in Oud-Beijerland is in 2025 circa € 397.000.

Wat is het gemiddelde inkomen per inwoner in Oud-Beijerland?

Het gemiddelde inkomen per inwoner in Oud-Beijerland ligt rond € 36.200 per jaar.

Hoe veilig is wonen in Oud-Beijerland?

Voor het huidige jaar gaat het om ongeveer 728 geregistreerde misdrijven. Gebruik deze cijfers als indicatie en vergelijk trends per periode.

Welke woningtypen komen het meest voor in Oud-Beijerland?

In Oud-Beijerland komt vooral "Tussenwoningen" veel voor, met ongeveer 4.792 woningen.