- Available
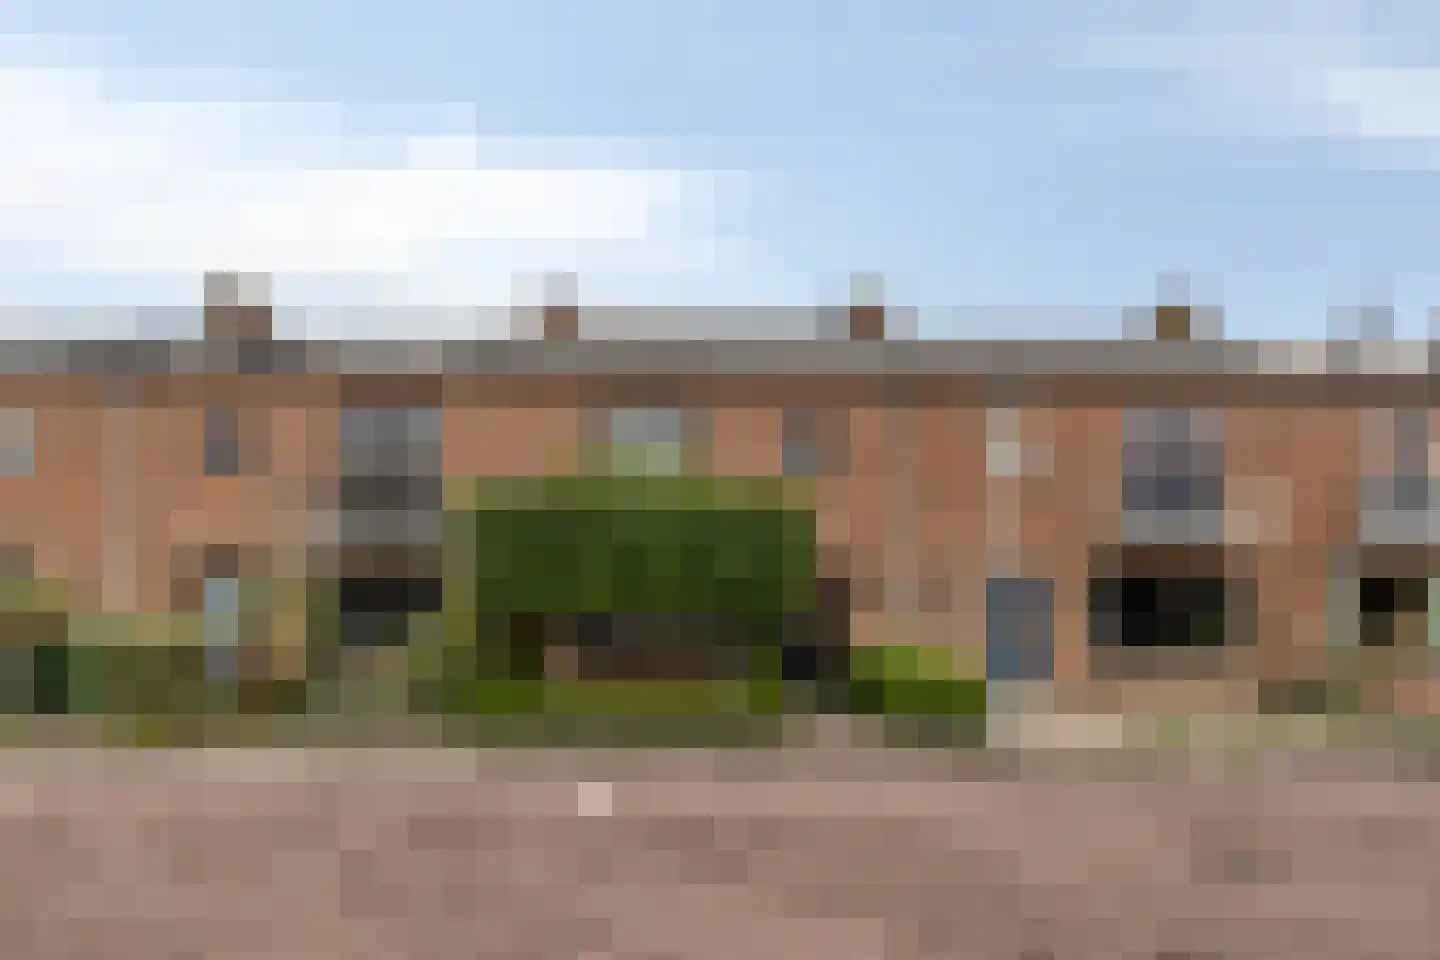
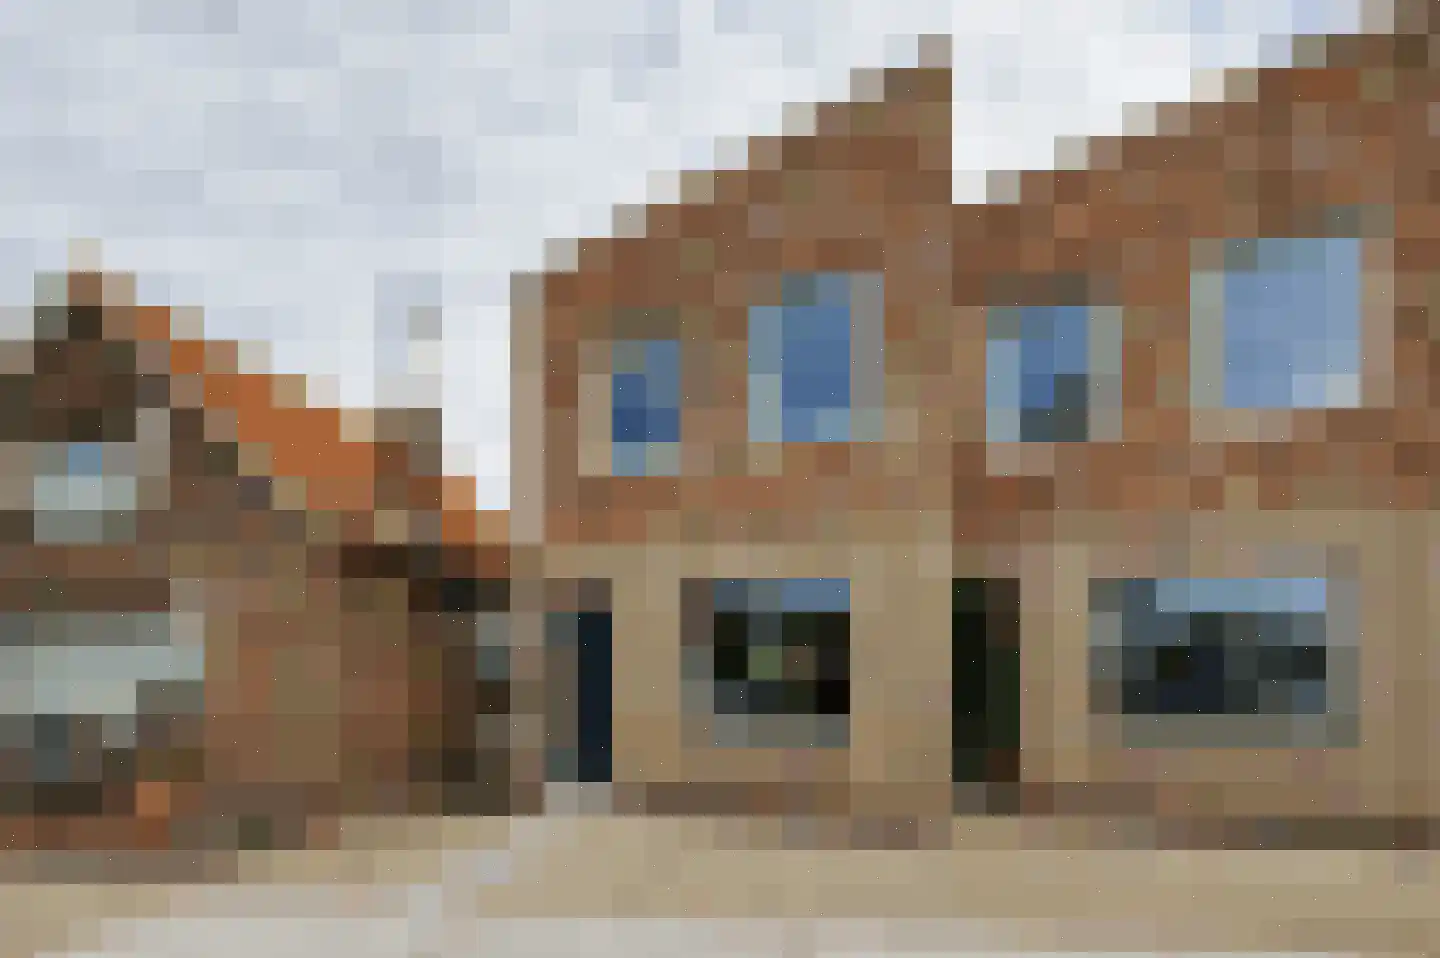
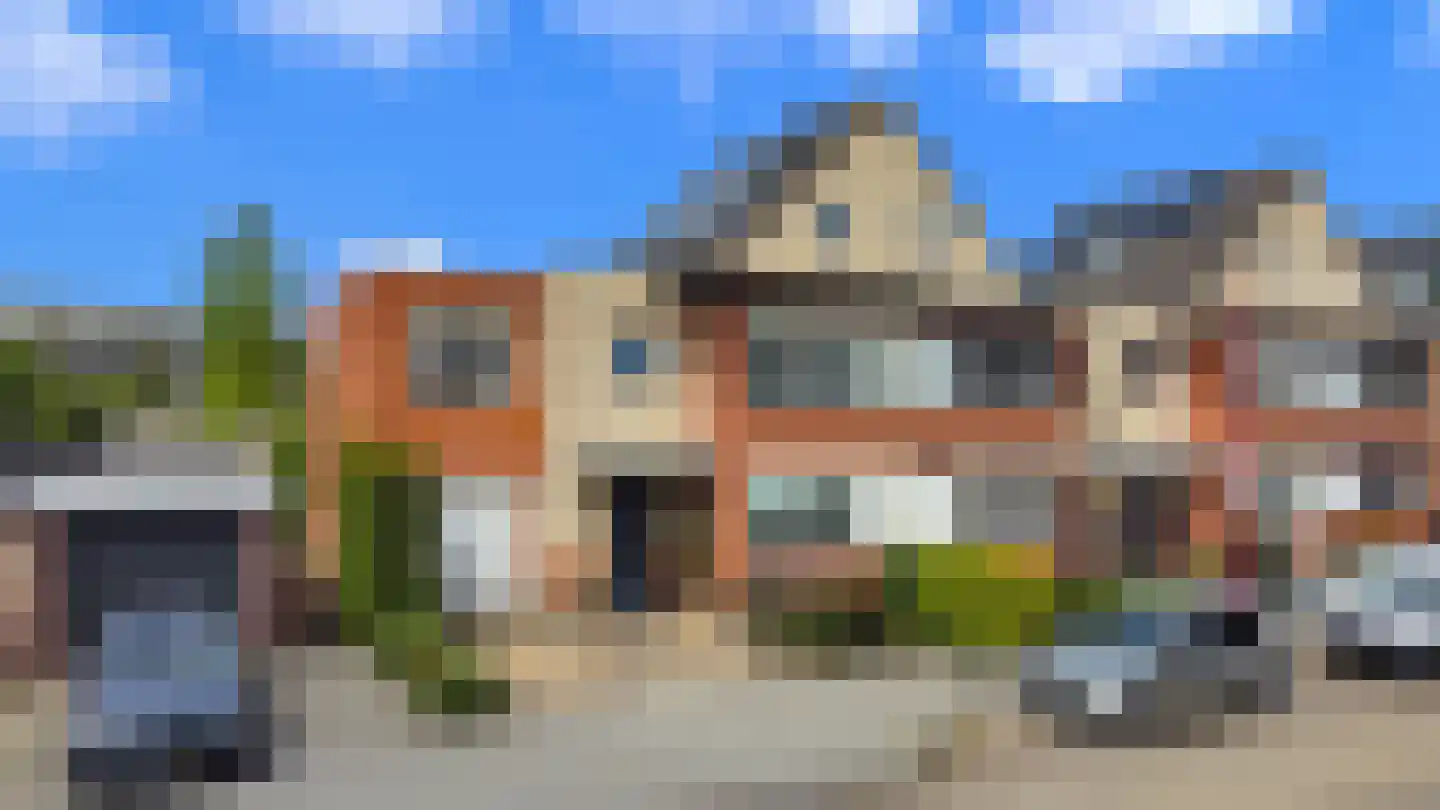
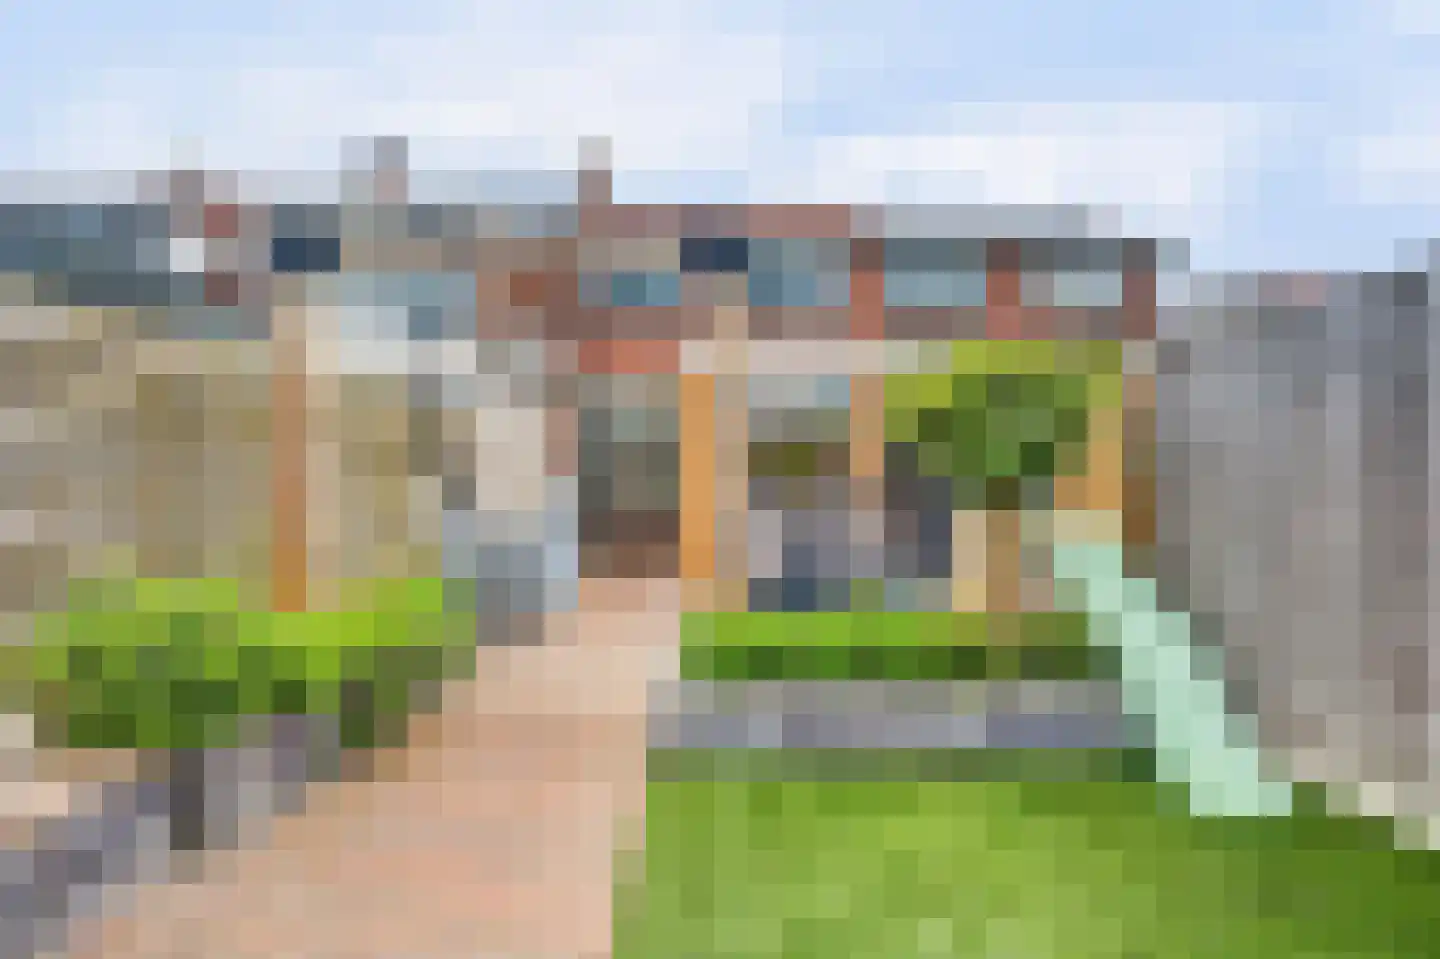
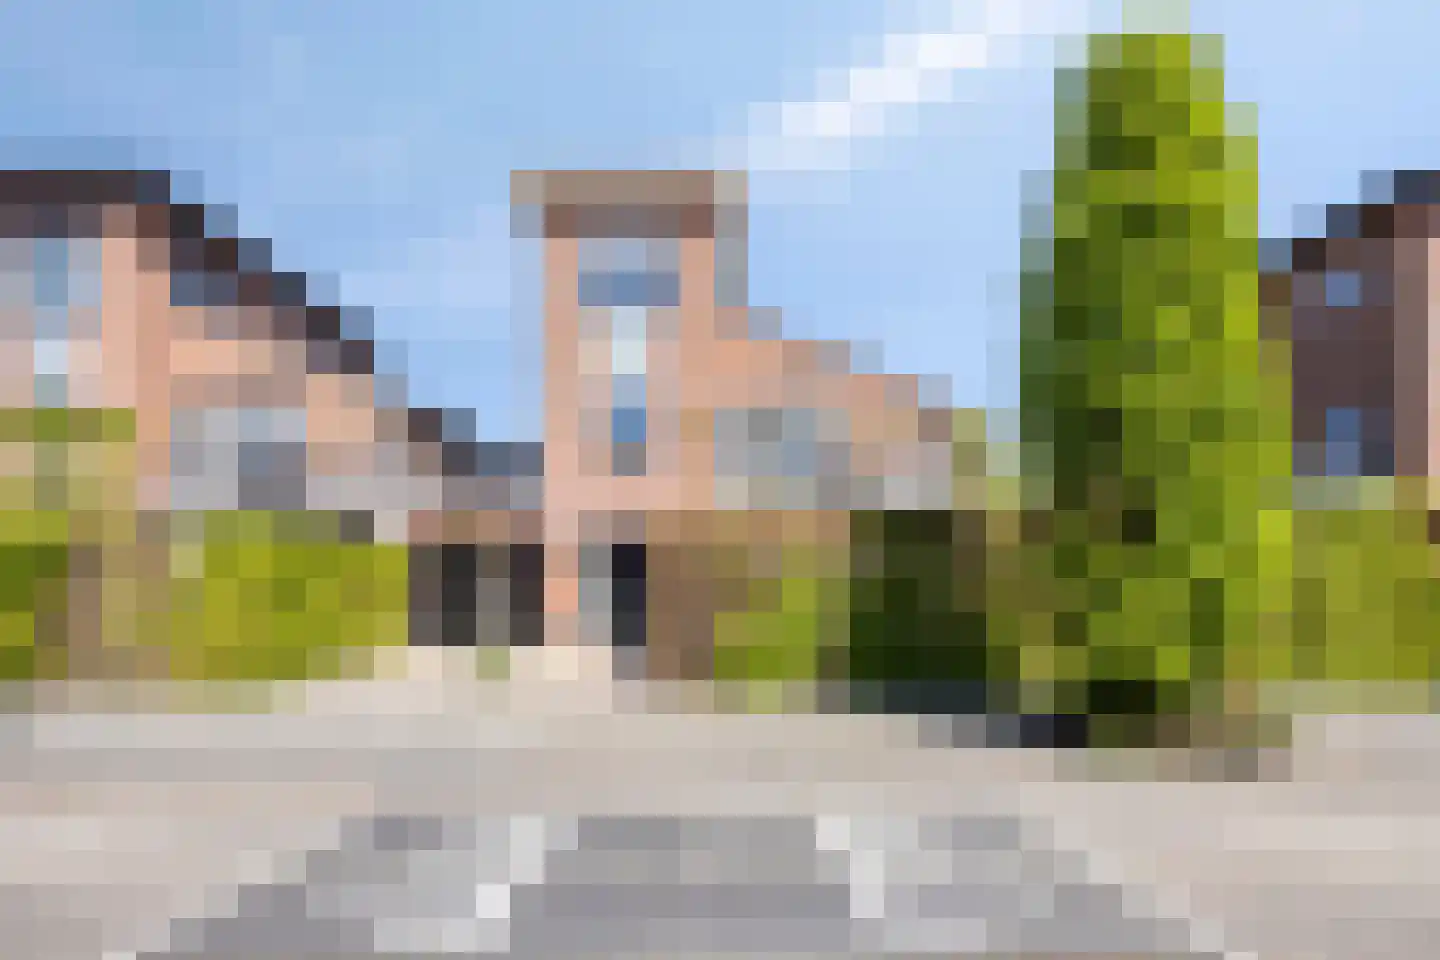
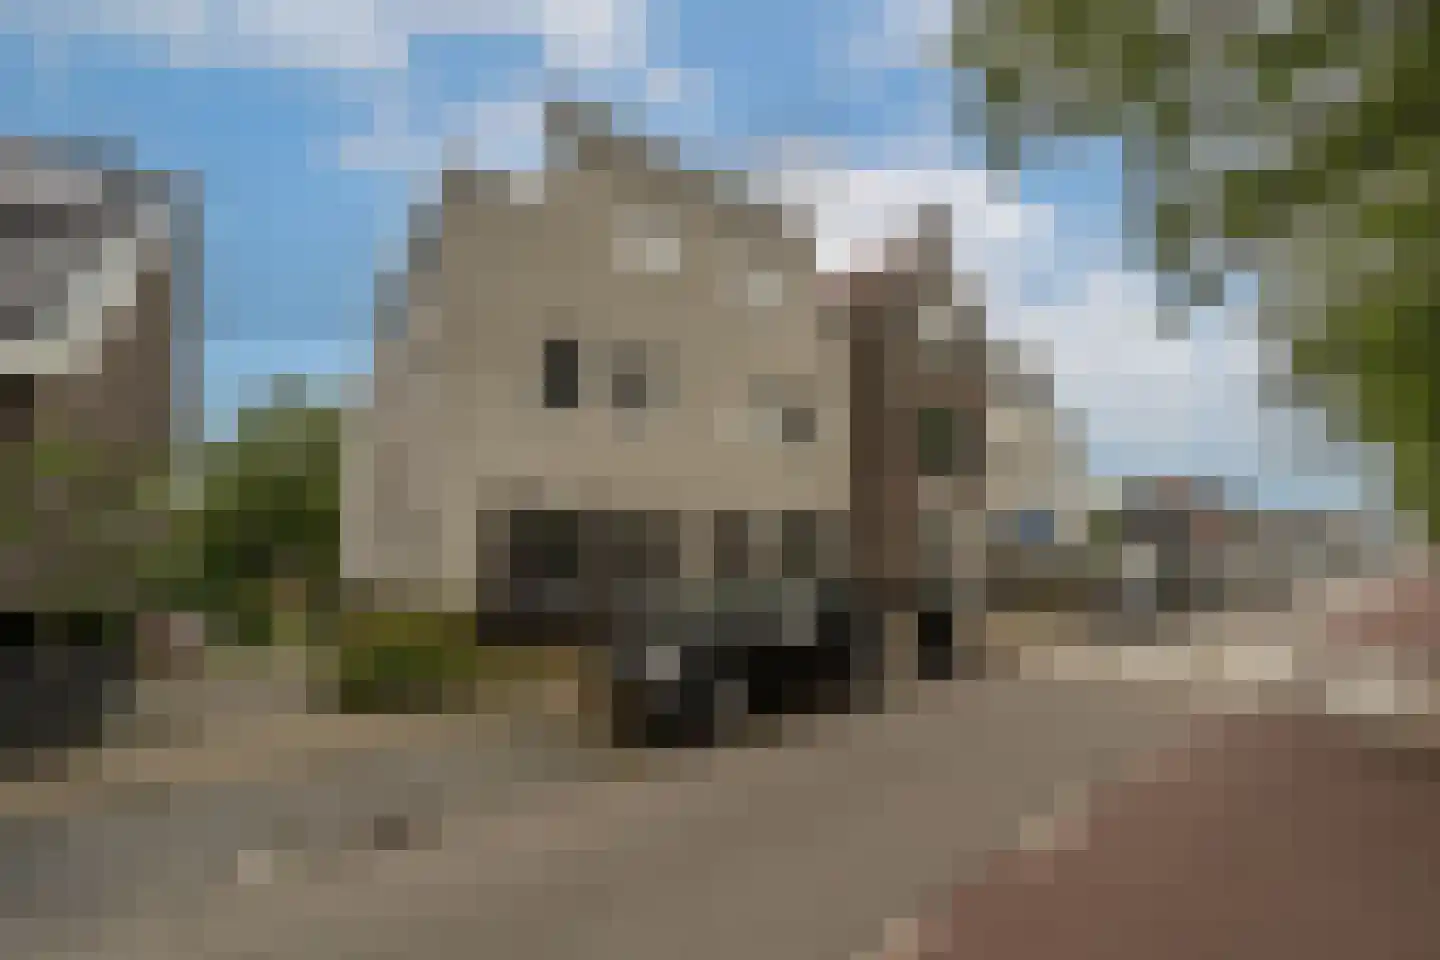
Rudolf Steinerpad 10
3263RM Oud-Beijerland
€ 699.000 k.k.
€ 4.599/m²
B
Save as favorite
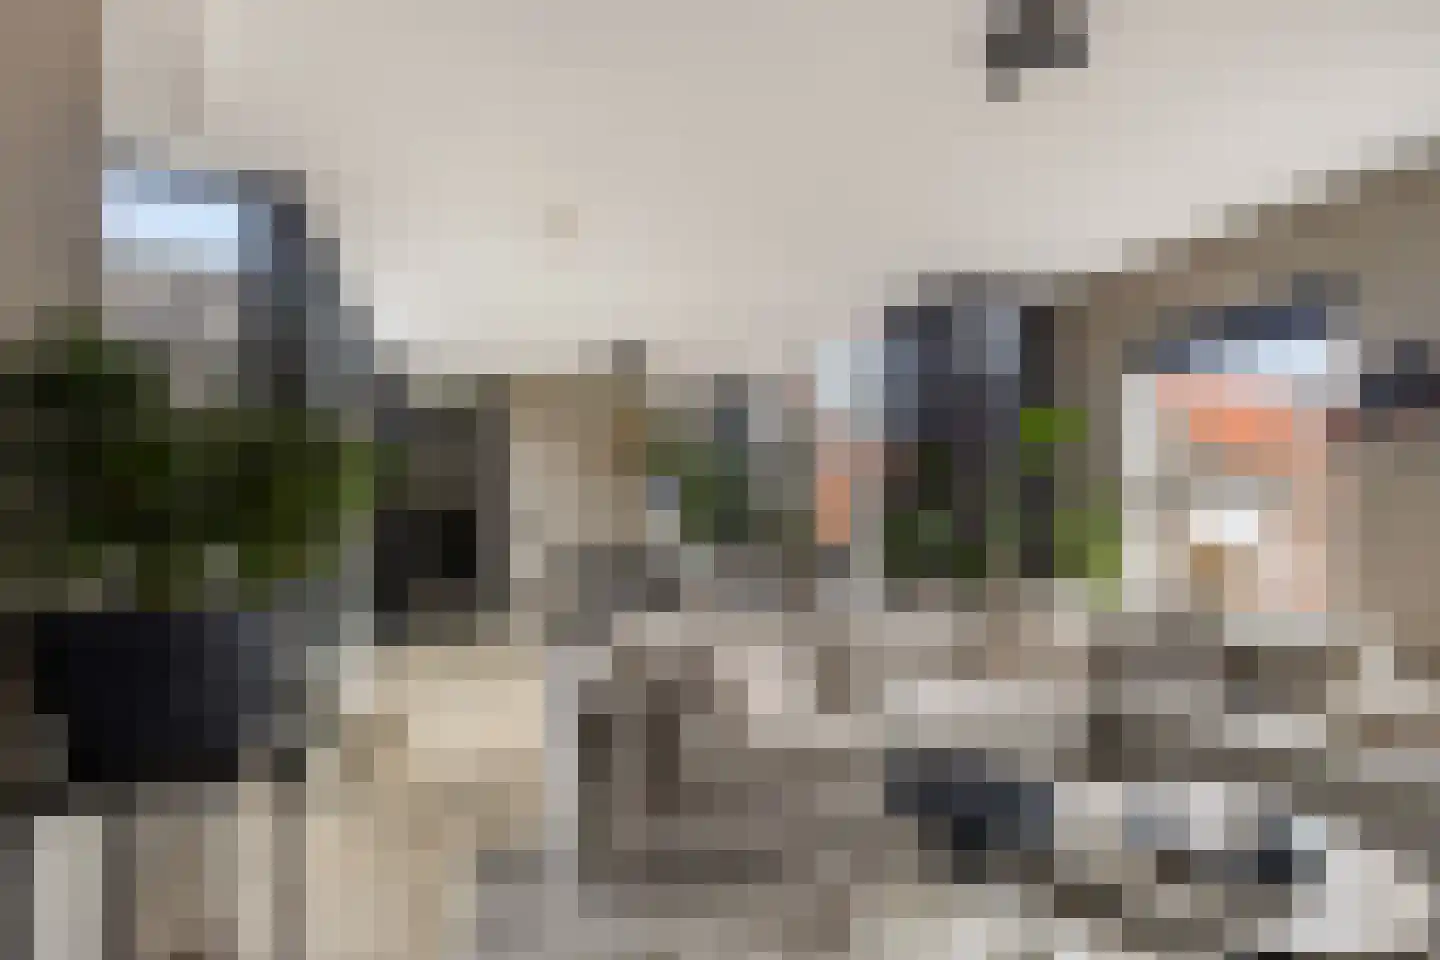
- Living area
- 152 m²
- Land area
- 290 m²
- Bedrooms
- 4