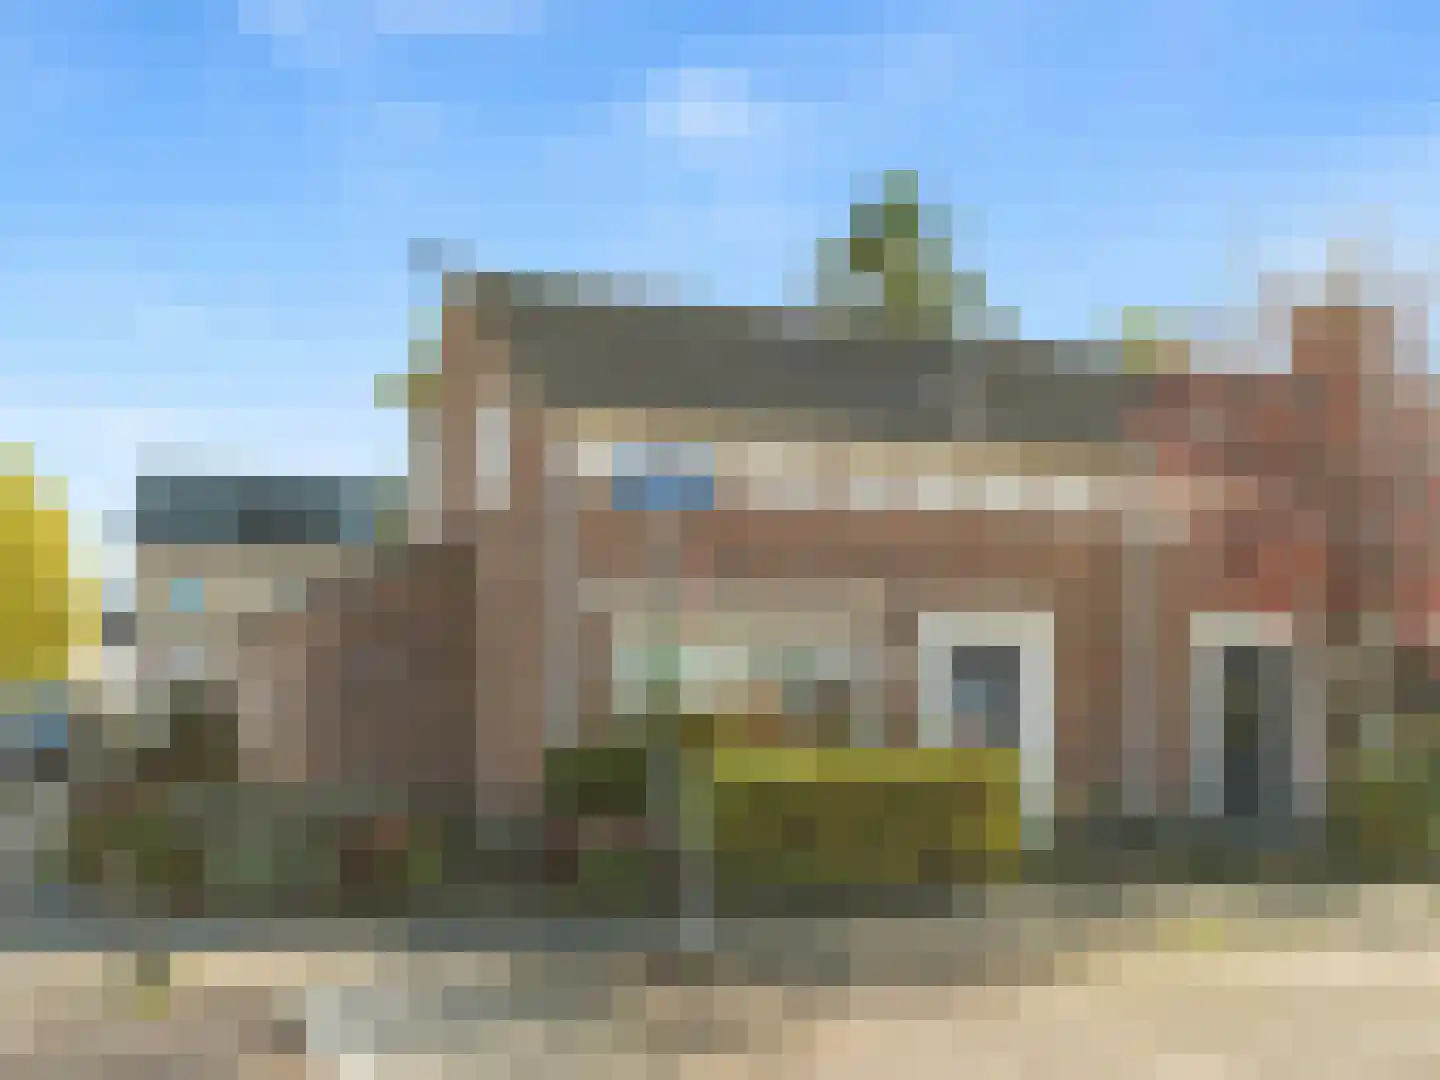
Housing offer in Prinsenbeek

Searching in 143 houses in Prinsenbeek

Connected to: Vastgoed Nederland NVM Makelaars

View the current housing stock in Prinsenbeek and quickly filter by price, living area, rooms and more. There are currently 143 houses in this place within our selection. View also 98 sold houses in Prinsenbeek for extra insight into the local housing market.

Selection

Search and filter homes

Set your preferences and discover homes that suit you.

Total supply 245.299
Filters

Set price, area and other characteristics. Adjust a filter or click on Show homes. Location changes directly above.

Reset filters

You search for

  • Place Prinsenbeek

Selling a home in Prinsenbeek? Compare realtor offers

Get free quotes from real estate agents with local market knowledge. Compare more than 96 real estate agents in Prinsenbeek.

Free request a quote

  • Quotes in Prinsenbeek
  • Non-binding
  • Personal
  • Compare free rates

Selling a home in Prinsenbeek? View the sales-oriented guide sell a house in Prinsenbeek, compare all real estate agents in Prinsenbeek or view the top 10 real estate agents in Prinsenbeek for extra context to your choice.

Compare multiple quotes

Real estate agents make sharper offers when they know you're comparing — ask for quotes for sale or purchase.

Frequently asked questions about homes in Prinsenbeek

Practical answers about housing supply, sales and comparing real estate agents in Prinsenbeek.

Residential and neighborhood statistics in Prinsenbeek

View current location data on residents, WOZ development, housing stock, energy consumption, business activity and safety in Prinsenbeek. In 2025 were there 12.365 residents. The average WOZ value in 2025 is EUR 514.000.

These figures help to better assess and compare the housing stock in Prinsenbeek with recent sold homes. Orient yourself then on suitable top real estate agents in Prinsenbeek for sales advice in this region.

Residents

12.365

Last year: 2025

Average WOZ

EUR 514.000

Last year: 2025

Average income per person.

EUR 39.200

Source: AllNumbers

Crimes (current year)

318

Total registered

Demographics and WOZ development

Inhabitants per year

Inhabitants per year in Prinsenbeek
Year Residents
2021 12.140
2022 12.250
2023 12.330
2024 12.335
2025 12.365

Annual WOZ value

WOZ value per year in Prinsenbeek
Year Average WOZ
2021 EUR 395.000
2022 EUR 419.000
2023 EUR 468.000
2024 EUR 484.000
2025 EUR 514.000

Composition of residents

Age build-up

65+: 2.915 0-15: 1.945 15-25: 1.415 25-45: 2.560 45-65: 3.530

Education level

Hoger

3.520

Praktisch

1.680

Middelbaar

3.650

Origin of residents (2025)

Europa

625

Nederland

10.860

Buiten Europa

880

Housing stock and construction periods

Types of homes

Hoekwoningen 1.000
Appartementen 584
Tussenwoningen 1.774
Vrijstaande woningen 1.223
Twee-onder-één-kap woningen 708

Construction period of buildings

Voor 1700 1
1700 tot 1900 42
1900 tot 1925 91
1925 tot 1950 180
1950 tot 1970 1.682
1970 tot 1980 969
1980 tot 1990 671
1990 tot 2000 649
2000 tot 2010 323
2010 tot 2020 378
2020 en later 80

Energy and sustainability

Energy label distribution

Label C

1.461

Label A

1.189

Label B

1.026

Label D

763

Label F

287

Label E

247

Label G

201

Label A+++

82

Label A+

49

Label A++++

32

Label A++

22

Label A+++++

0

Average energy consumption per year

Average energy consumption per year in Prinsenbeek
Year Gas (m3) Electricity (kWh)
2020 1.370 3.350
2021 1.540 3.400
2022 1.180 3.180
2023 1.000 3.010
2024 980 3.100

Consumption per house type

Hoekwoning

Gas: 960 • Electricity: 2.790

Huurwoning

Gas: 720 • Electricity: 2.080

Koopwoning

Gas: 1.070 • Electricity: 3.250

Appartement

Gas: 490 • Electricity: 2.070

Tussenwoning

Gas: 880 • Electricity: 2.590

Vrijstaande woning

Gas: 1.410 • Electricity: 4.230

Twee-onder-één-kap woning

Gas: 1.080 • Electricity: 3.020

Business activity in Prinsenbeek (2025)

Handel en HORECA 220
Nijverheid en energie 175
Zakelijke dienstverlening 455
Overheid, onderwijs en zorg 285
Landbouw, bosbouw en visserij 55
Vervoer, informatie en communicatie 105
Financiele diensten en onroerendgoed 105
Cultuur, recreatie en overige diensten 170

Total number of company establishments: 1.575

Recent crime statistics

Recent crime statistics in Prinsenbeek
Period Crimes
jan 2026 10
jul 2025 25
jun 2025 37
mei 2025 38
mrt 2025 24
mrt 2026 22
nov 2024 19
nov 2025 22
okt 2024 18
okt 2025 16
sep 2024 24
sep 2025 28

These figures give an indicative picture of safety trends in the living environment of Prinsenbeek.

Frequently asked questions about living in Prinsenbeek

Short answers based on current local statistics, handy for a quick comparison of the living environment.

Hoeveel inwoners heeft Prinsenbeek?

Prinsenbeek telt in 2025 ongeveer 12.365 inwoners.

Wat is de gemiddelde WOZ-waarde in Prinsenbeek?

De gemiddelde WOZ-waarde in Prinsenbeek is in 2025 circa € 514.000.

Wat is het gemiddelde inkomen per inwoner in Prinsenbeek?

Het gemiddelde inkomen per inwoner in Prinsenbeek ligt rond € 39.200 per jaar.

Hoe veilig is wonen in Prinsenbeek?

Voor het huidige jaar gaat het om ongeveer 318 geregistreerde misdrijven. Gebruik deze cijfers als indicatie en vergelijk trends per periode.

Welke woningtypen komen het meest voor in Prinsenbeek?

In Prinsenbeek komt vooral "Tussenwoningen" veel voor, met ongeveer 1.774 woningen.

Receive free, non-binding quotes

Compare multiple real estate agents and choose the best match.