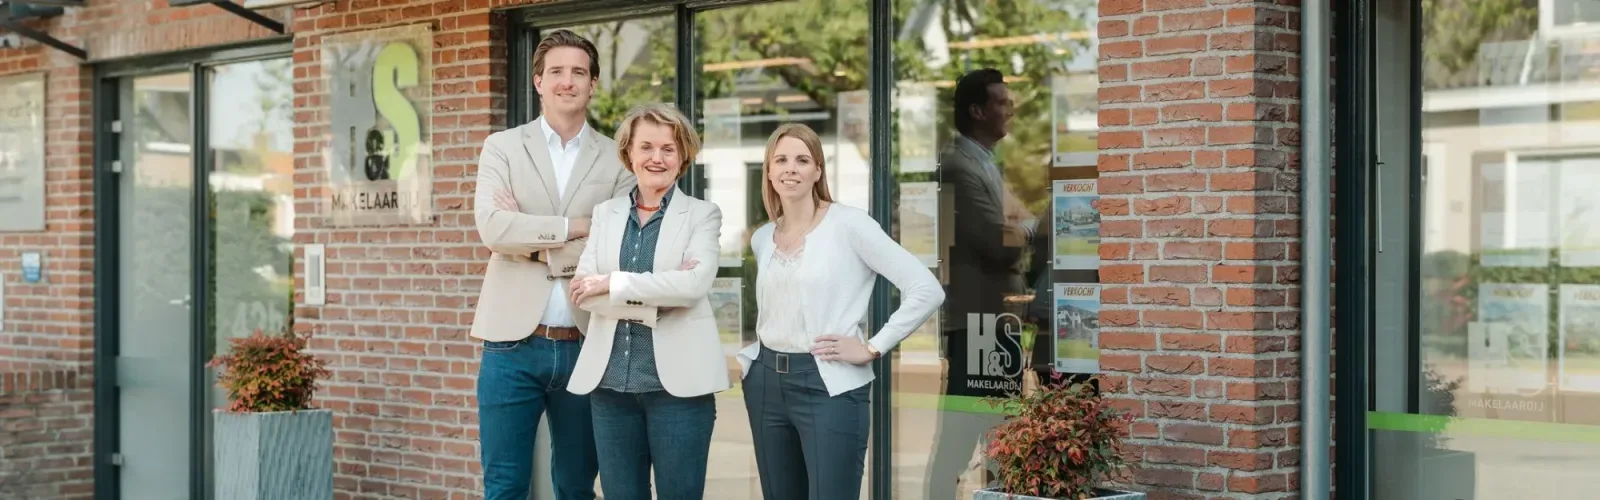
Van de Wiel Makelaars staat voor 20 jaar ervaring als betrouwbare partner in Prinsenbeek. Wij combineren persoonlijke aandacht met professionele expertise om jou te ontzorgen van woonstress. Of je op zoek bent naar een nieuw thuis of hulp bij de verkoop, wij staan voor je klaar met transparante en directe dienstverlening. Onze werkwijze is gebaseerd op betrokkenheid en open communicatie. Wij adviseren je met kennis van zaken, zonder jar...
Current housing stock
-

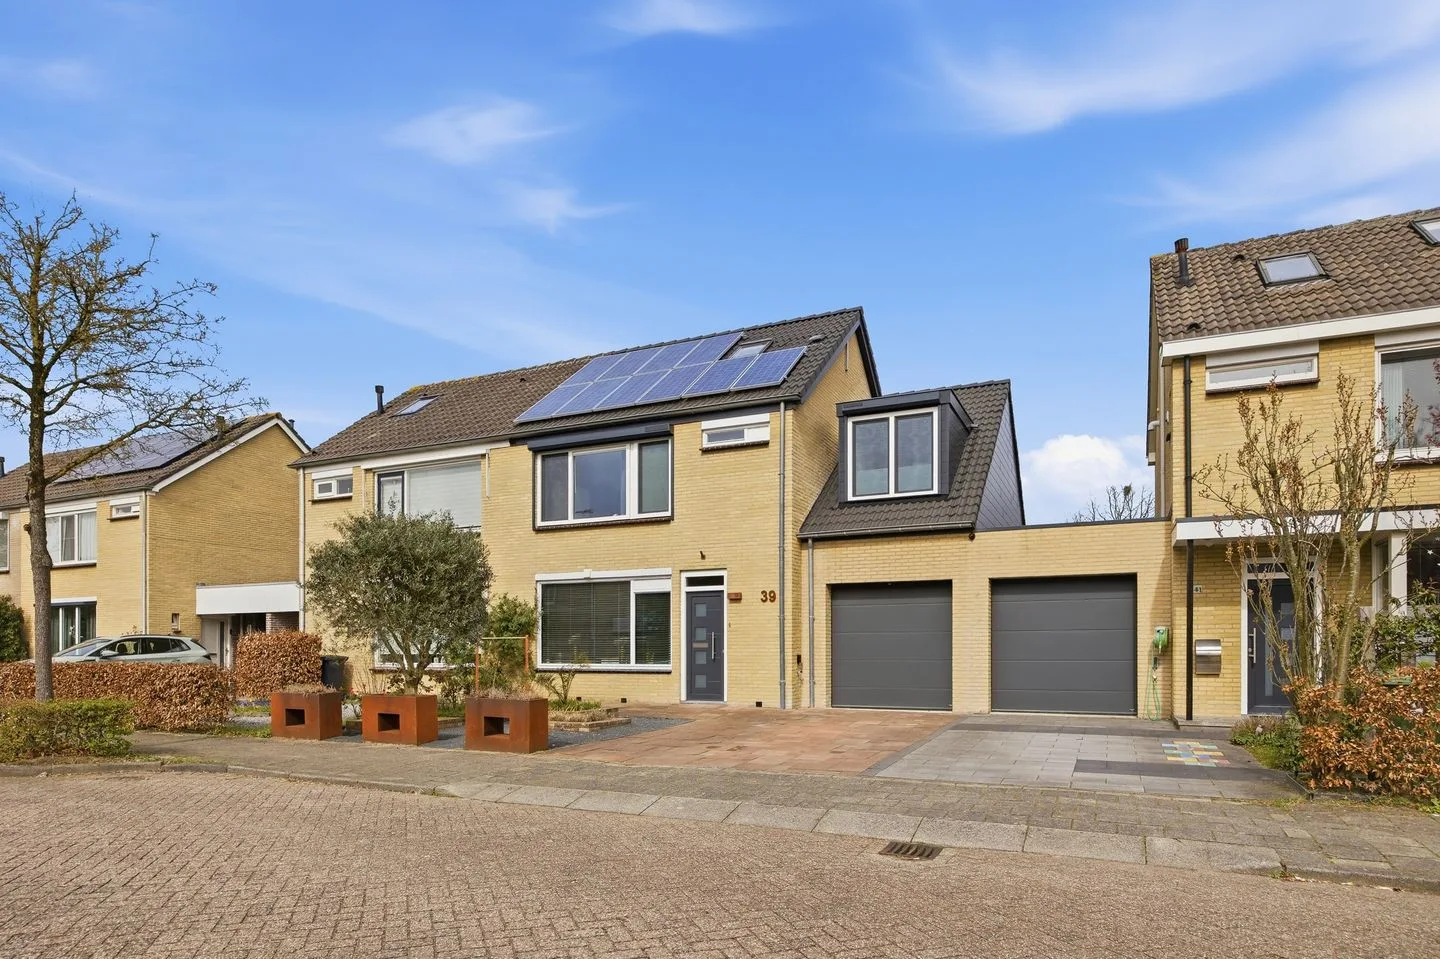
- Available
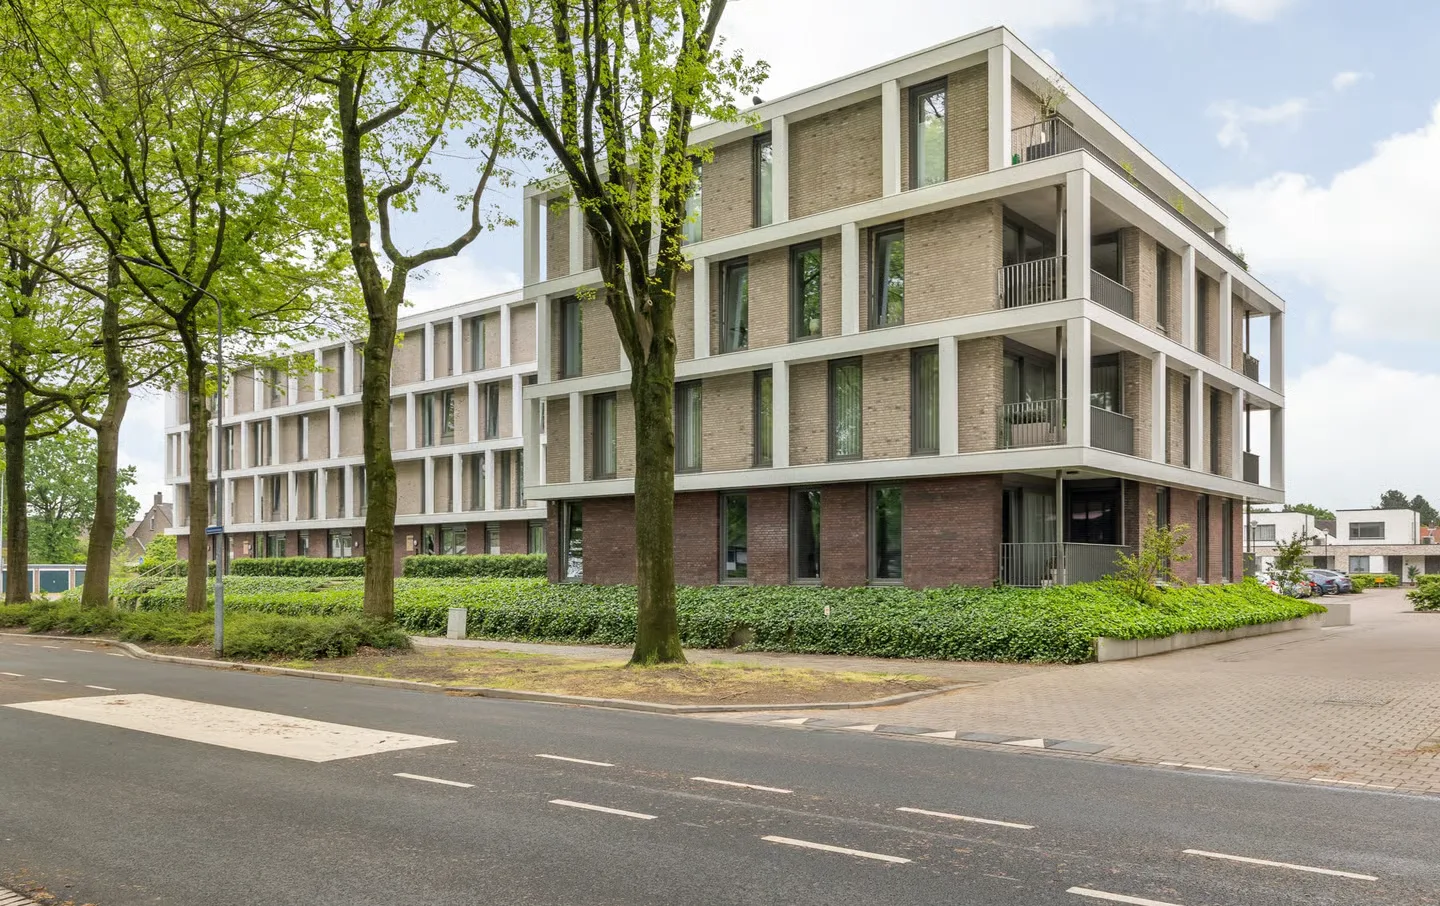
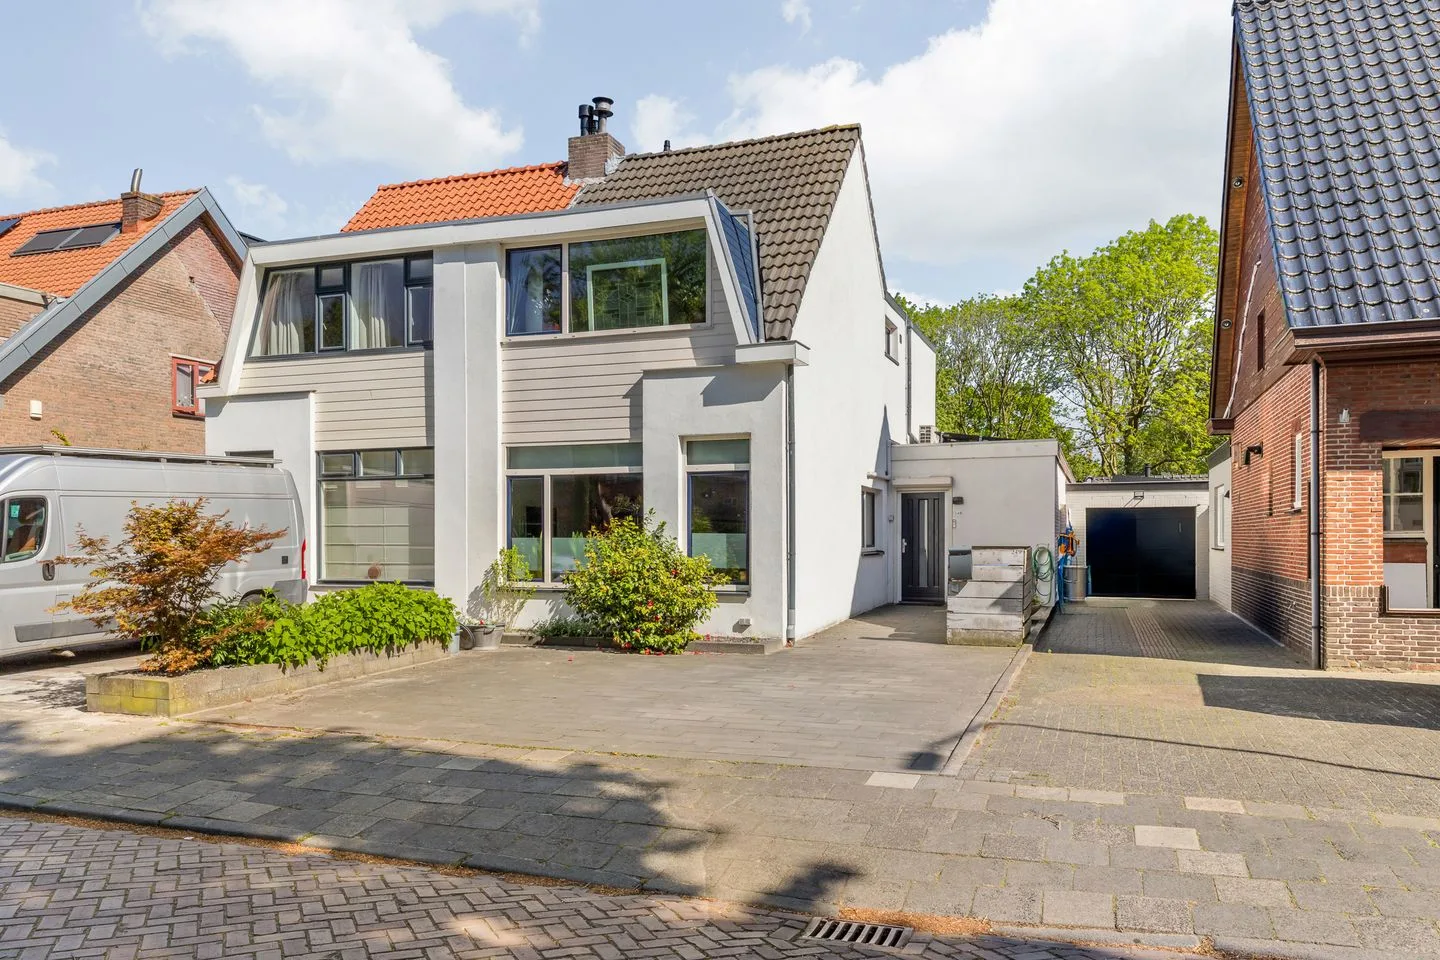
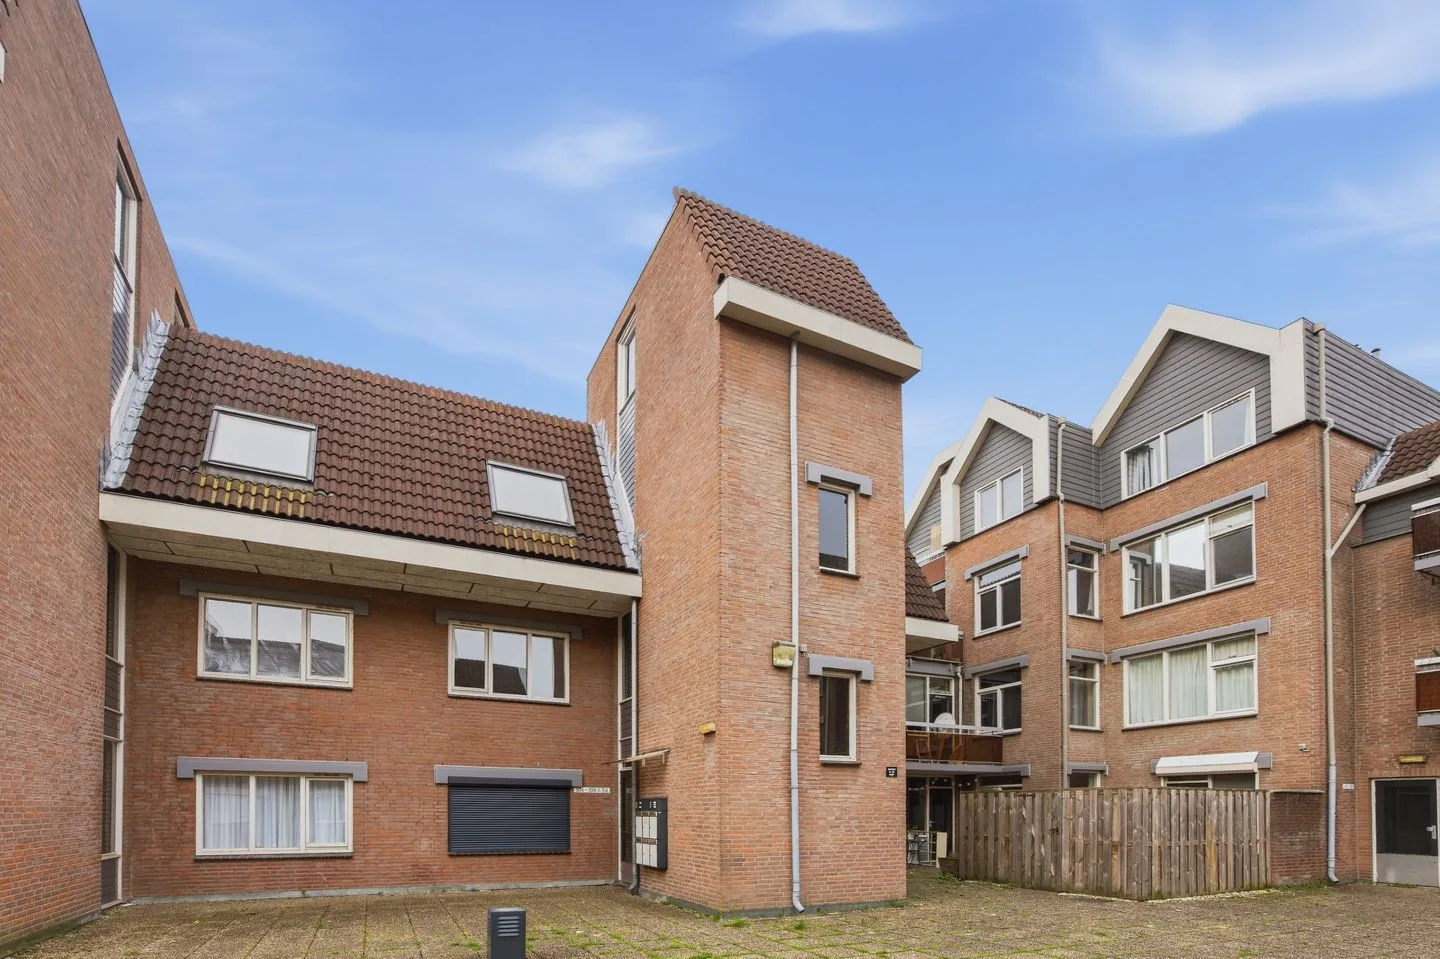
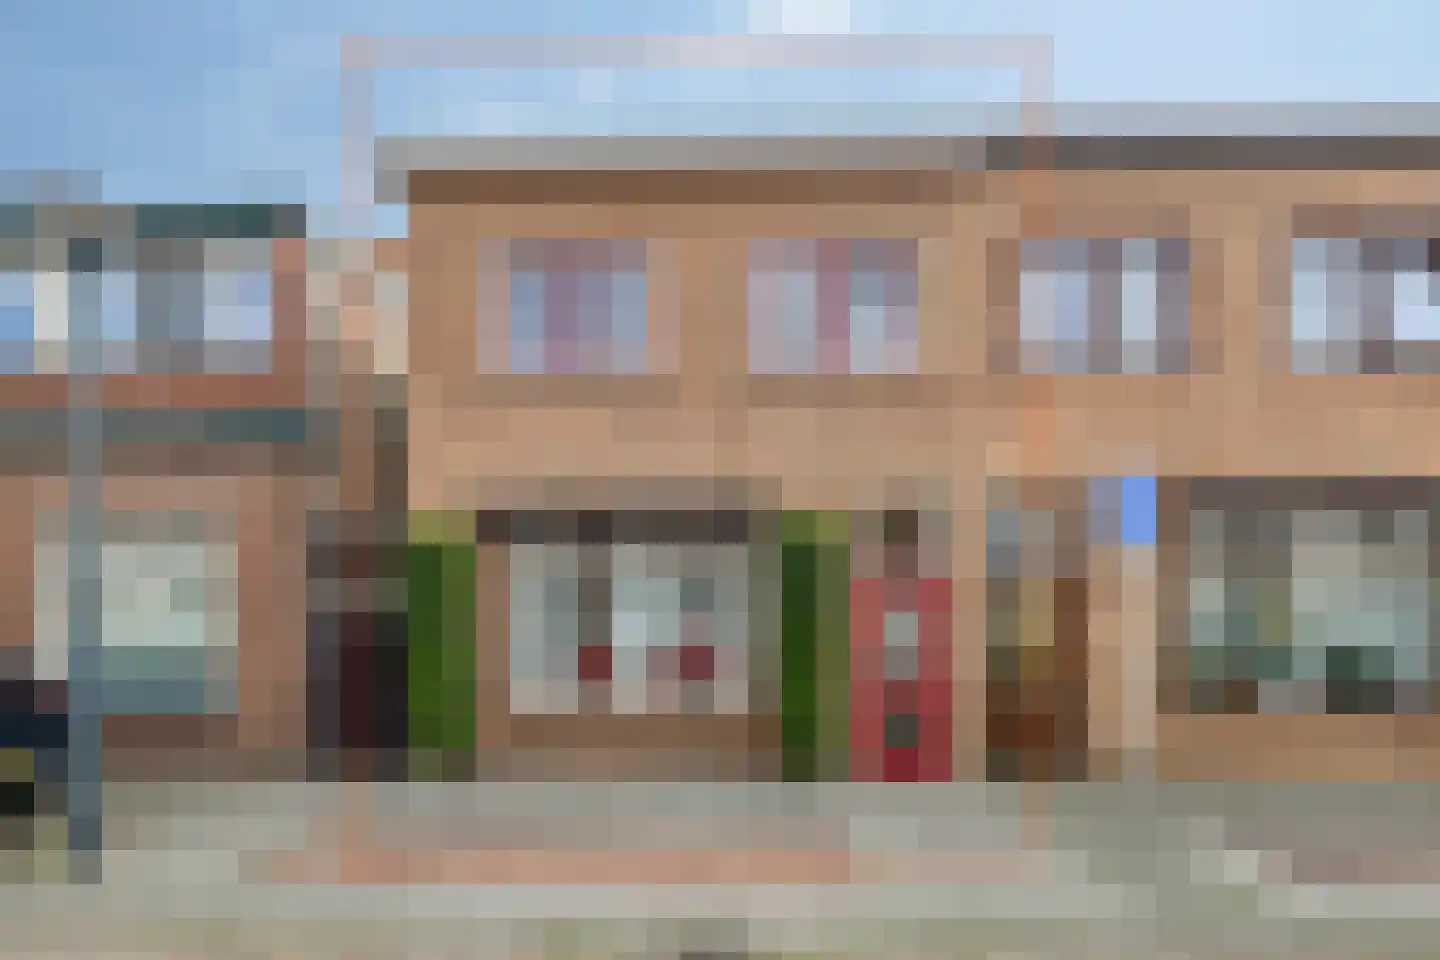
Luttelhof 11
4841RS Prinsenbeek
€ 689.000 k.k.
€ 7.742/m²
ASave as favorite- Living area
- 89 m²
- Land area
- 180 m²
- Bedrooms
- 2
-

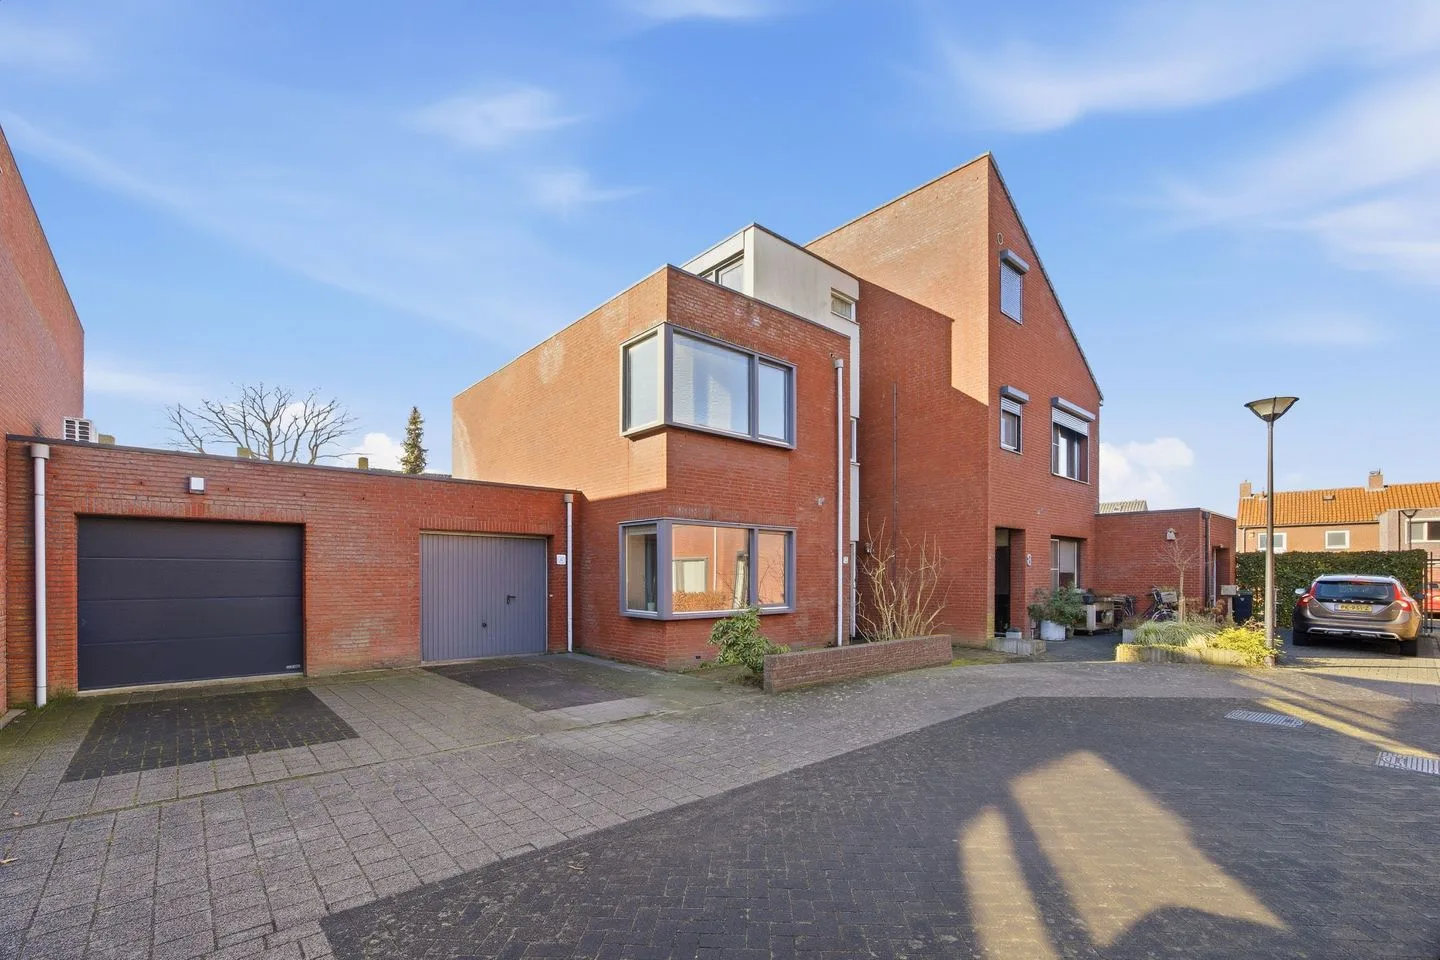
- Available
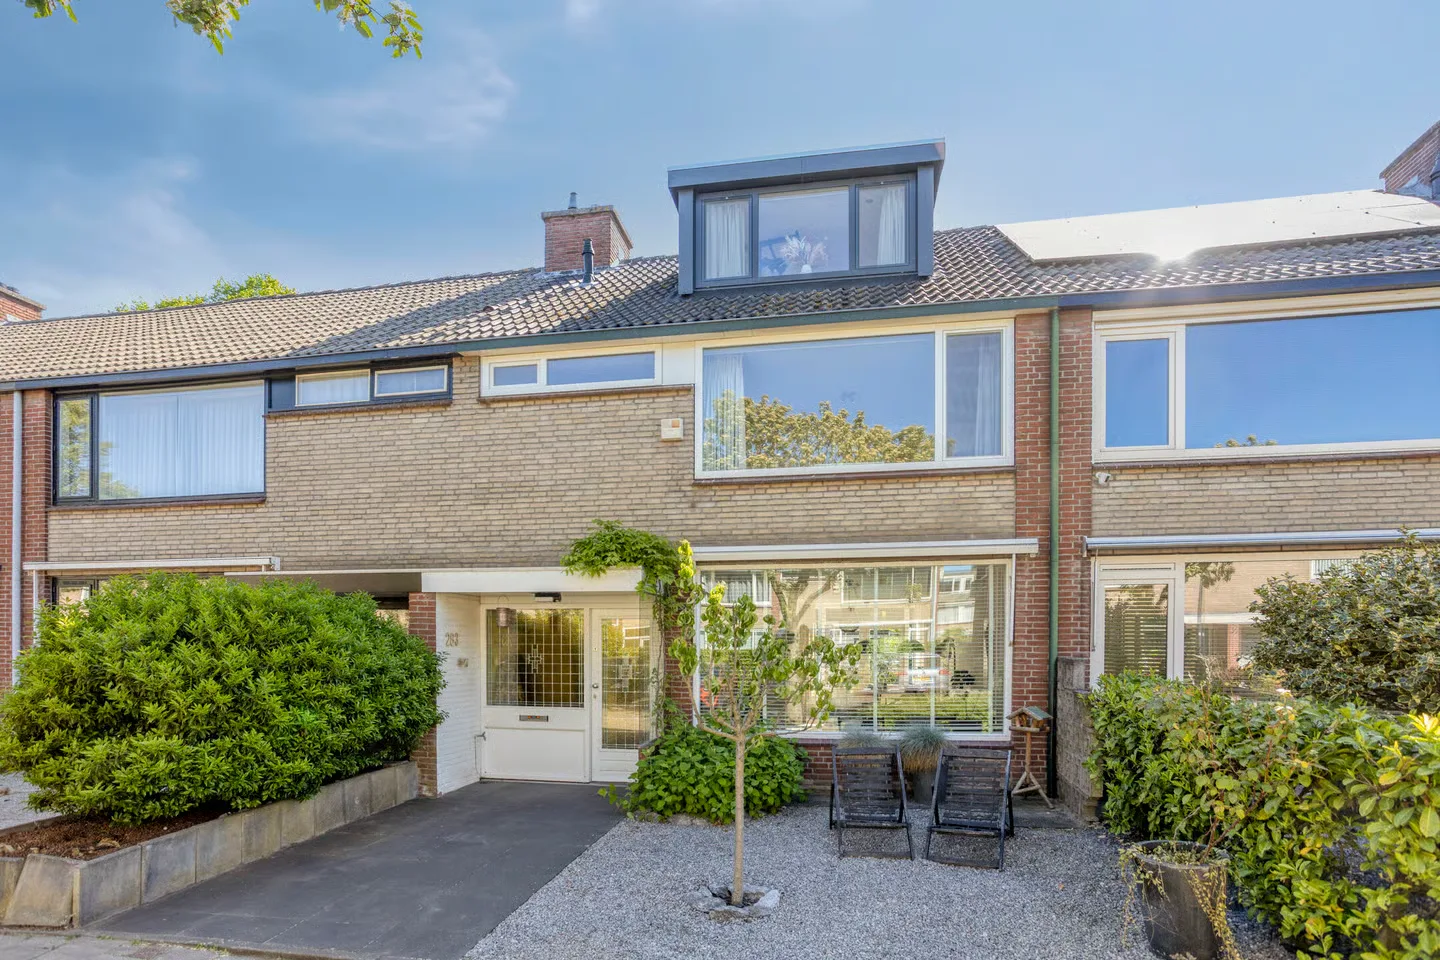
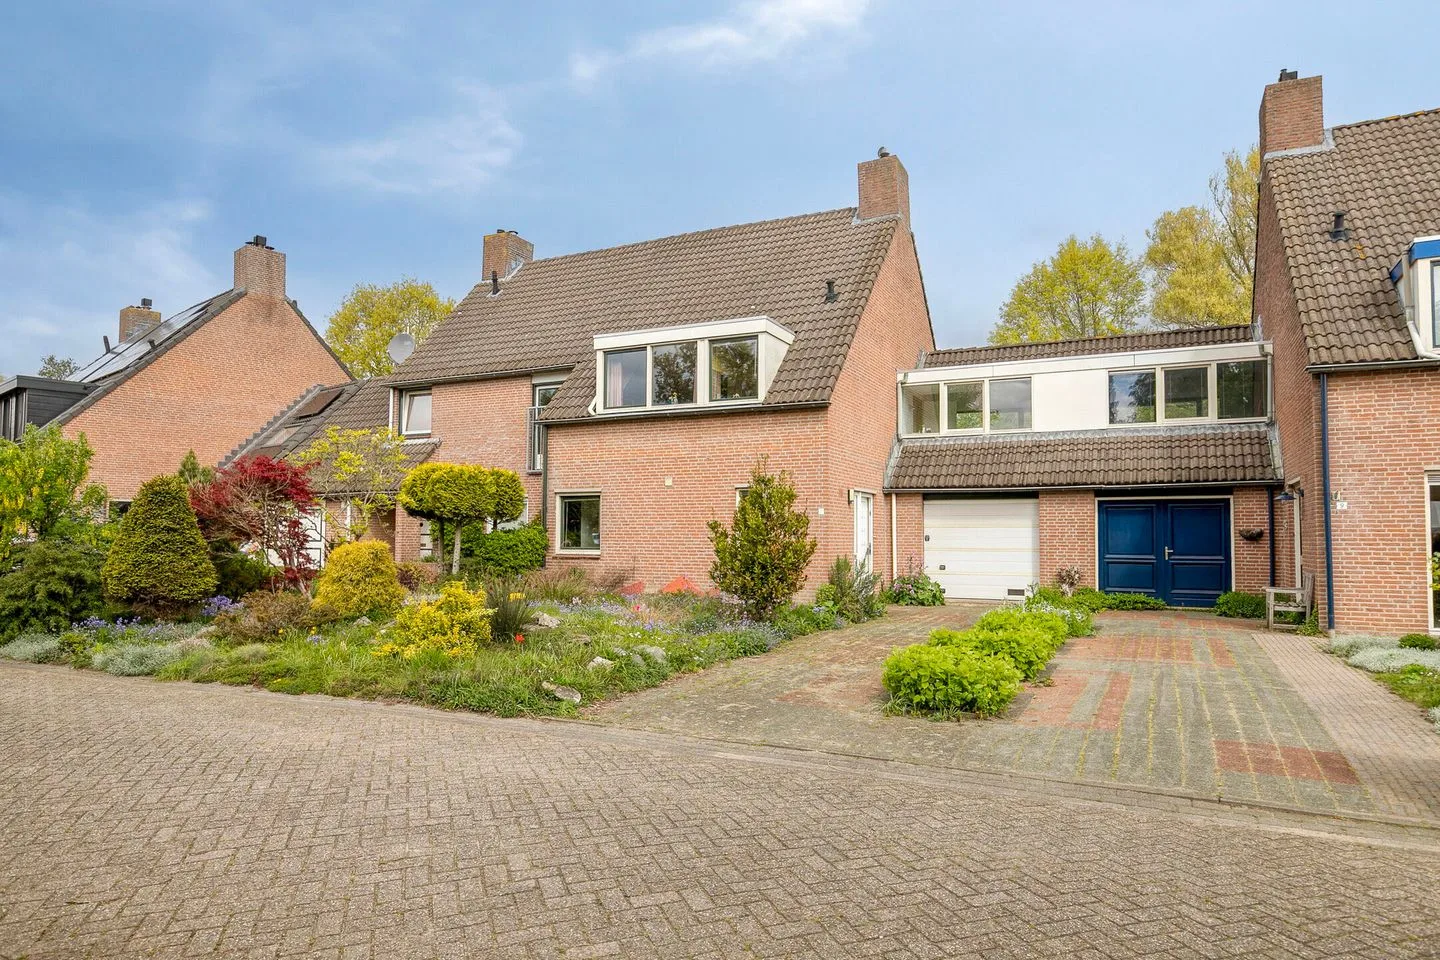
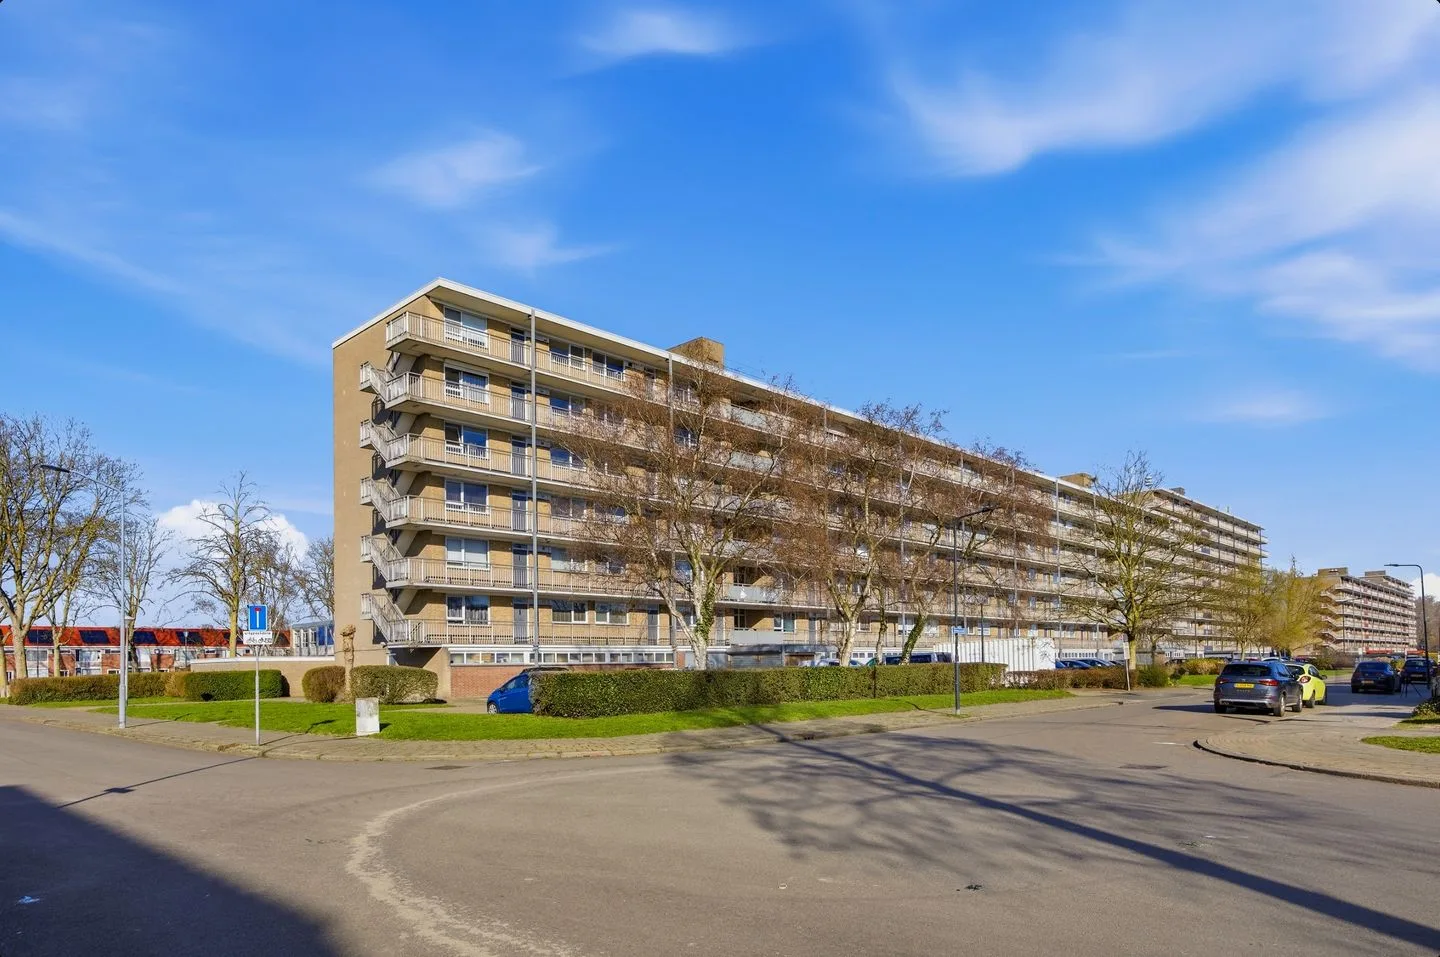
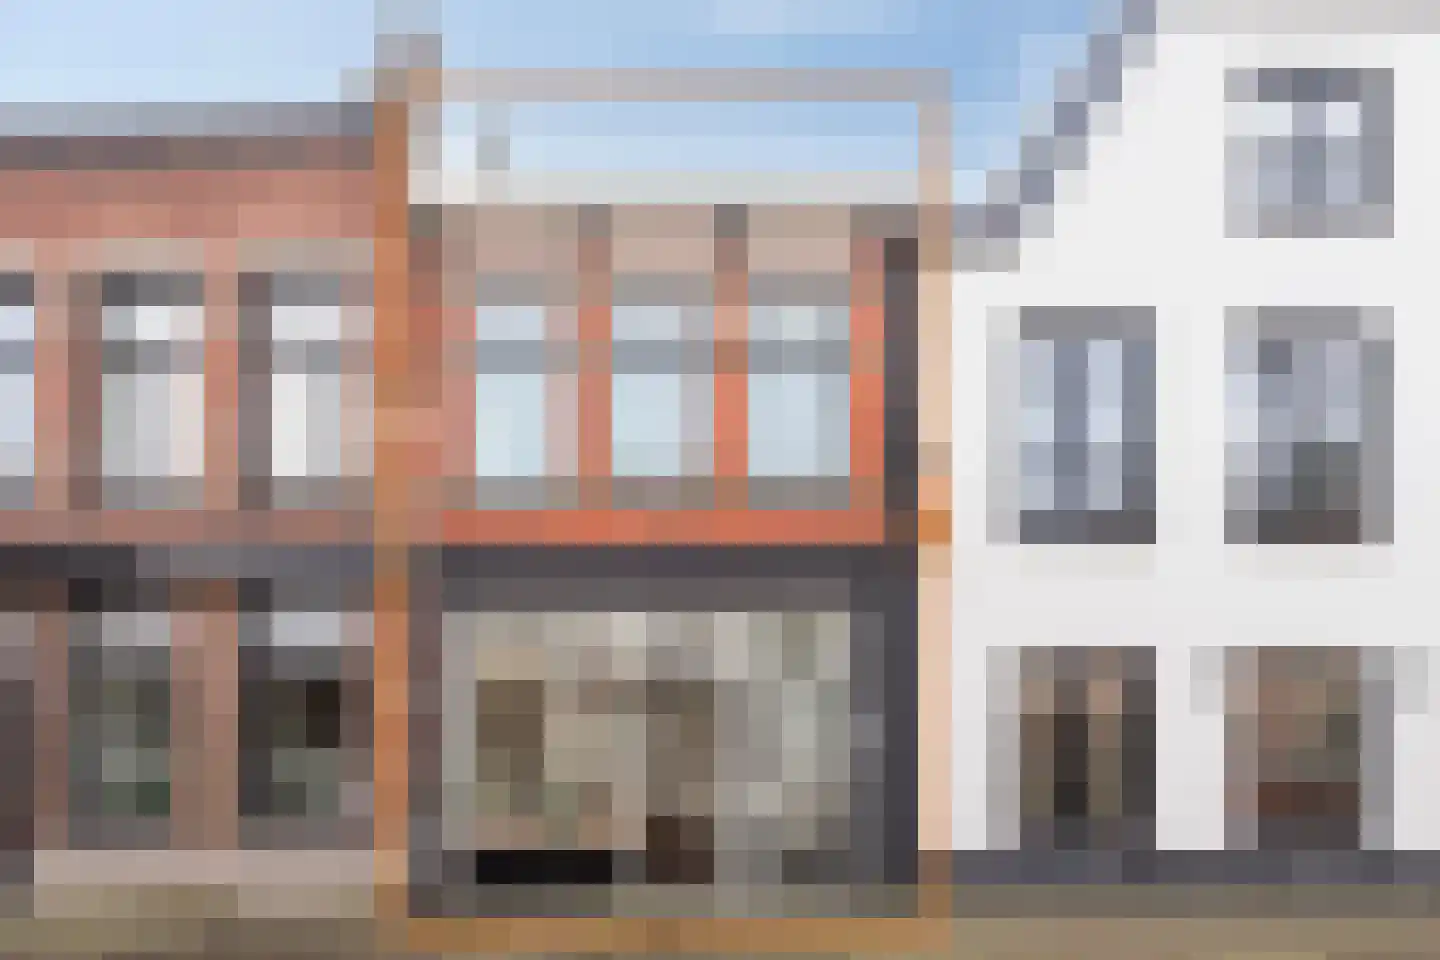
Molenstraat 114
4841CG Prinsenbeek
€ 745.000 k.k.
DSave as favorite- Living area
- 163 m²
- Land area
- 360 m²
- Bedrooms
- 3
-

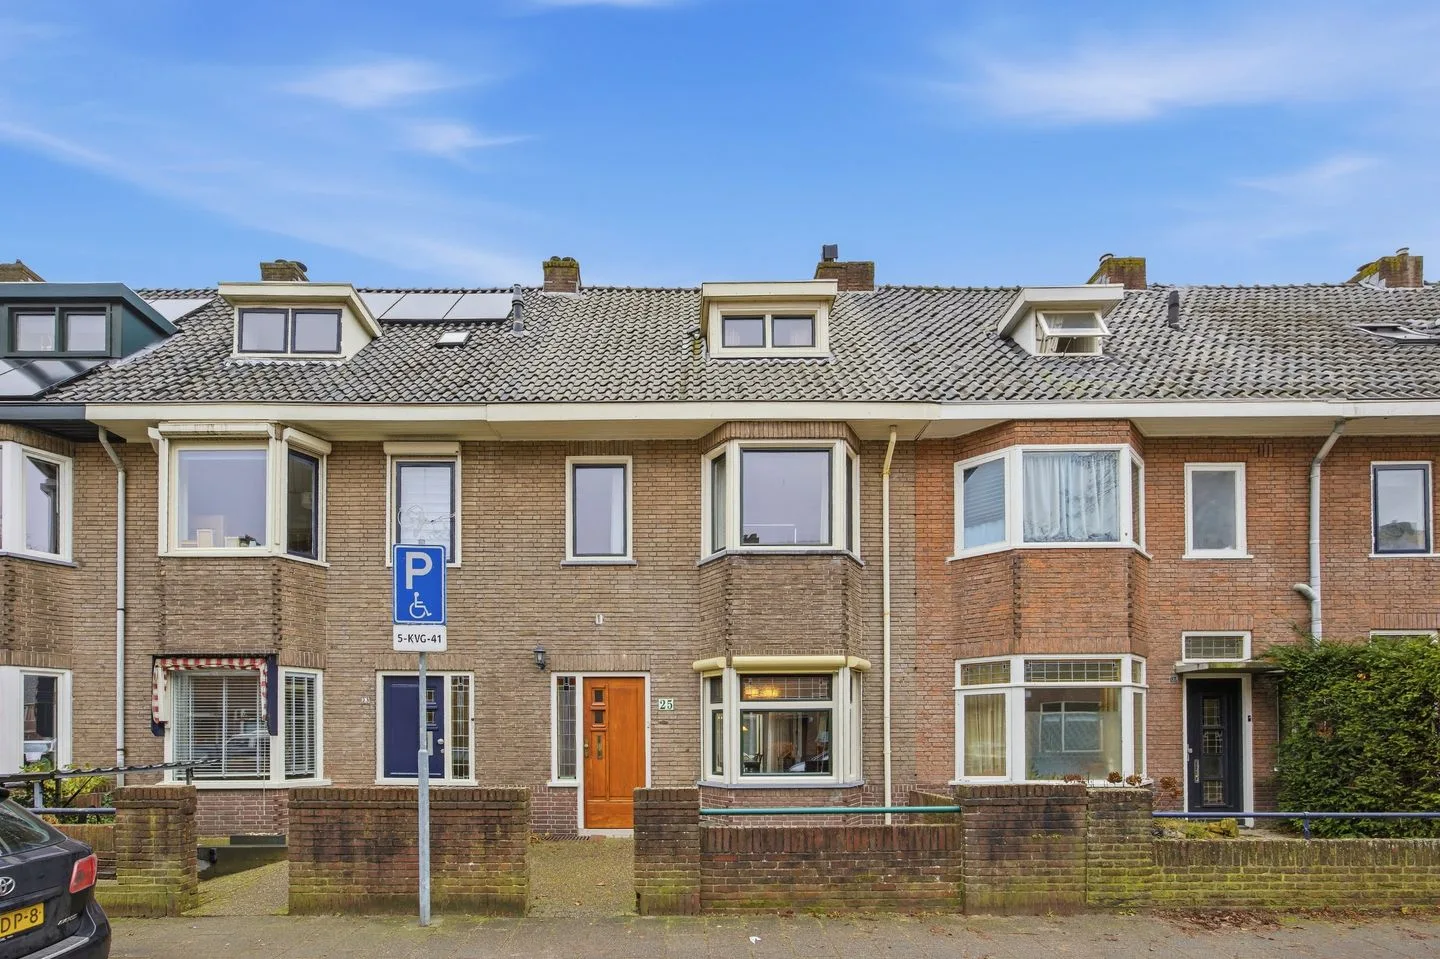
- Available
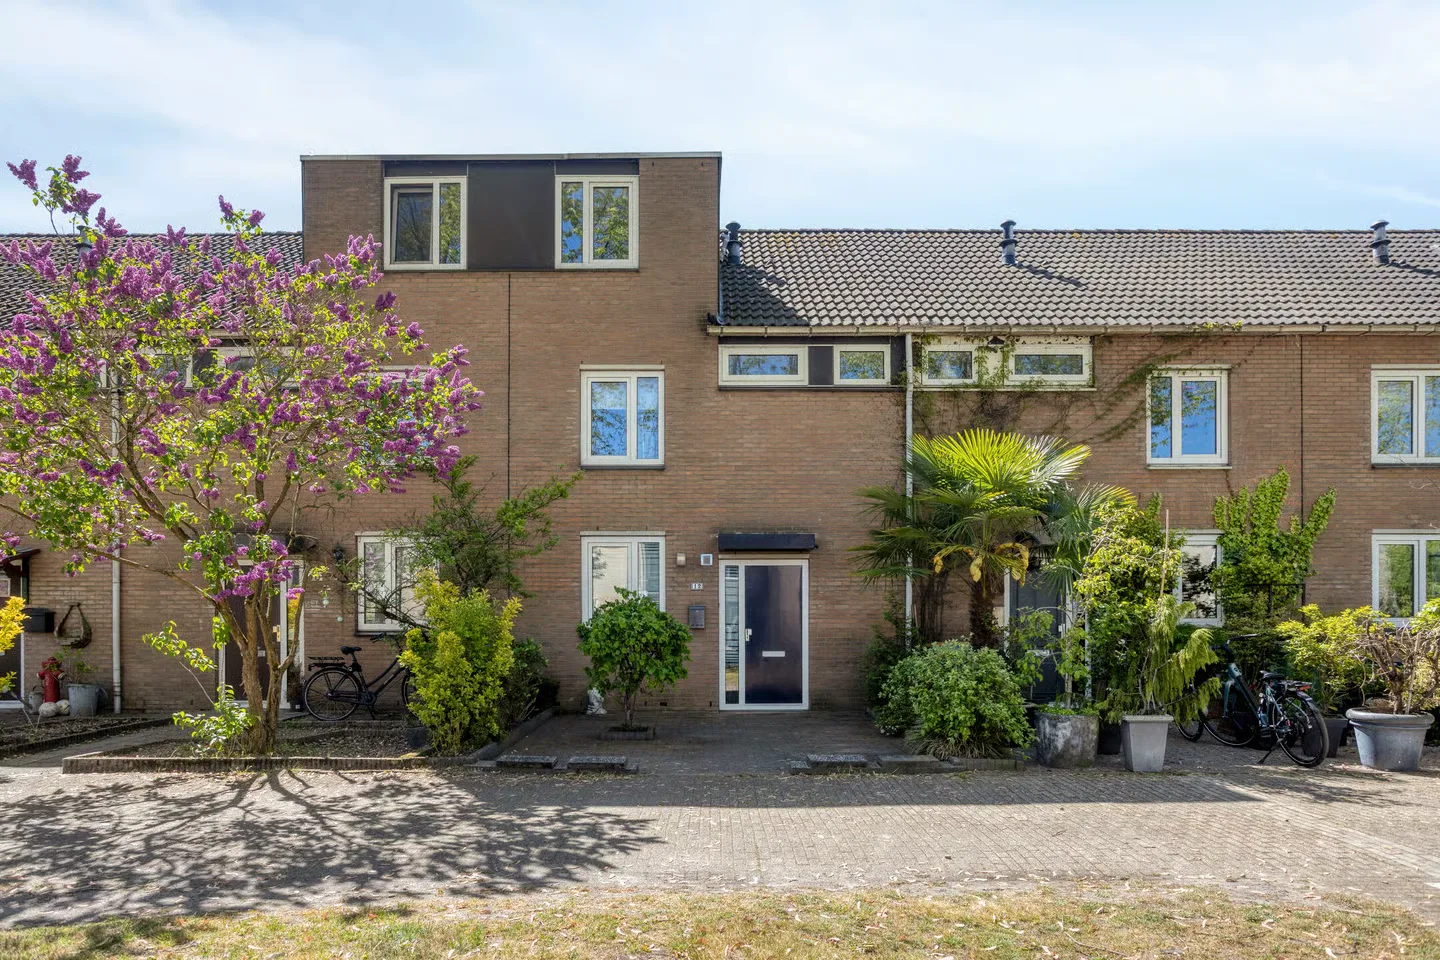
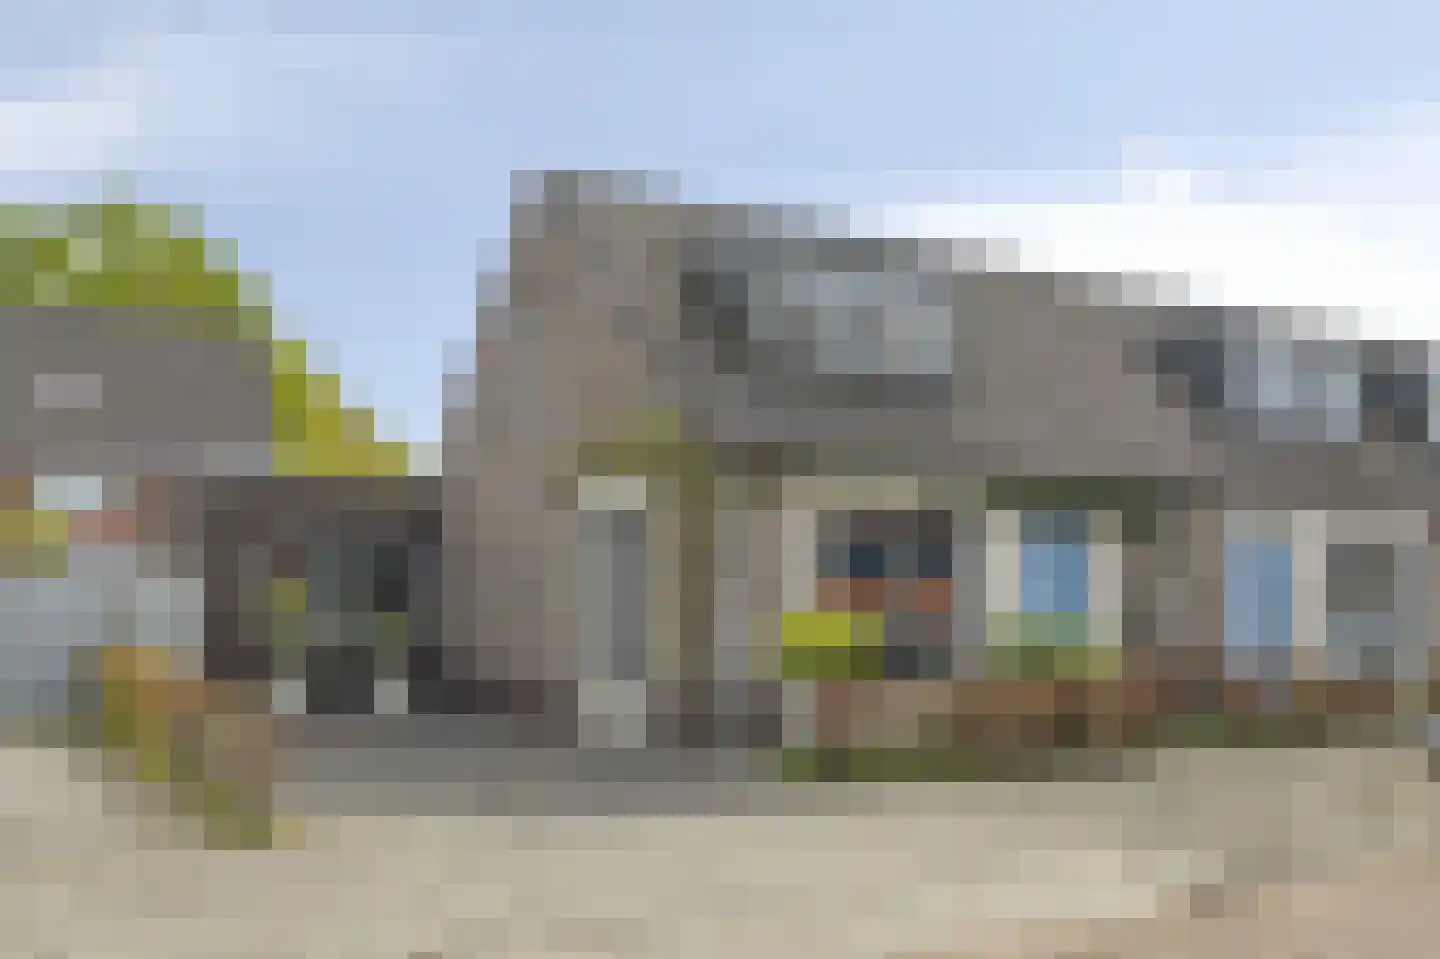
Blokmoeren 34
4824JP Breda
€ 650.000 k.k.
ASave as favorite- Living area
- 106 m²
- Land area
- 578 m²
- Bedrooms
- 3
-

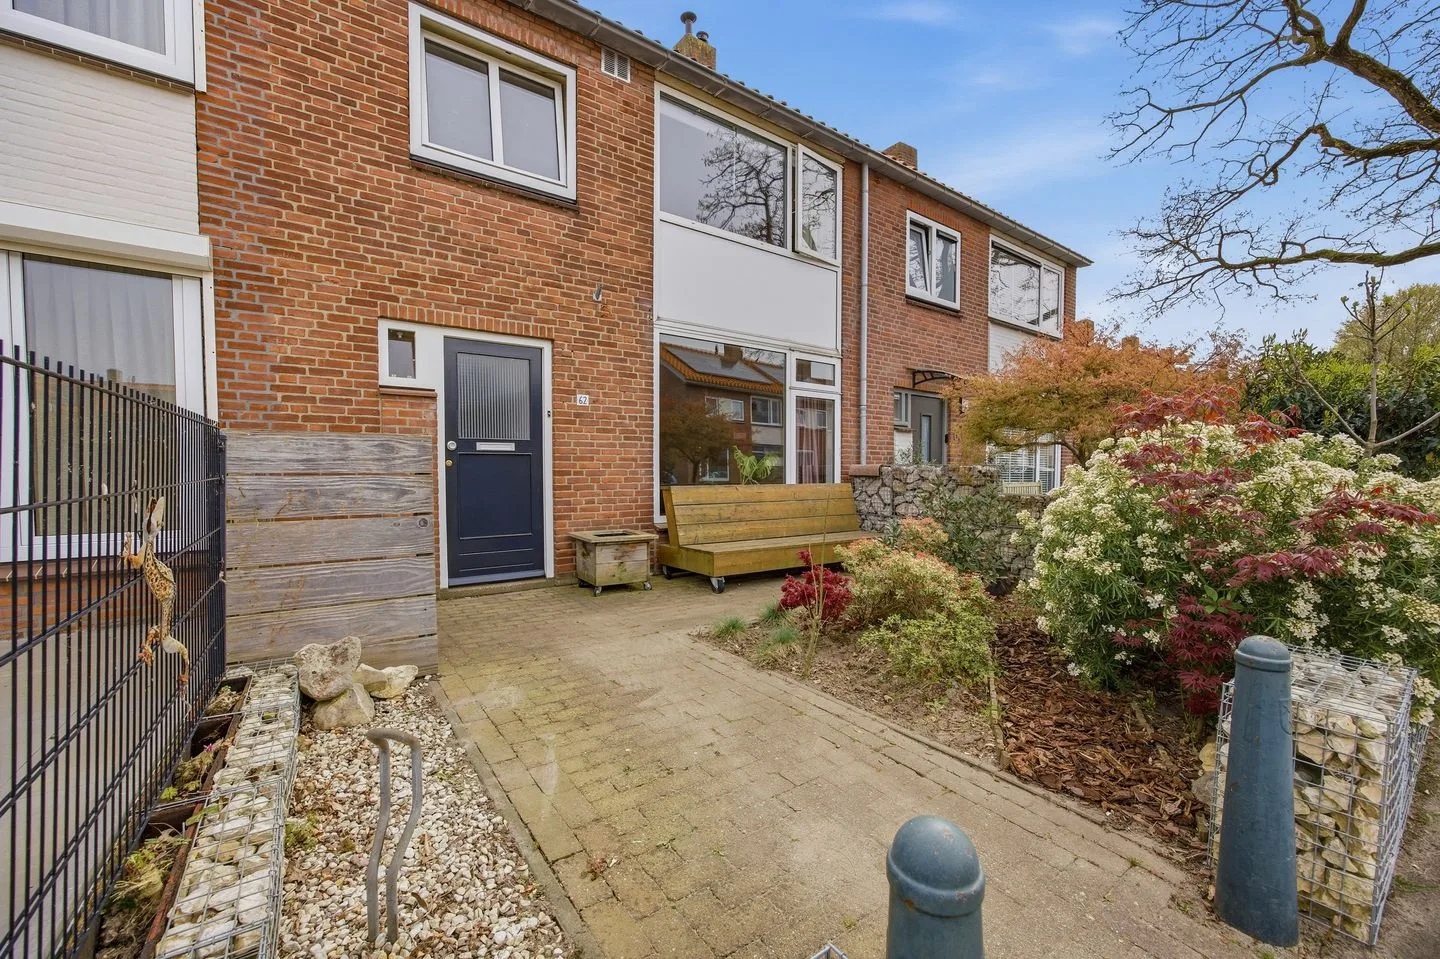
- Available
Beekhof 6
4841MB Prinsenbeek
€ 739.000 k.k.
ASave as favorite- Living area
- 128 m²
- Land area
- 231 m²
- Bedrooms
- 3
-
- Available
Kriekenstraat 16
4847HE Teteringen
€ 659.000 k.k.
€ 5.538/m²
ASave as favorite- Living area
- 119 m²
- Land area
- 248 m²
- Bedrooms
- 2
-

- Available
Valdijk 8 B
4841AG Prinsenbeek
€ 469.000 k.k.
€ 5.391/m²
BSave as favorite- Living area
- 87 m²
- Land area
- —
- Bedrooms
- 2
Reviews (103)
Review platforms
BronscoresTotal score
103 total reviews

Funda
58 reviews on Funda

45 reviews on Google
-
Groenstraat 47
10Van de Wiel blijft een zeer fijne makelaar waarmee het contact goed is, je snel antwoord krijgt bij vragen en ze denken goed mee. Als koper enkele jaren geleden en als verkoper recent ben ik zeer tevreden. Toen de verkoop wat stroef ging, handelden ze snel
-
Adriaan van Bergenstraat 338
10Het contact met de makelaar verliep super. Via een app die daarvoor aangemaakt werd, werden we op de hoogte gehouden over alle ontwikkelingen omtrent de verkoop.
-
de Savornin Lohmanstraat 44
10De samenwerking gedurende het hele verkoopproces verliep erg prettig. Bij vragen krijg je goed antwoord en er wordt meegedacht in mogelijkheden. Het contact was altijd vriendelijk en men nam de tijd om naar je te luisteren.
-
Tuinbouwlaan 1 B6
10We zijn zeer goed geadviseerd en het contact met de makelaar was erg goed. We werden goed op de hoogte gehouden van alles mbt tot de verkoop van het appartement.
-
Kapelstraat 10 E
9Onze ervaring met Van de Wiel is dat de dames een goede begeleiding en feedback geven. Ze hebben korte lijnen en duidelijke communicatie zowel bij aankoop als bij de verkoop.
-
Lunetstraat 52
9Prima communicatie, denken goed mee, leuke mensen, prima prijs kwaliteit verhouding. Kortom, helemaal dik tevreden
-
Bessertpad 10
9Ik ben zeer tevreden. Luisteren goed naar persoonlijke wensen en zijn realistisch in het mee nadenken! Fijne samenwerking
-
Nijvelstraat 19
10Wij hebben het huis verkocht vanwege het overlijden van onze beide ouders. De begeleiding hierbij was continu steunend, transparant, warm professioneel en vlot. Alles werd ons uit handen genomen om een verkoop onder deze omstandigheden accuraat en betrouwbaar te kunnen realiseren. En dat voor een makelaarscourtage waar iedereen in deze tijd blij van wordt. Geen verborgen kosten, gewoon duidelijkheid en kwaliteit.
-
Beeksestraat 26 B
10Translated by AIThe team has helped me super well with good advice, a clear and nice working method, lots of knowledge and for an affordable price. I'm very happy with it!
-
Bernhardlaan 35
10Translated by AIWe are very well assisted. Friendly people, who know what they're talking about and are always ready for you!
-
Middenweg 1 B6
8Translated by AIGood and clear contact. Everything well arranged and good consultation with the seller. Satisfied therefore with the result.
-
Groenstraat 54 M
9Translated by AIIt was especially nice for us that they helped us through all the paperwork and showed patience in guiding us seniors as well as possible.
-
Lunetstraat 14
9Translated by AIVan de Wiel Real Estate is professional, gives good advice, is very reachable, reacts quickly and provides regular updates. In short, nothing but praise!
-
Plantsoen 34
9Translated by AIVan der Wiel real estate has a very good knowledge of the market and perfectly determines the value of the property. The team is skilled and friendly. My house was sold quickly and they guided me well through everything.
-
Moleneind 31
10Translated by AIJust praise for this real estate agent! Very pleasant contact with all the employees of the agency and very professional advice regarding the sale of the property. Always available for questions and always a quick response. Really highly recommended if you are selling your house!!
-
Yifei Wang
10Translated by AII am very satisfied with the service from Van der Wiel real estate agent. He is professional, reliable and always reachable for questions. The sales process went smoothly and clearly, and I felt well guided from start to finish. Definitely a recommendation for everyone who wants to buy or sell a house!
-
Verschuurstraat 24
10Translated by AIVan de Wiel real estate is extremely professional. Everything goes with good consultation and it's short lines. You can always call with questions.
-
Molenstraat 121
10Translated by AIVery satisfied with the real estate agent, who helped me a lot with my questions, but only this assistance was very important to me.
-
Geerakker 5
10Translated by AIContact with the real estate agent was very pleasant from the first conversation to the sale of our house. There was always a quick and expert response and helpful consideration. Highly recommended.
-
Beeksestraat 82 A
9Translated by AIExcellent guidance with good empathy regarding what the other party expects. Furthermore, everyone within the team knows very well what the status is in the process.