- Available
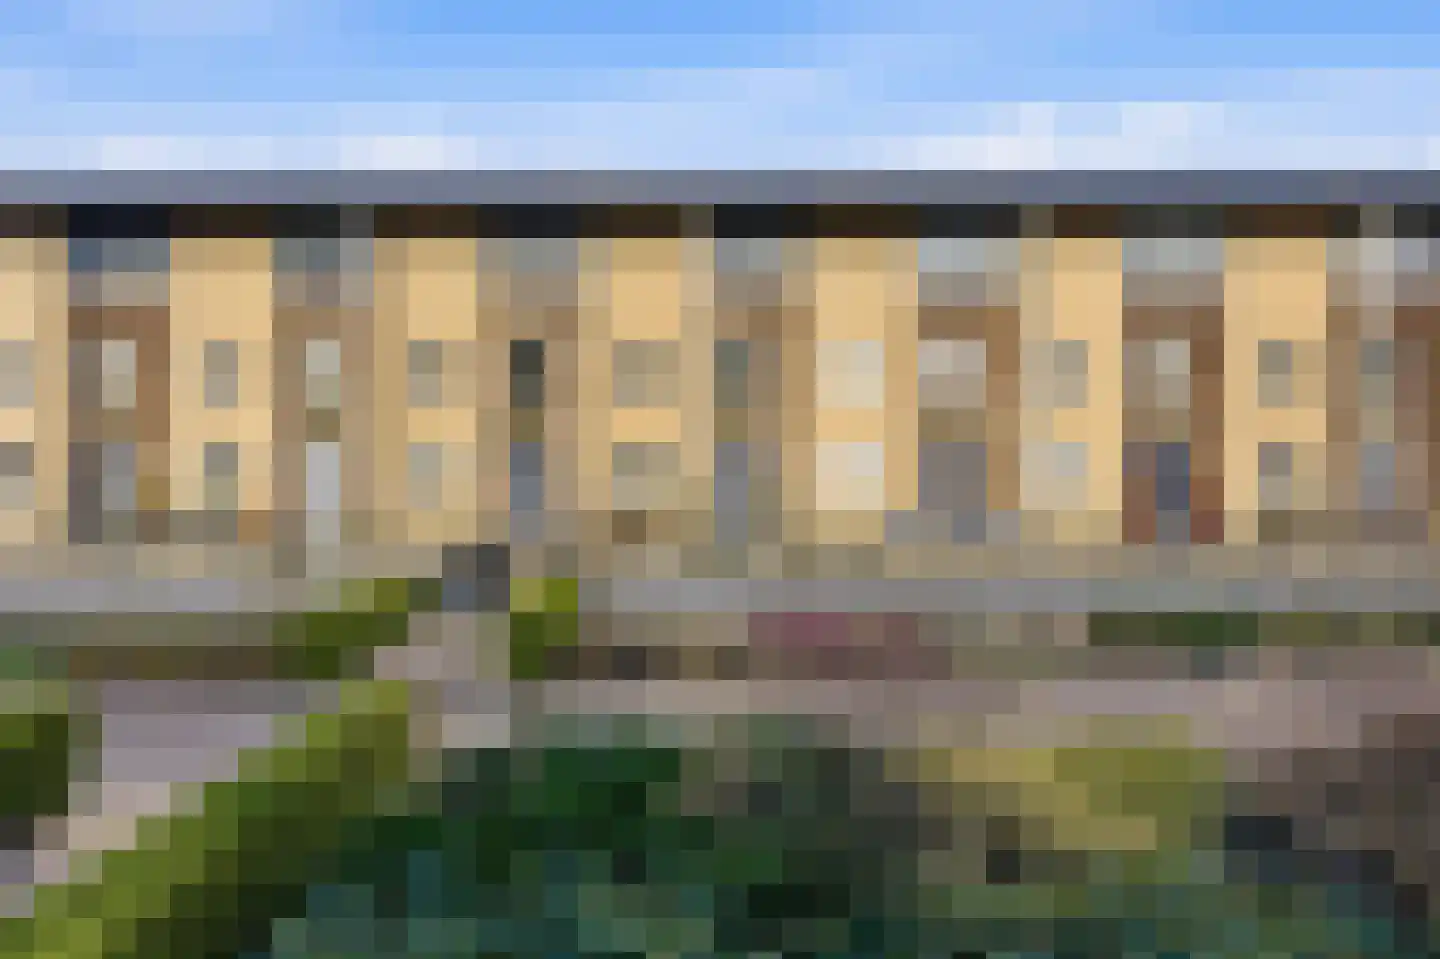
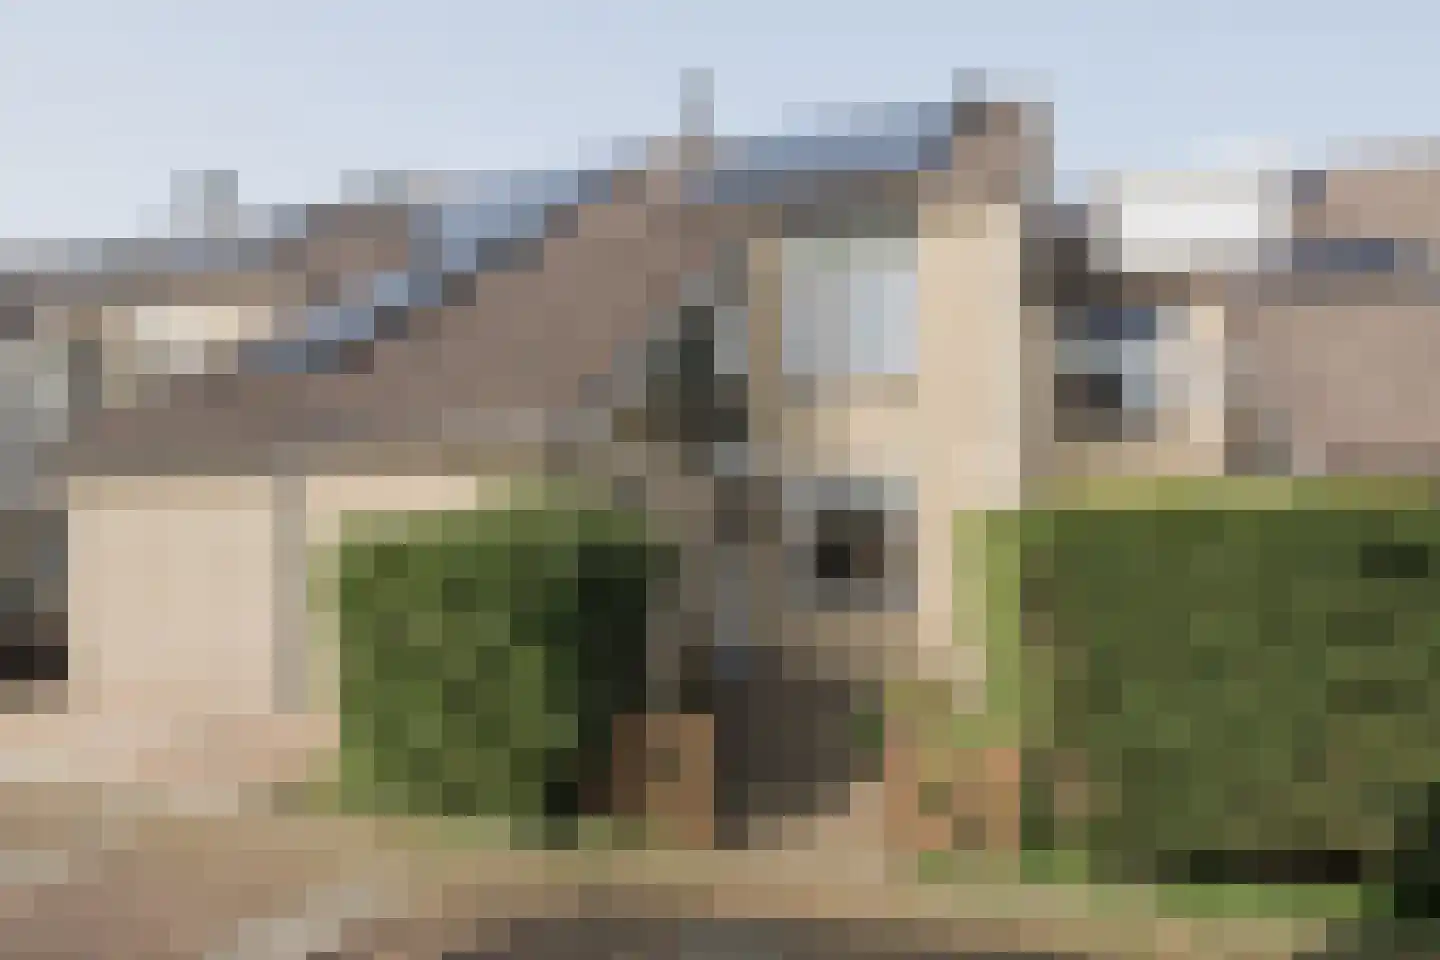
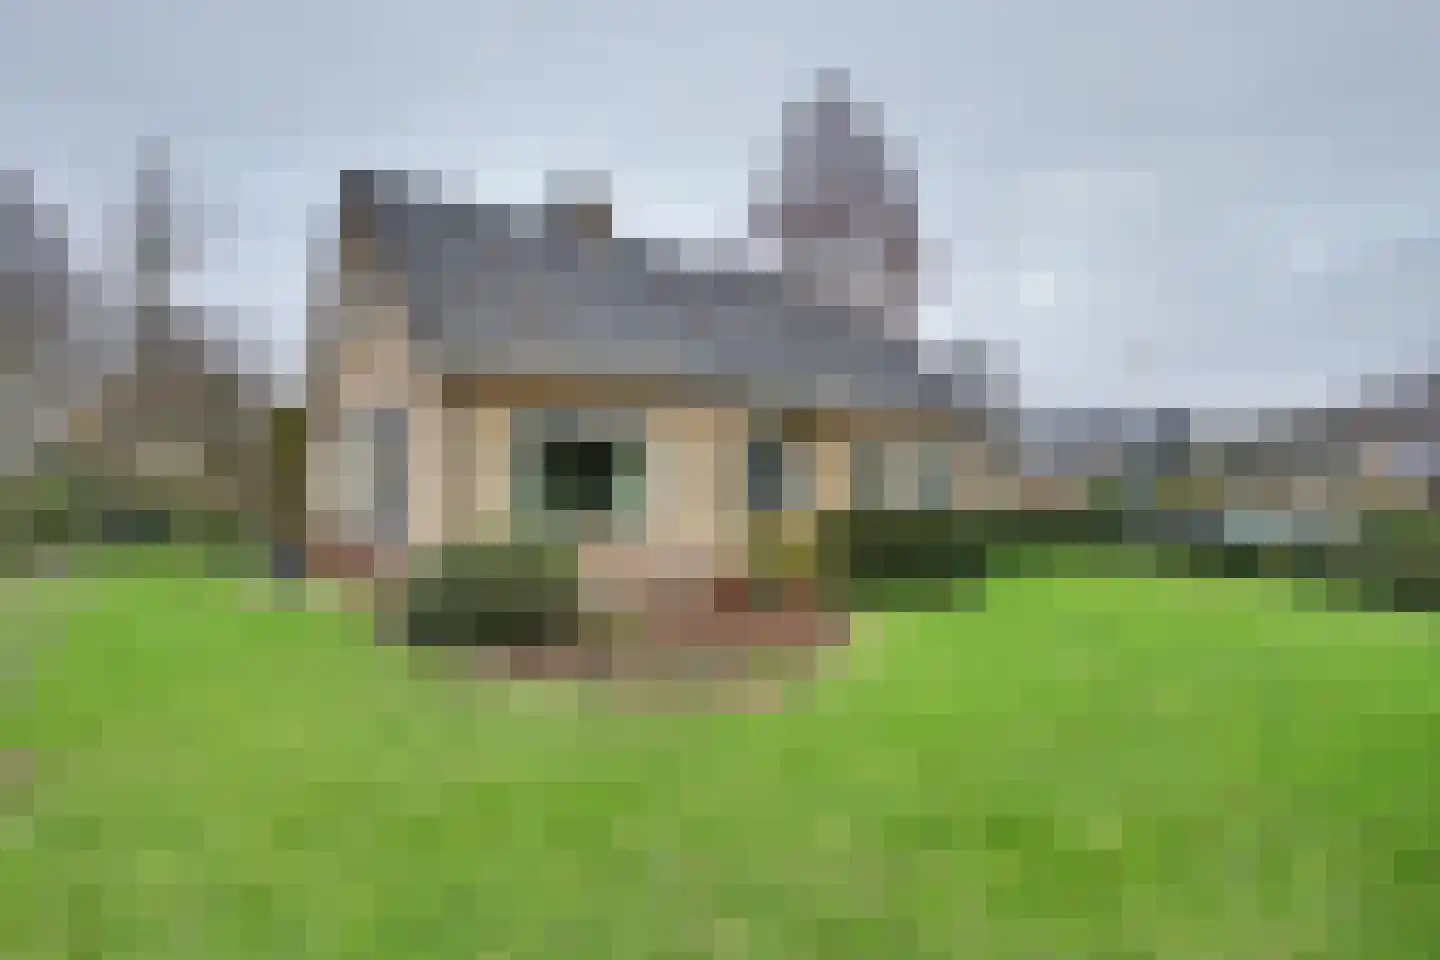
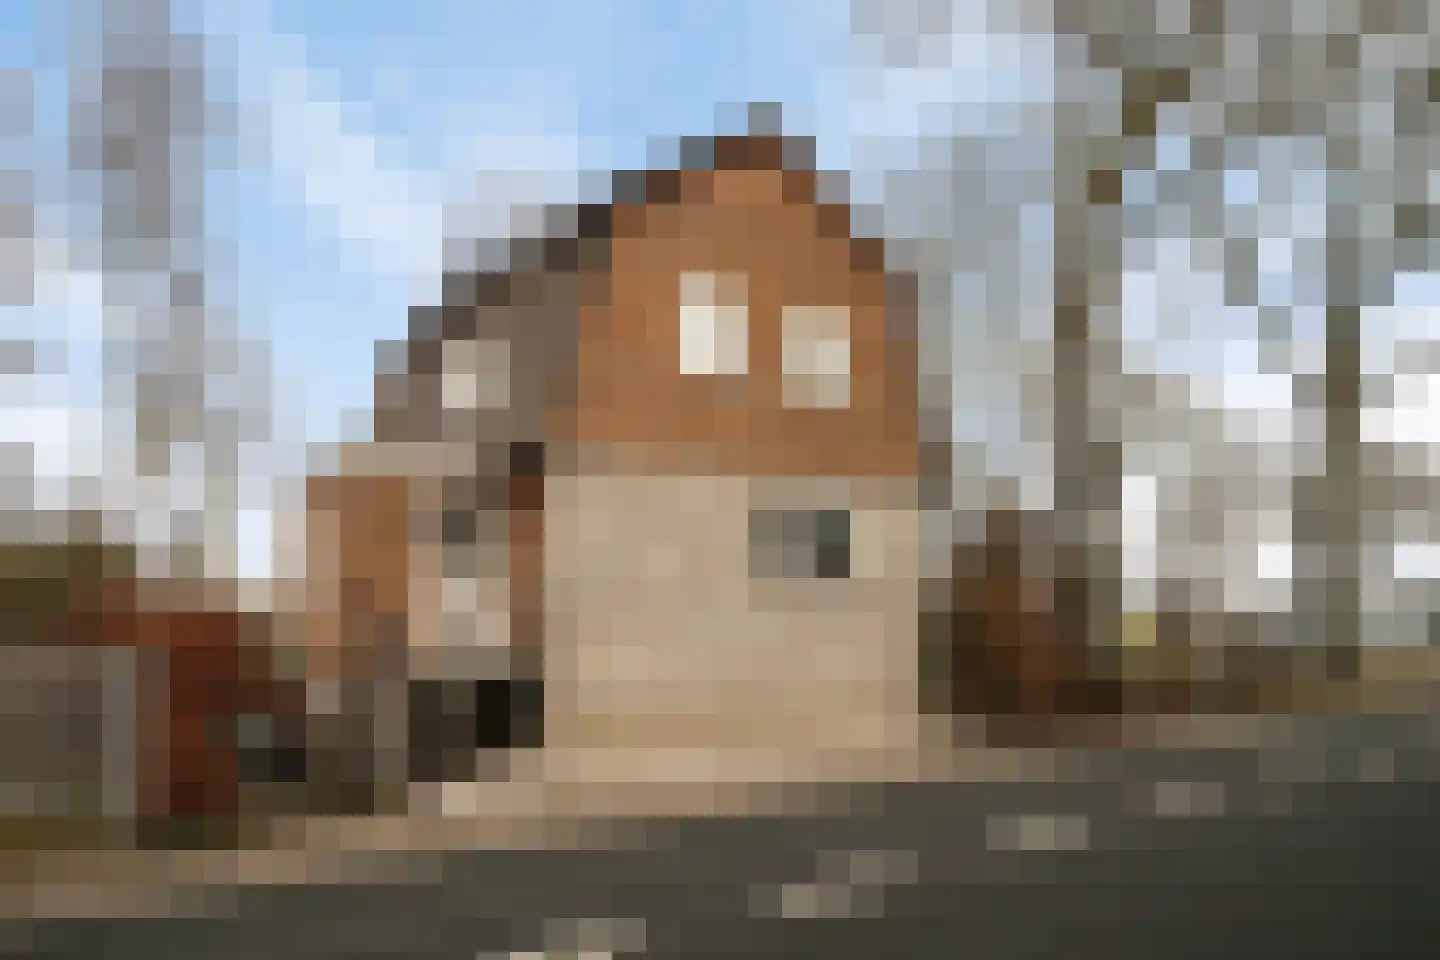
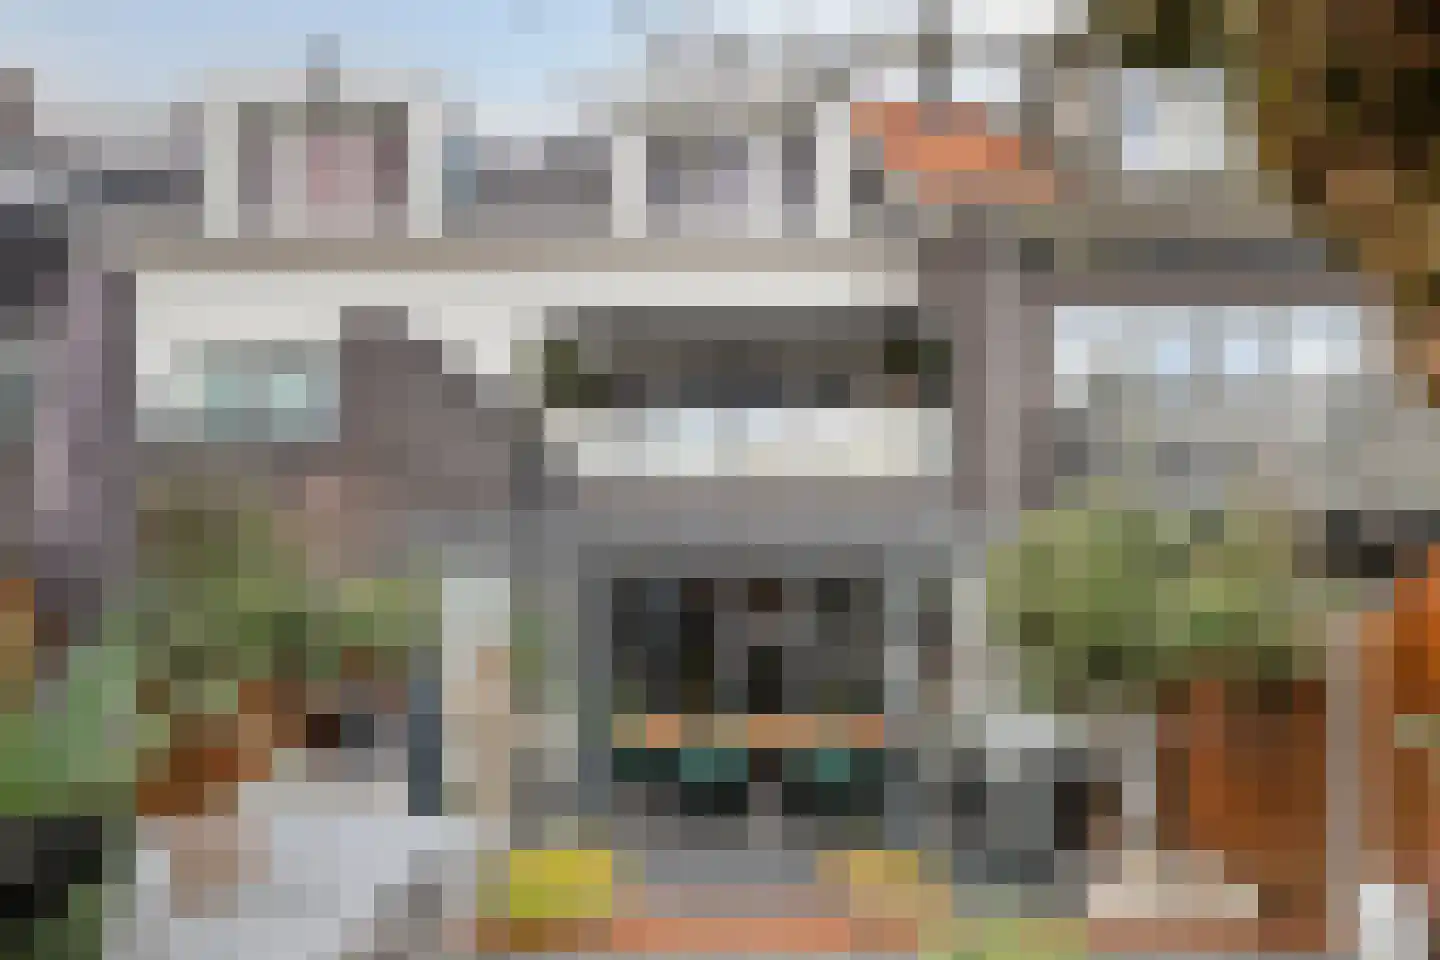
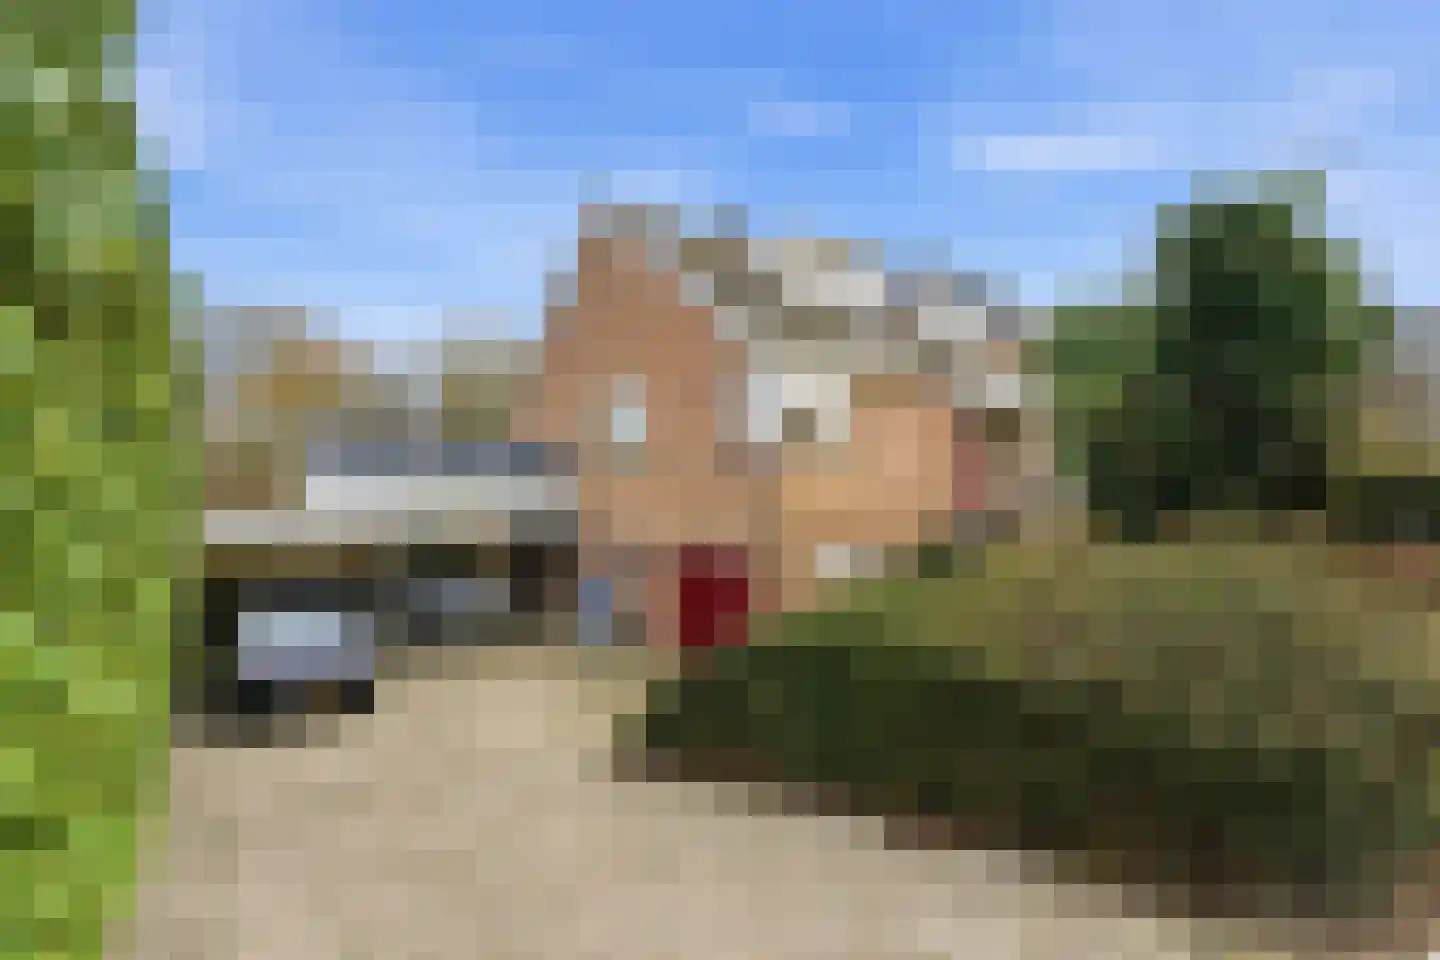
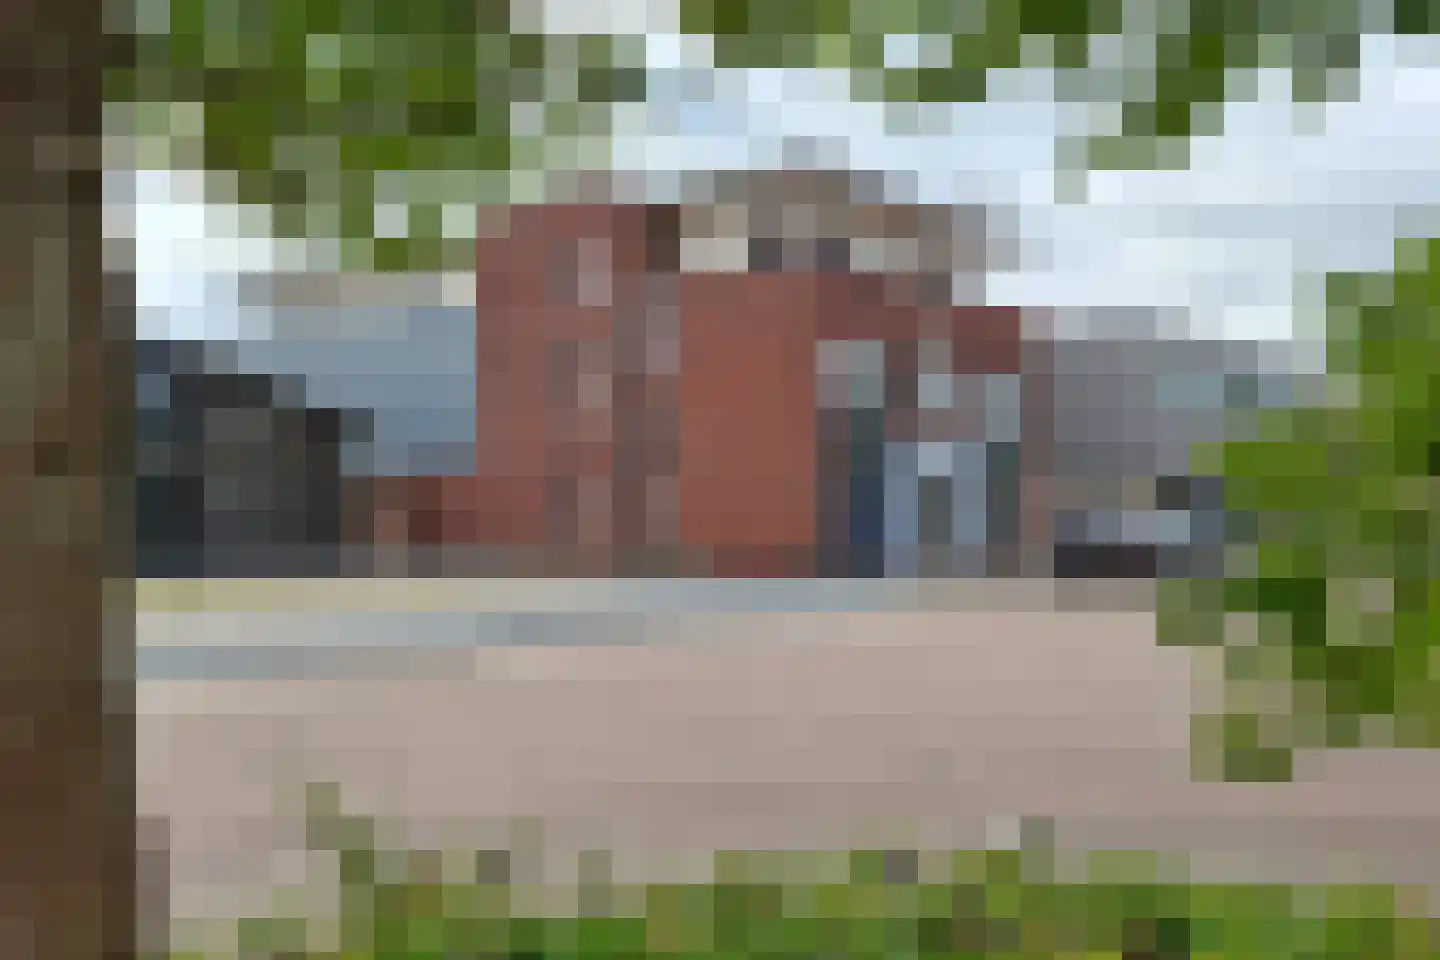
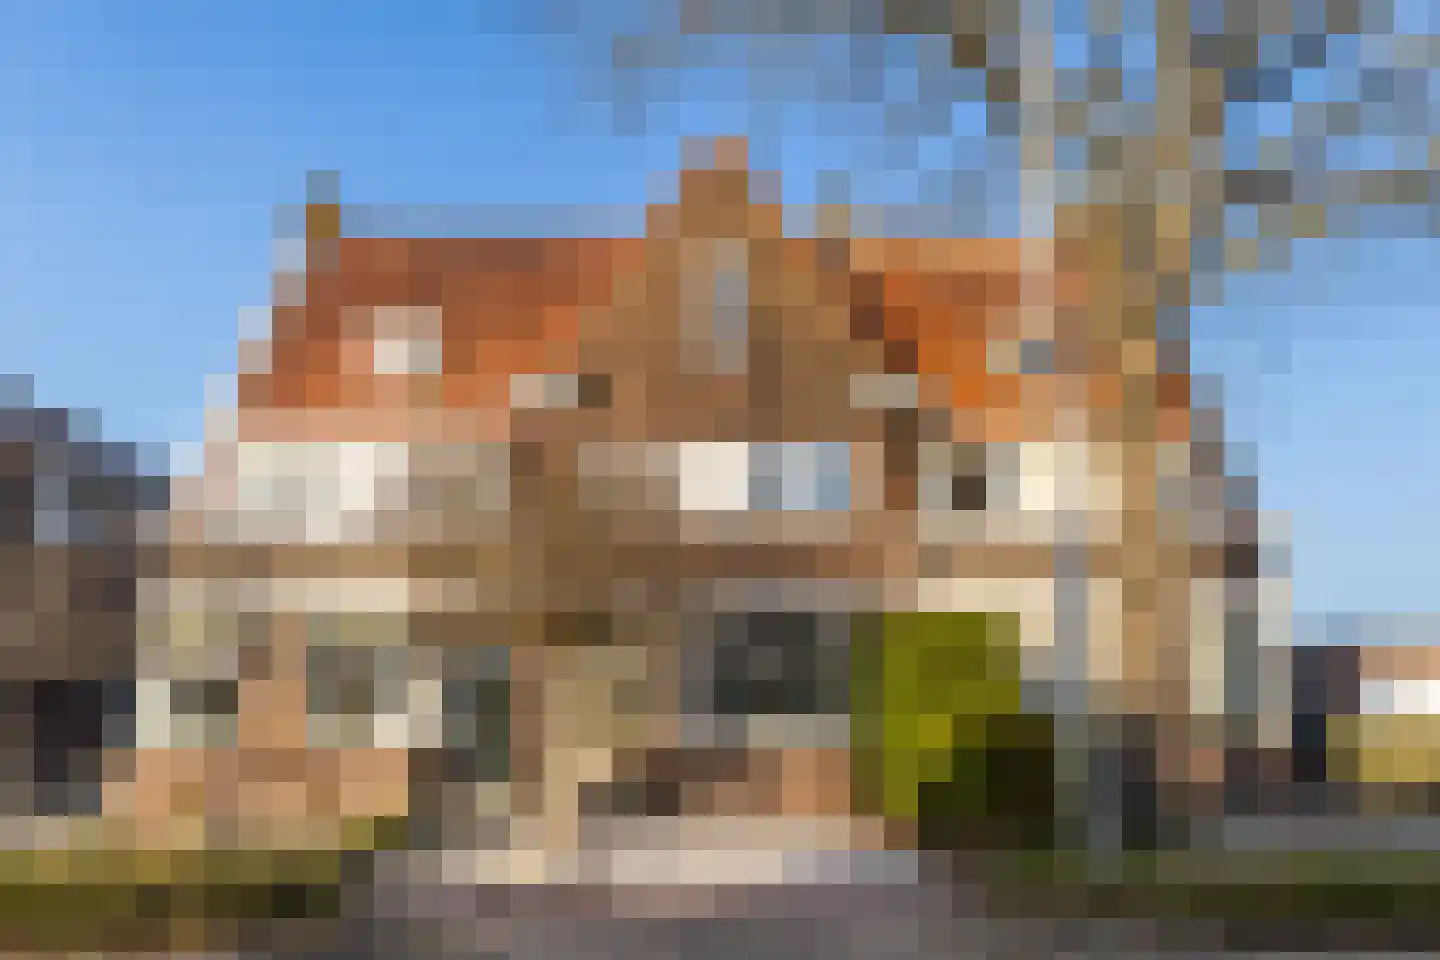
Johann Sebastian Bachstraat 18
2983AB Ridderkerk
€ 495.000 k.k.
€ 4.459/m²
A
Save as favorite
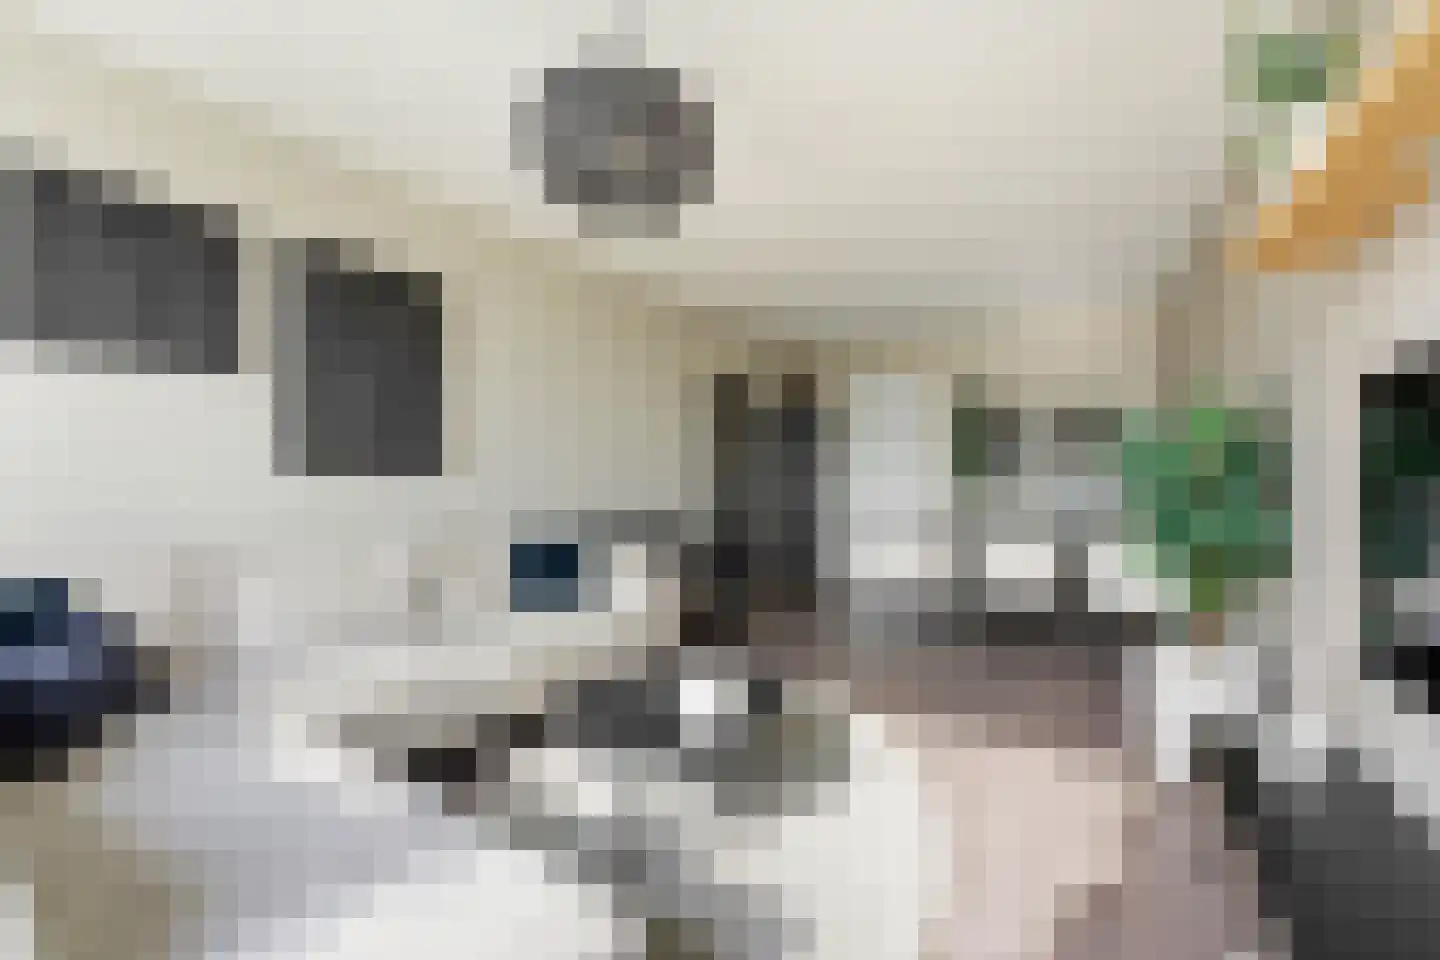
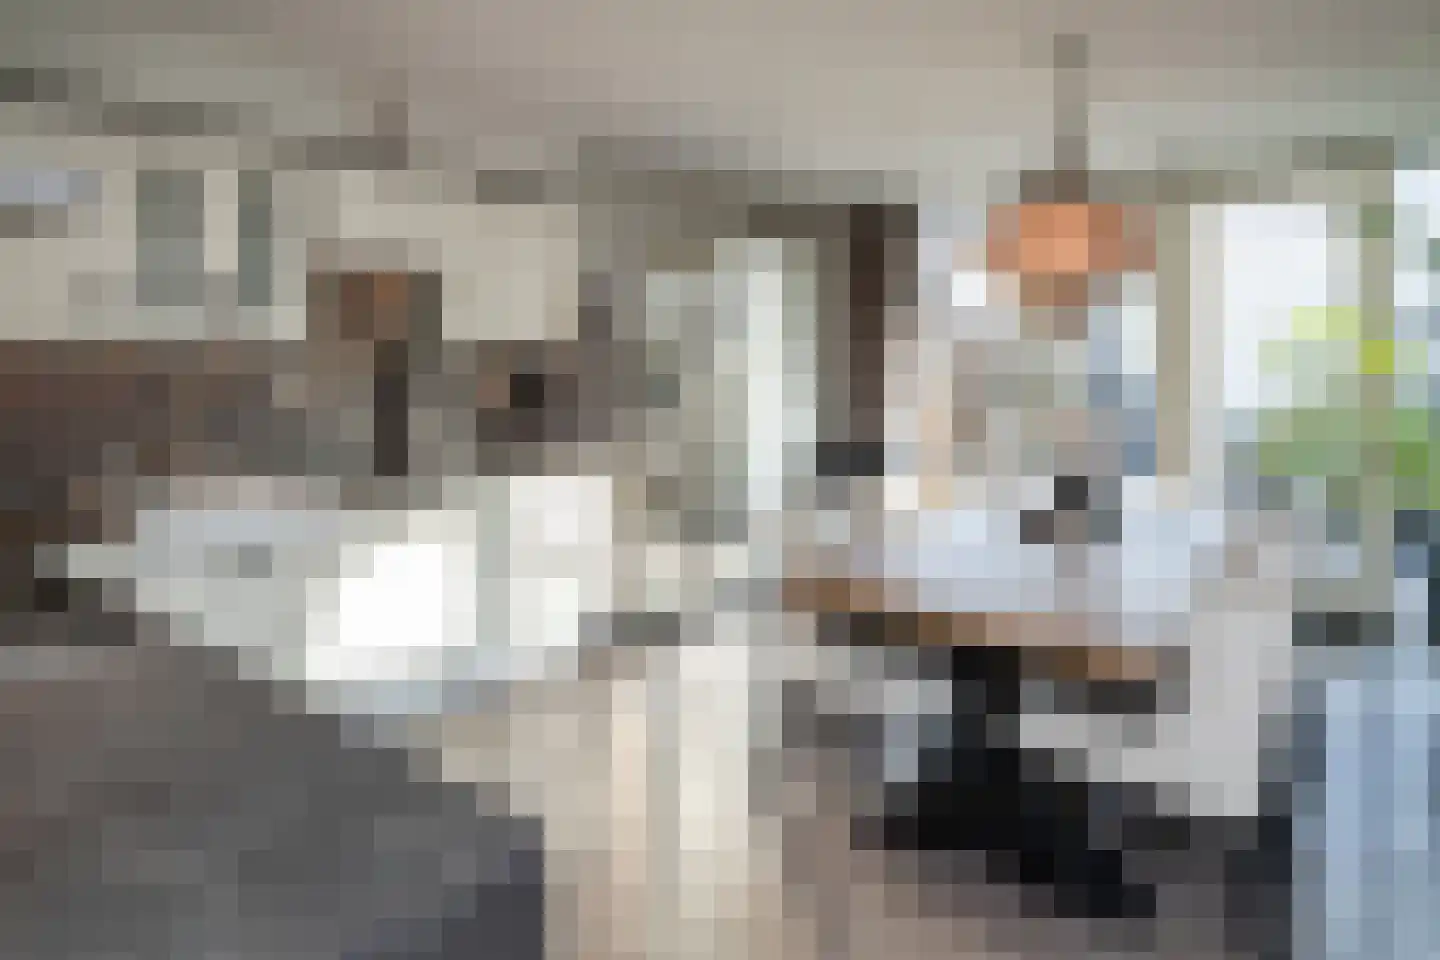
- Living area
- 111 m²
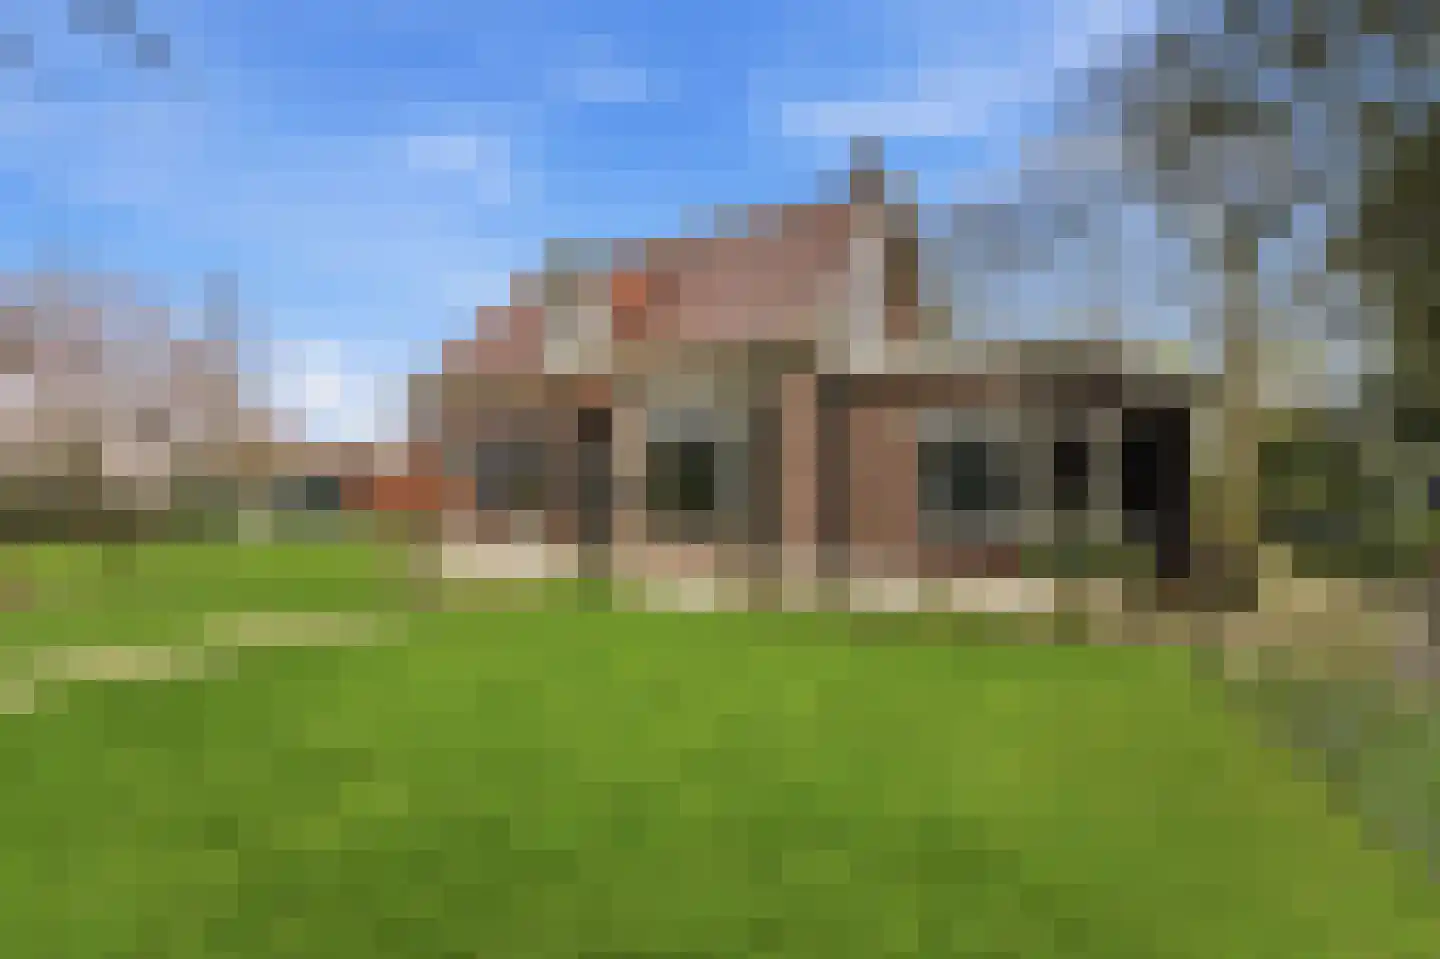
- Land area
- 162 m²
- Bedrooms
- 3