- Sold
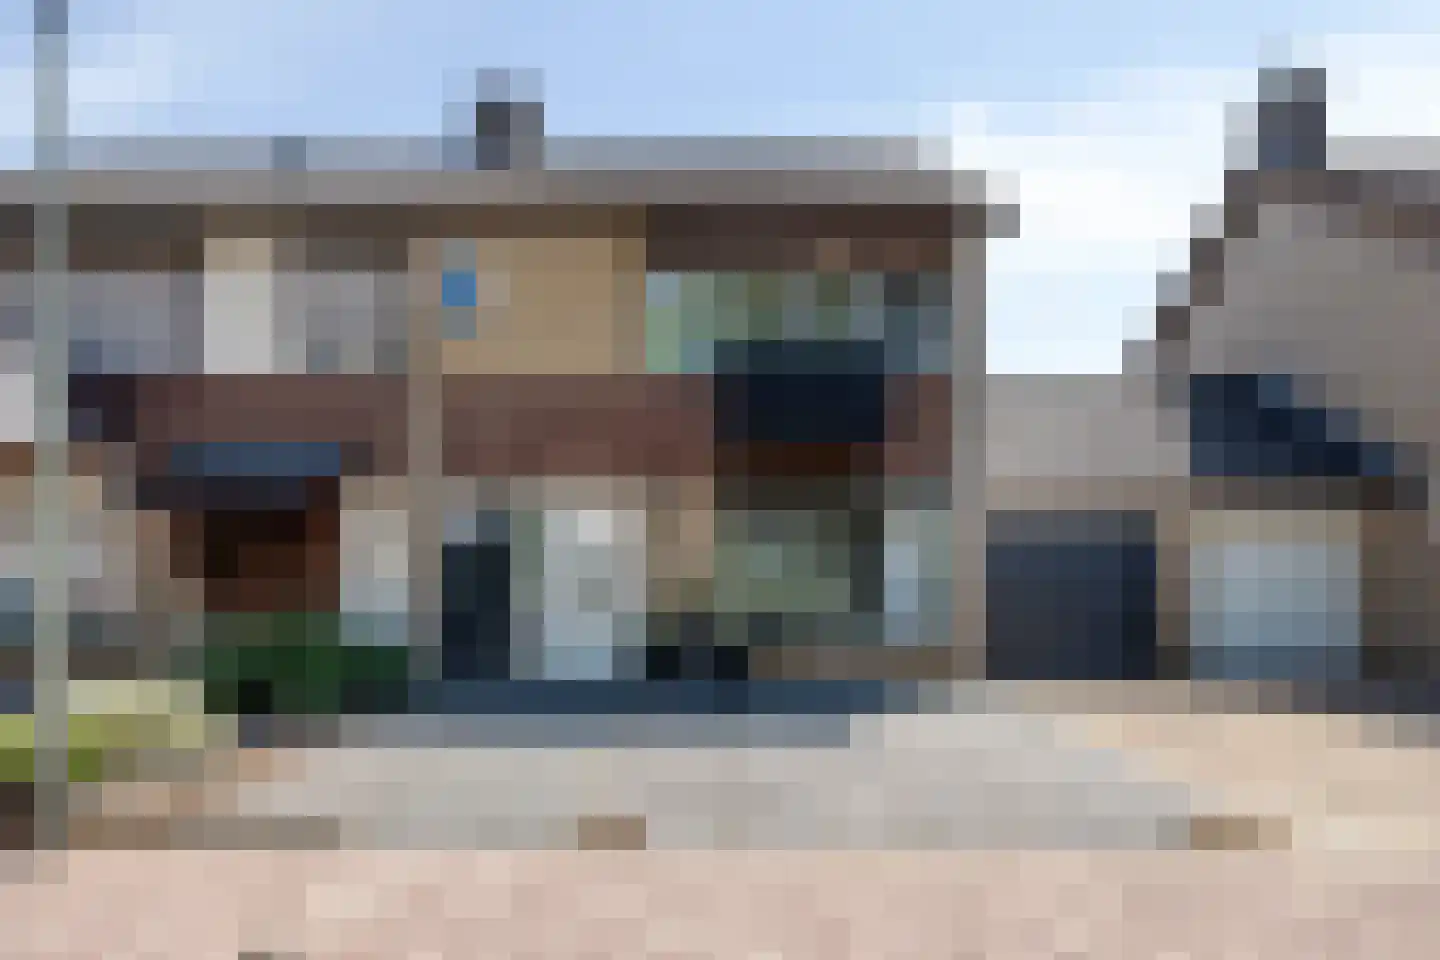
Le Bron de Vexelastraat 67
6042AP Roermond
€ 225.000 k.k.
€ 2.647/m²
- Living area
- 85 m²
- Land area
- —
- Bedrooms
- 2
View 385 sold houses in Roermond
Type to search. Use arrow down and arrow up to navigate through results and press Enter to open.
Hidden search suggestions.
Compare sold homes in Roermond or view the current offering in this location directly.
On this page you will find recently sold homes in Roermond. Use this overview to better estimate selling prices, popular neighborhoods, and the local housing supply before you choose a real estate agent. Also view the current housing supply with 658 houses in Roermond.
6042AP Roermond
€ 225.000 k.k.
€ 2.647/m²
6042HX Roermond
€ 445.000 k.k.
€ 3.248/m²
6042AR Roermond
€ 475.000 k.k.
€ 3.467/m²
6041HG Roermond
€ 425.000 k.k.
€ 3.828/m²
6041HR Roermond
€ 695.000 k.k.
€ 2.673/m²
6044RR Roermond
€ 235.000 k.k.
€ 2.611/m²
6042LG Roermond
€ 375.000 k.k.
€ 3.378/m²
6041AL Roermond
€ 310.000 k.k.
€ 2.844/m²
6042MA Roermond
€ 459.000 k.k.
€ 3.672/m²
6041CM Roermond
€ 300.000 k.k.
€ 3.260/m²
6042XE Roermond
€ 298.000 k.k.
€ 3.072/m²
6043GW Roermond
€ 240.000 k.k.
€ 3.428/m²
6045CP Roermond
€ 249.000 k.k.
€ 2.417/m²
6042TB Roermond
€ 360.000 k.k.
€ 3.302/m²
6042JM Roermond
€ 349.000 k.k.
€ 2.860/m²
6041HC Roermond
€ 415.000 k.k.
€ 3.217/m²
6043XB Roermond
€ 275.000 k.k.
€ 1.858/m²
6043XT Roermond
€ 389.000 k.k.
€ 2.576/m²
6041LN Roermond
€ 365.000 k.k.
€ 3.230/m²
6043XT Roermond
€ 435.000 k.k.
€ 2.788/m²
6041XB Roermond
€ 430.000 k.k.
€ 3.440/m²
6043KE Roermond
€ 295.000 k.k.
€ 3.831/m²
6041GA Roermond
€ 125.000 k.k.
€ 2.500/m²
6041JK Roermond
€ 189.000 k.k.
€ 4.974/m²
6043WH Roermond
€ 895.000 k.k.
€ 3.874/m²
6045AT Roermond
€ 425.000 k.k.
€ 3.899/m²
6044SW Roermond
€ 400.000 k.k.
€ 2.614/m²
6041HJ Roermond
€ 239.000 k.k.
€ 3.414/m²
Get free quotes from realtors with local market knowledge in Roermond.
Selling a home in Roermond? Compare real estate agents who know the local housing market. Also check out all real estate agents in Roermond or the top 10 real estate agents in Roermond for extra context for your choice.
By comparing brokers and requesting quotes
Short answers about housing prices, sold homes and comparing real estate agents in Roermond.
The costs of a real estate agent in Roermond vary per office, property type and sales approach. Therefore, compare multiple quotes and also look at the real estate agents in Roermond to better compare rates, presentation and local experience.
On this page we currently show 385 sold houses in Roermond from our selection. This helps you to better assess recent transactions and the local housing market.
Houses sold in Roermond give insight into asking prices, house types and neighborhoods where recent transactions have taken place. Compare this also with the current housing stock in Roermond to better understand the market.
You can use sold homes as a first market indication, but a local real estate agent can better take into account finishing, location, maintenance and current demand in Roermond.
Compare realtors in Roermond on local sales experience, reviews, expected yield, commission and marketing approach. The top 10 realtors in Roermond helps to quickly discover strong offices.
View current location data on residents, WOZ development, housing stock, energy consumption, business activity and safety in Roermond. In 2026 were there 44.047 residents. The average WOZ value in 2025 is EUR 293.330.
These figures help to better assess and compare the housing stock in Roermond with recent sold homes. Orient yourself then on suitable top real estate agents in Roermond for sales advice in this region.
Residents
44.047
Last year: 2026
Average WOZ
EUR 293.330
Last year: 2025
Average income per person.
EUR 31.106
Source: AllNumbers
Crimes (current year)
3.816
Total registered
| Year | Residents |
|---|---|
| 2021 | 41.990 |
| 2022 | 42.310 |
| 2023 | 42.880 |
| 2024 | 43.480 |
| 2025 | 43.940 |
| 2026 | 44.047 |
| Year | Average WOZ |
|---|---|
| 2021 | EUR 214.372 |
| 2022 | EUR 229.567 |
| 2023 | EUR 272.415 |
| 2024 | EUR 274.188 |
| 2025 | EUR 293.330 |
Hoger
9.760
Praktisch
10.320
Middelbaar
13.220
Europa
7.080
Nederland
26.255
Buiten Europa
10.590
Label C
5.576
Label A
5.559
Label B
3.906
Label D
2.147
Label F
1.707
Label G
1.539
Label E
1.450
Label A+
525
Label A+++
481
Label A++++
318
Label A++
187
Label A+++++
0
| Year | Gas (m3) | Electricity (kWh) |
|---|---|---|
| 2020 | 1.134 | 2.644 |
| 2021 | 1.282 | 2.655 |
| 2022 | 985 | 2.526 |
| 2023 | 829 | 2.415 |
| 2024 | 809 | 2.472 |
Hoekwoning
Gas: 1.007 • Electricity: 2.808
Huurwoning
Gas: 694 • Electricity: 1.981
Koopwoning
Gas: 987 • Electricity: 2.878
Appartement
Gas: 617 • Electricity: 1.807
Tussenwoning
Gas: 882 • Electricity: 2.580
Vrijstaande woning
Gas: 1.386 • Electricity: 3.864
Twee-onder-één-kap woning
Gas: 1.139 • Electricity: 2.984
Total number of company establishments: 5.765
| Period | Crimes |
|---|---|
| jan 2026 | 274 |
| jul 2025 | 309 |
| jun 2025 | 317 |
| mei 2025 | 326 |
| mrt 2025 | 312 |
| mrt 2026 | 264 |
| nov 2024 | 304 |
| nov 2025 | 293 |
| okt 2024 | 384 |
| okt 2025 | 292 |
| sep 2024 | 305 |
| sep 2025 | 273 |
These figures give an indicative picture of safety trends in the living environment of Roermond.
Short answers based on current local statistics, handy for a quick comparison of the living environment.
Roermond telt in 2026 ongeveer 44.047 inwoners.
De gemiddelde WOZ-waarde in Roermond is in 2025 circa € 293.330.
Het gemiddelde inkomen per inwoner in Roermond ligt rond € 31.106 per jaar.
Voor het huidige jaar gaat het om ongeveer 3.816 geregistreerde misdrijven. Gebruik deze cijfers als indicatie en vergelijk trends per periode.
In Roermond komt vooral "Appartementen" veel voor, met ongeveer 9.683 woningen.