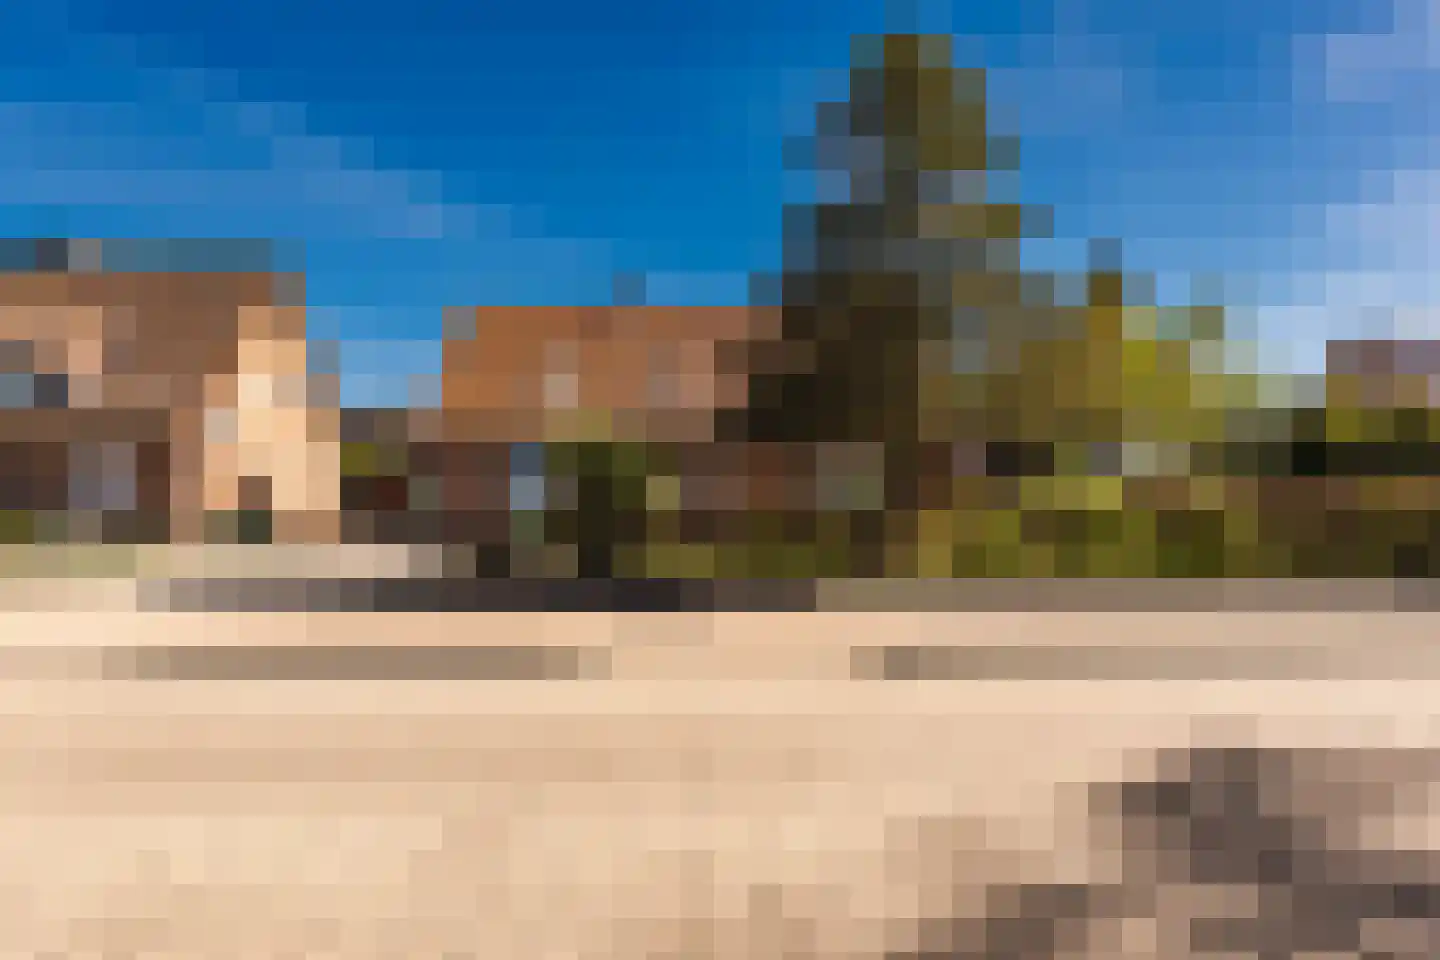
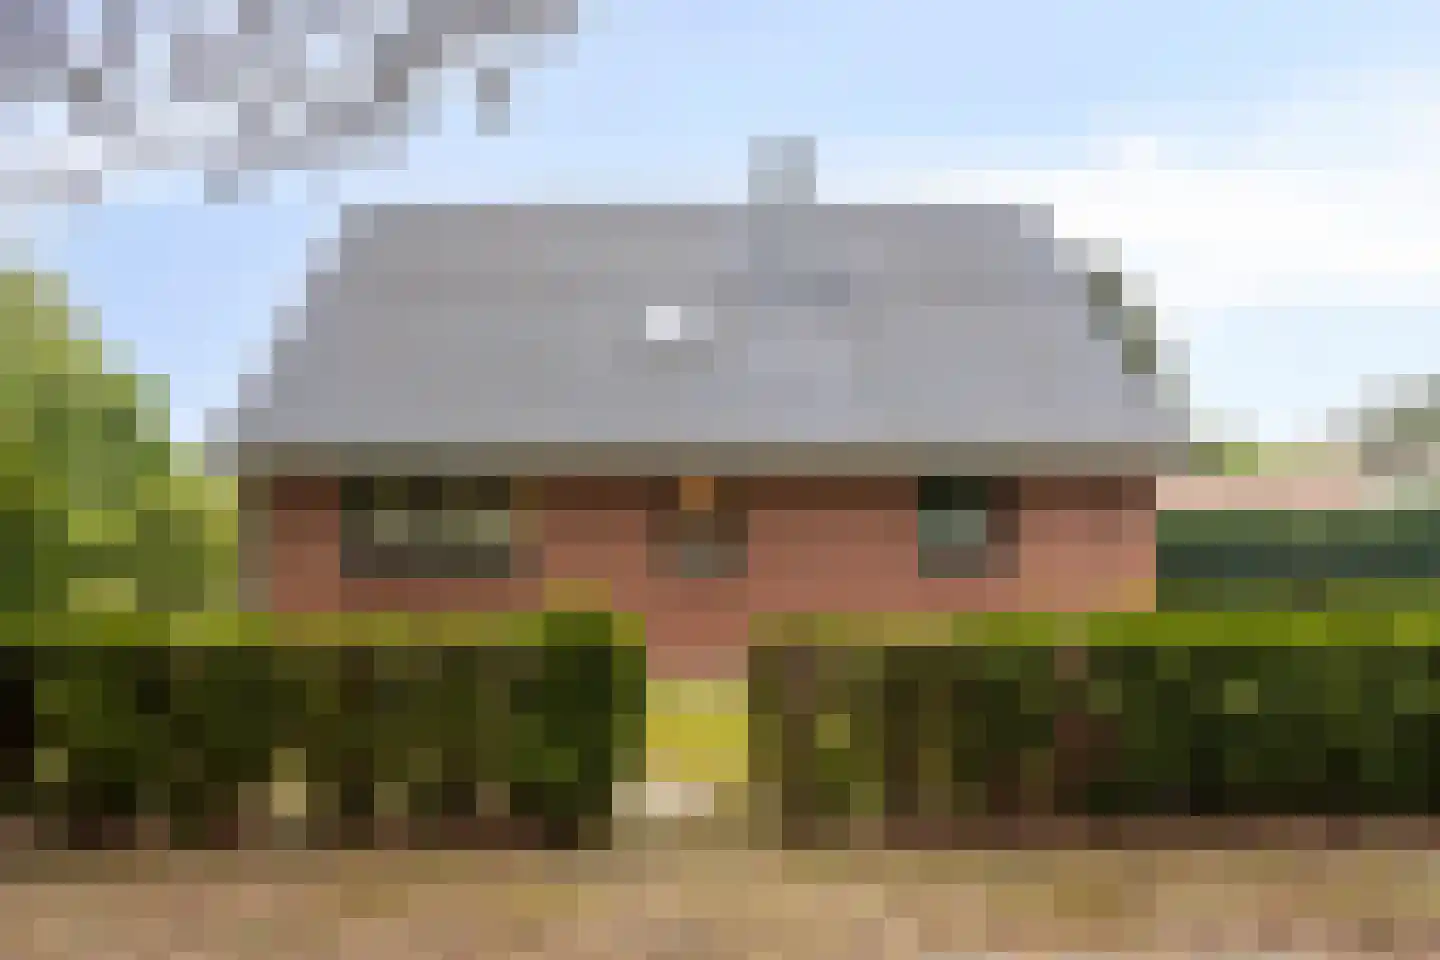
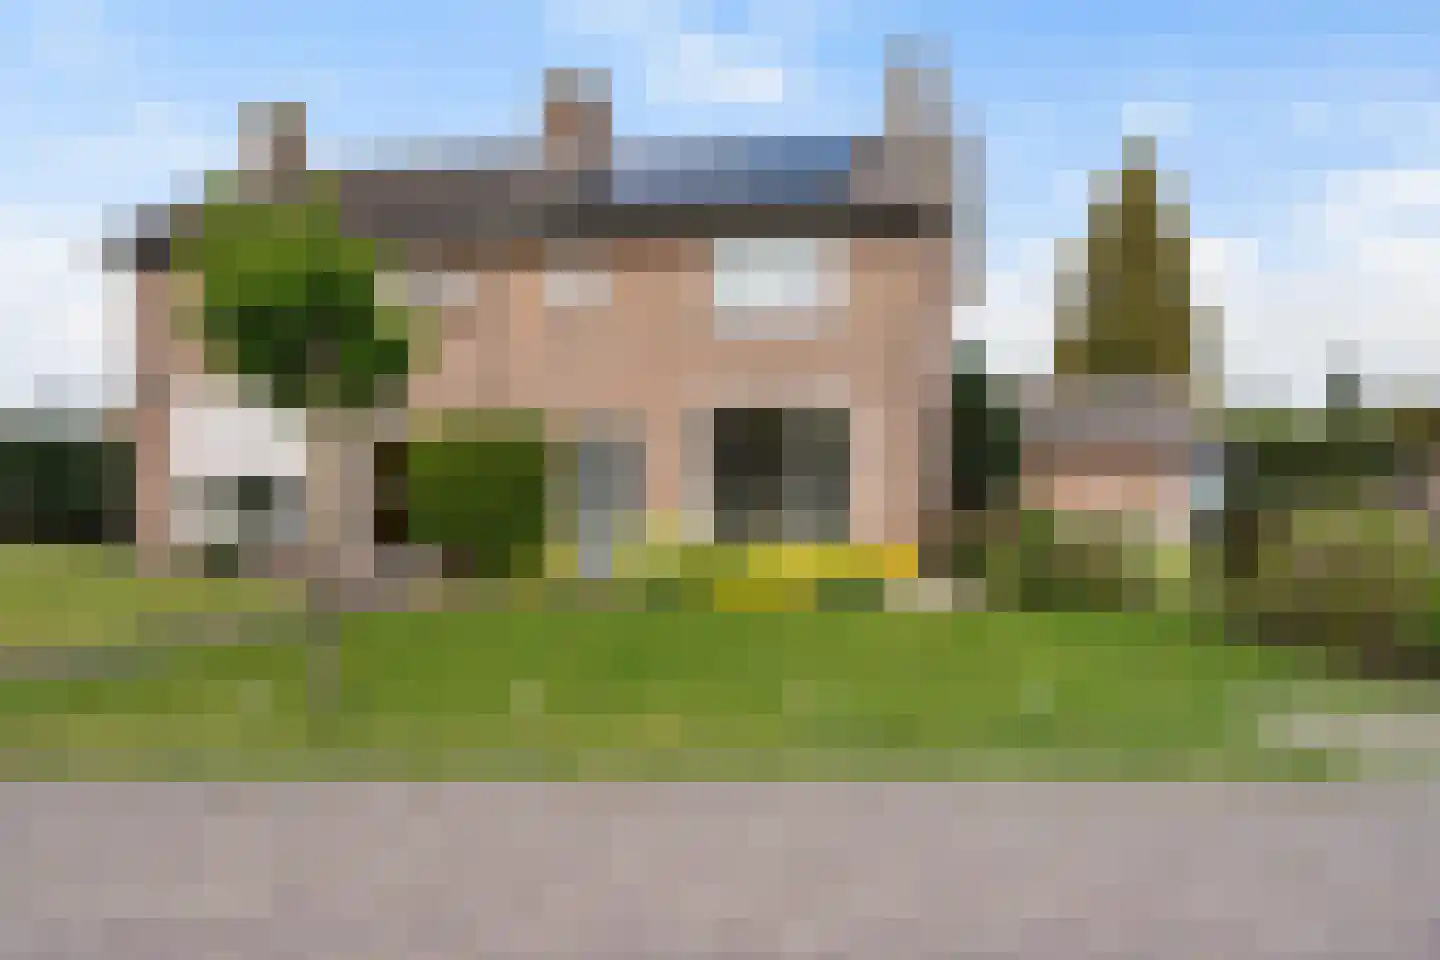
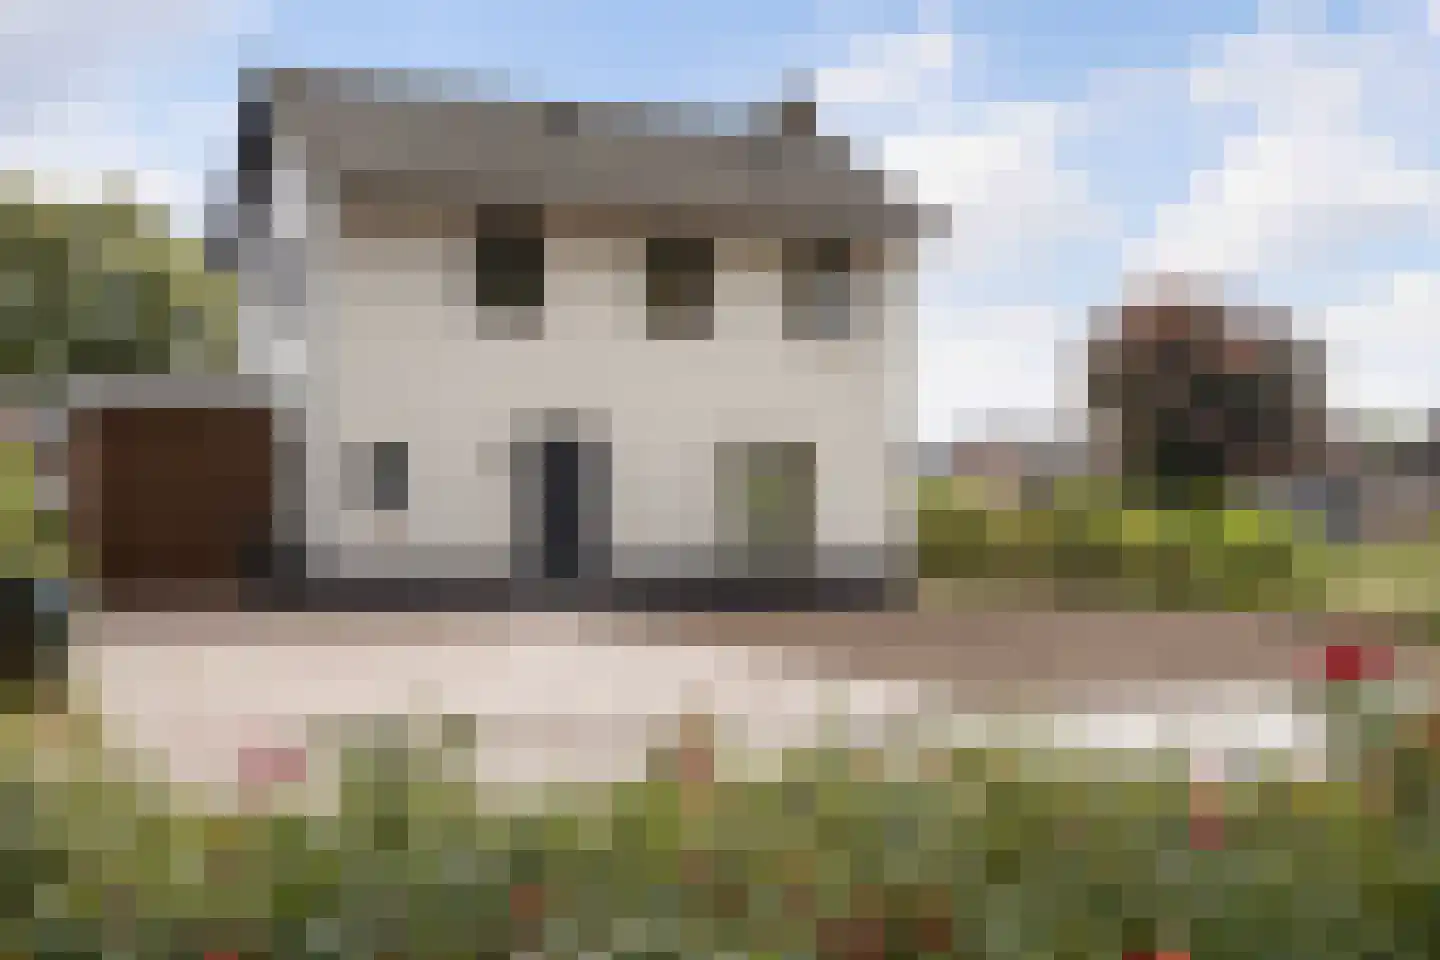
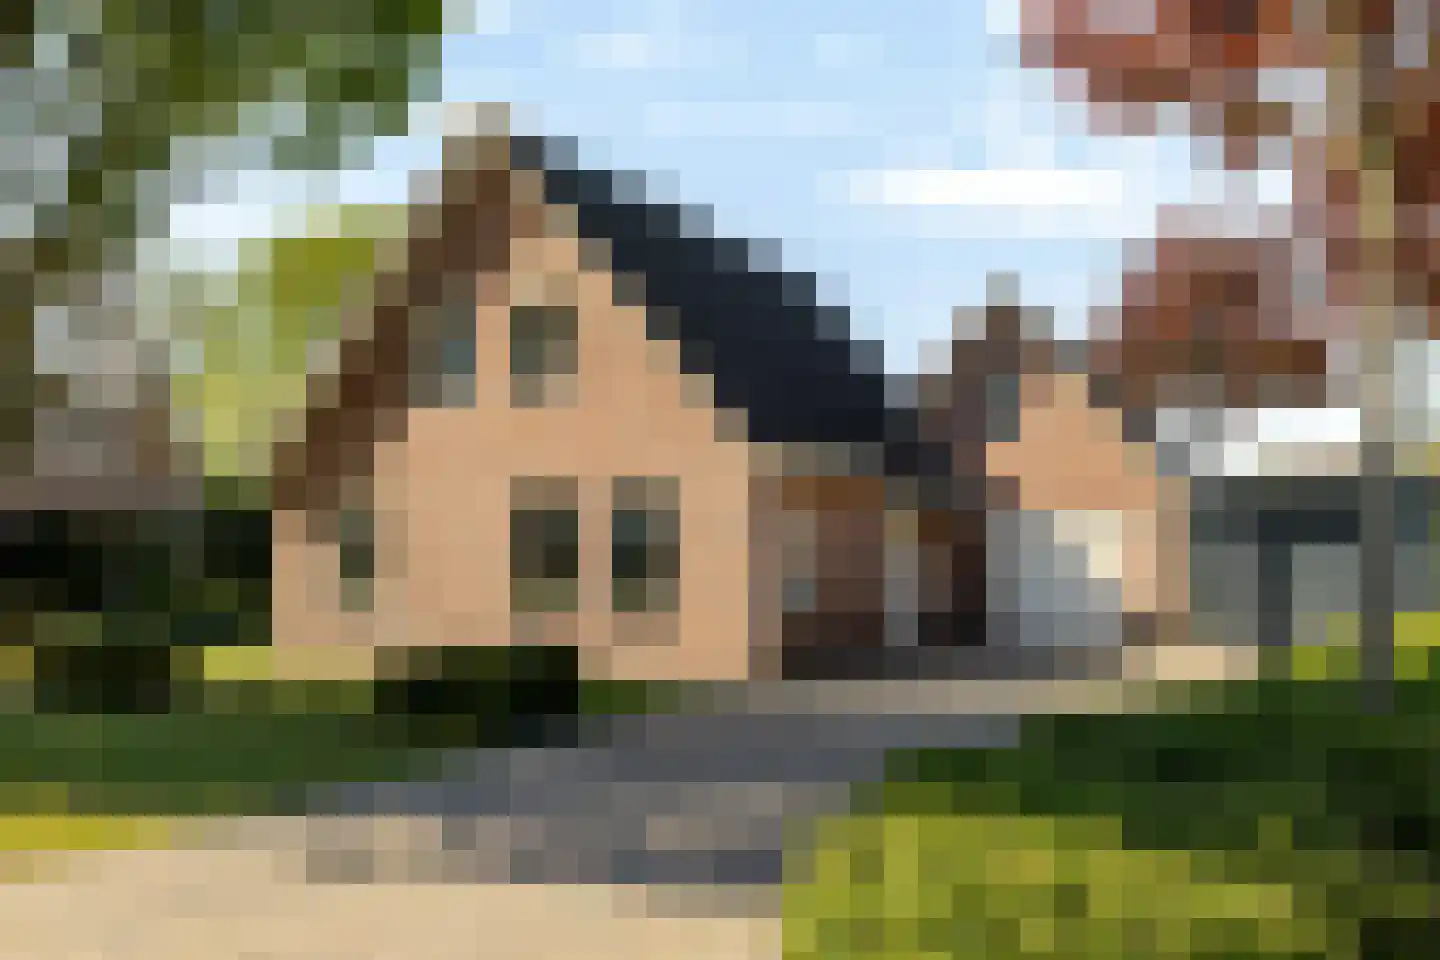
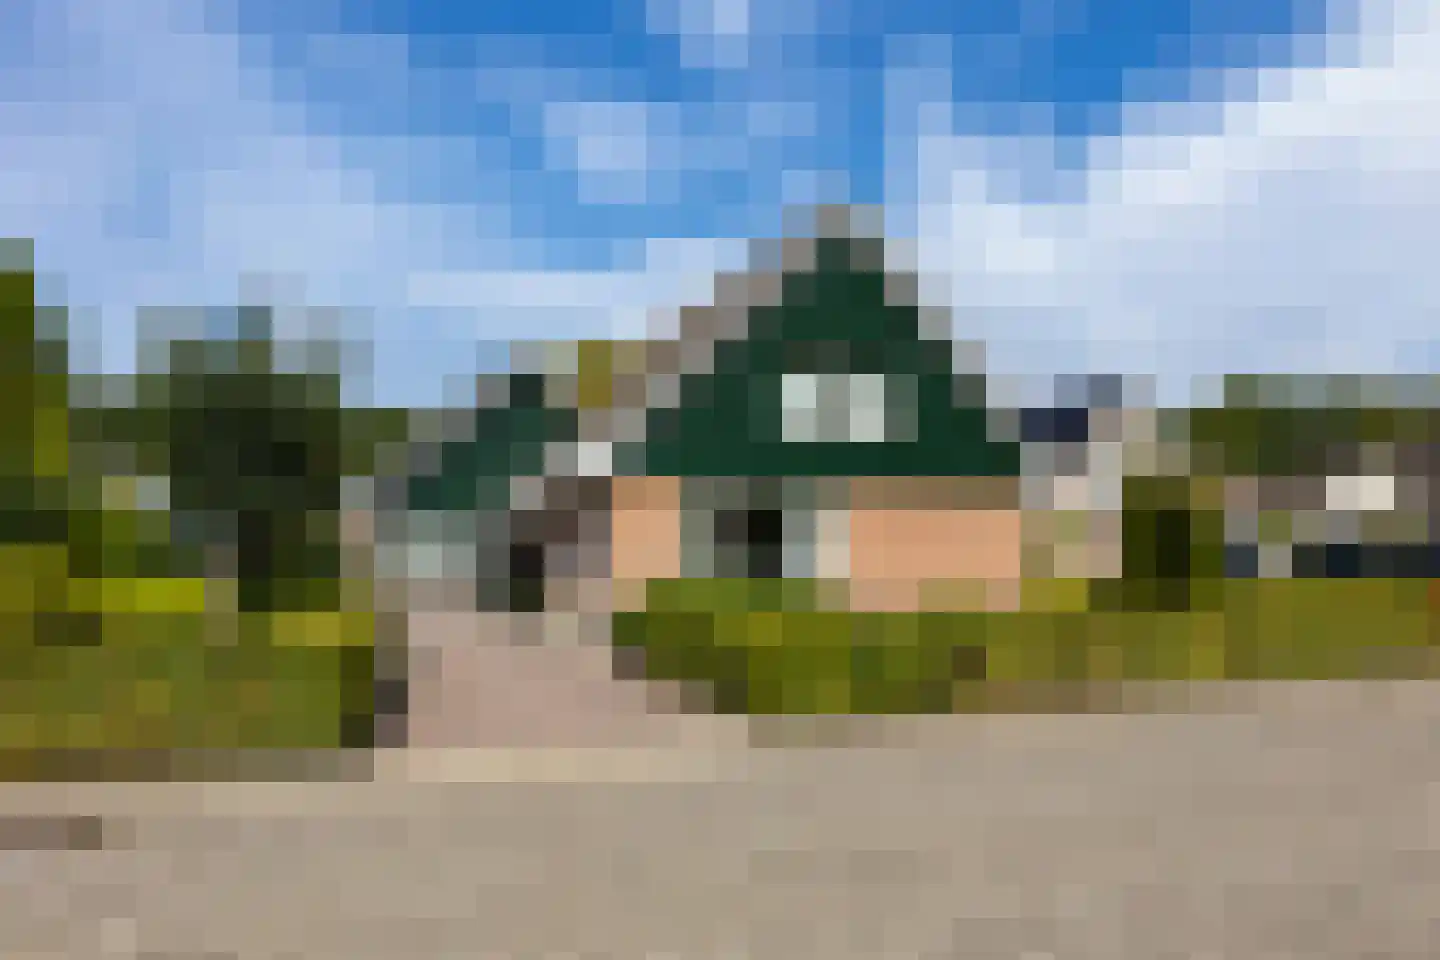
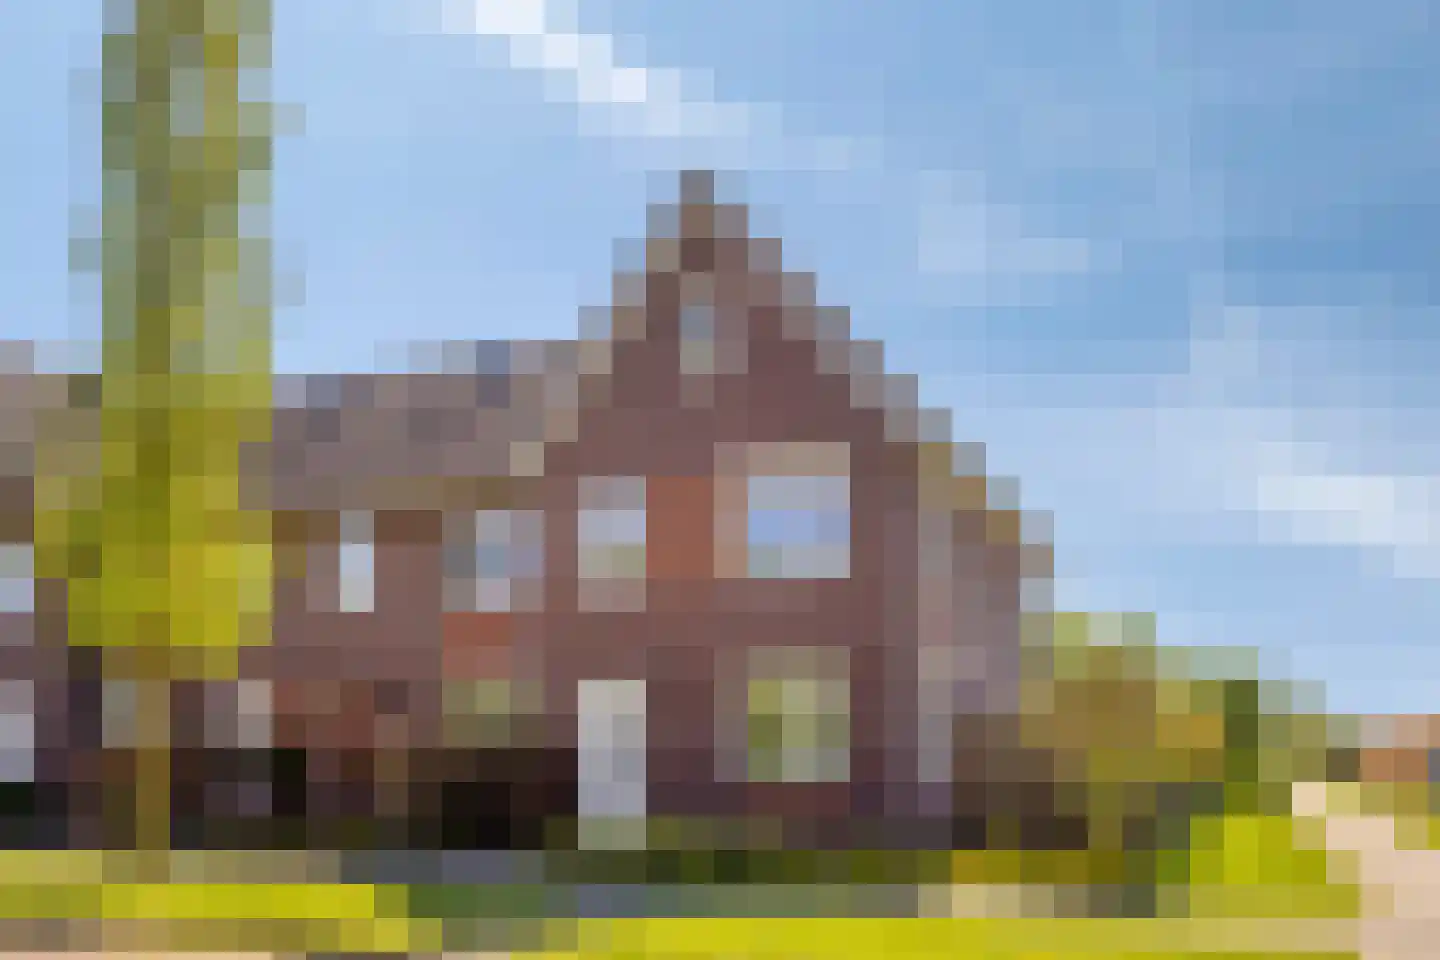
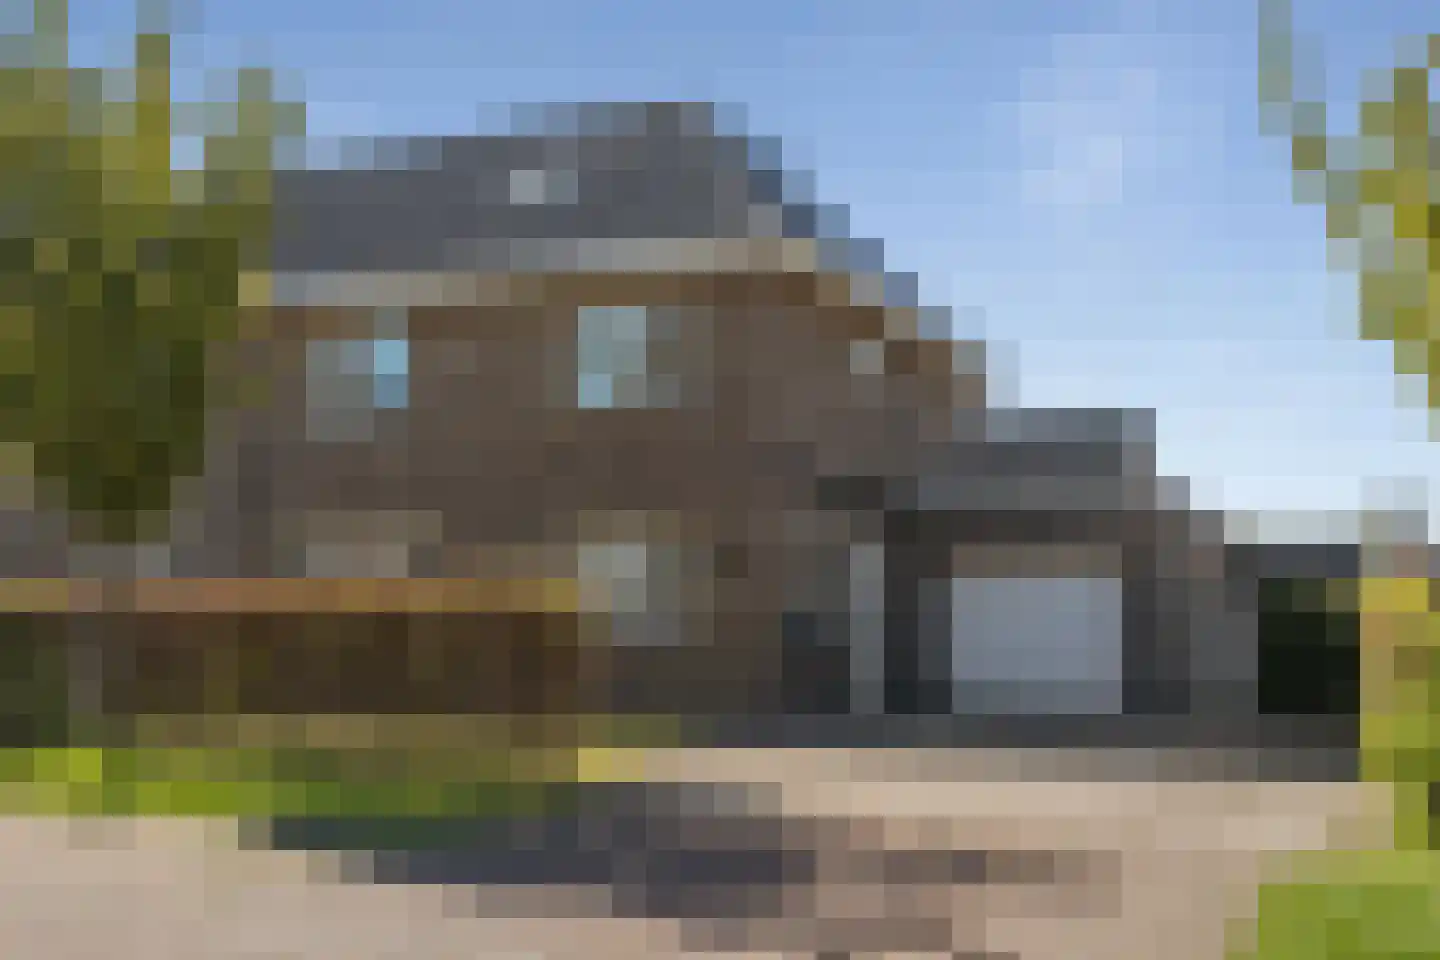
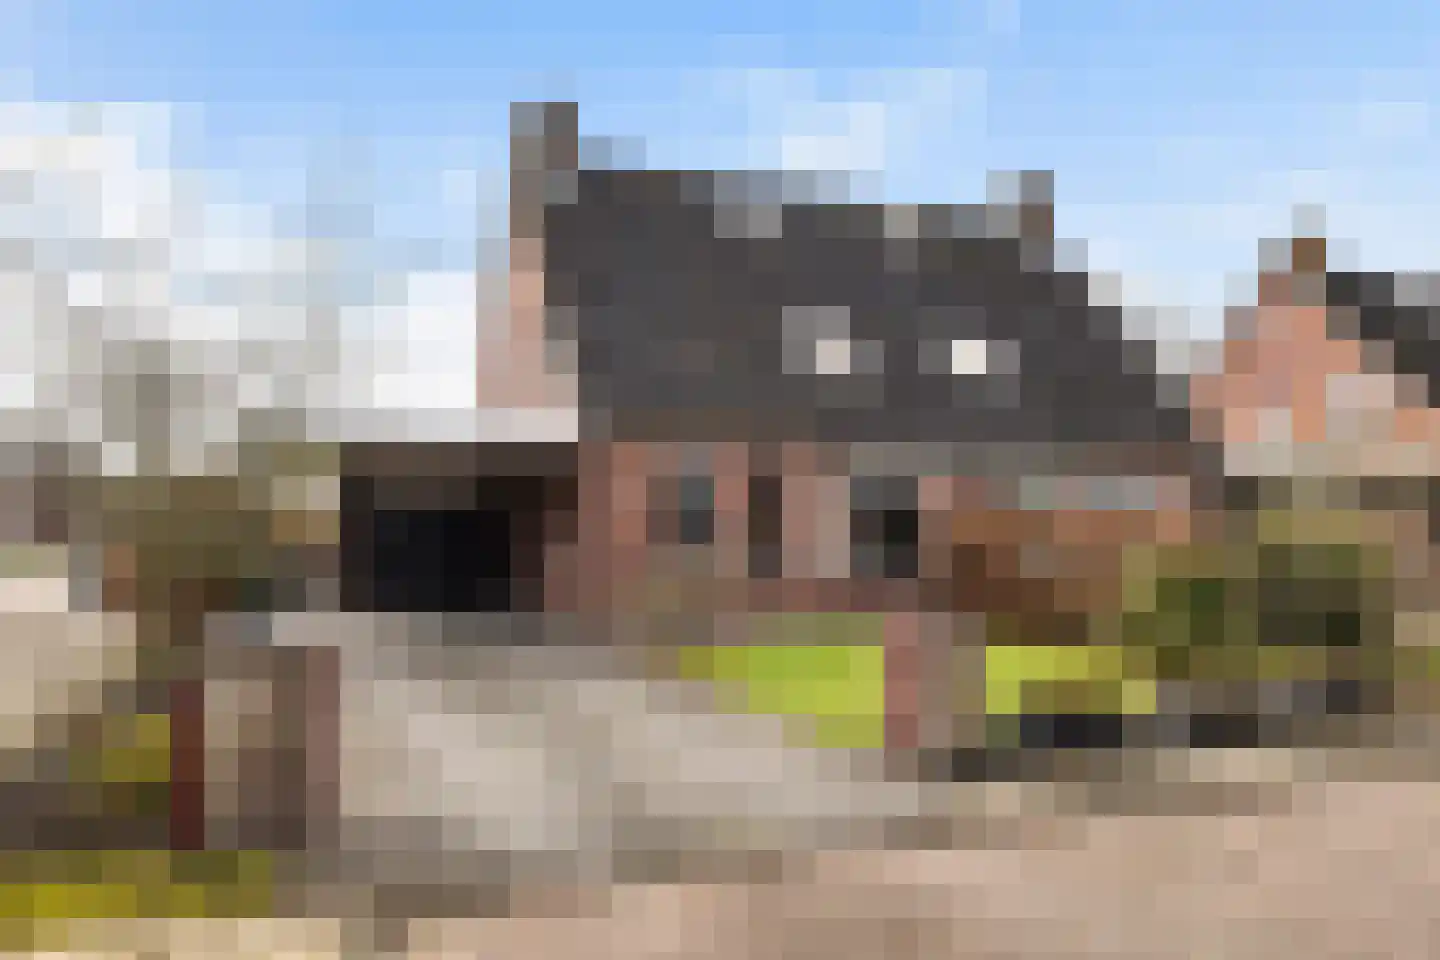
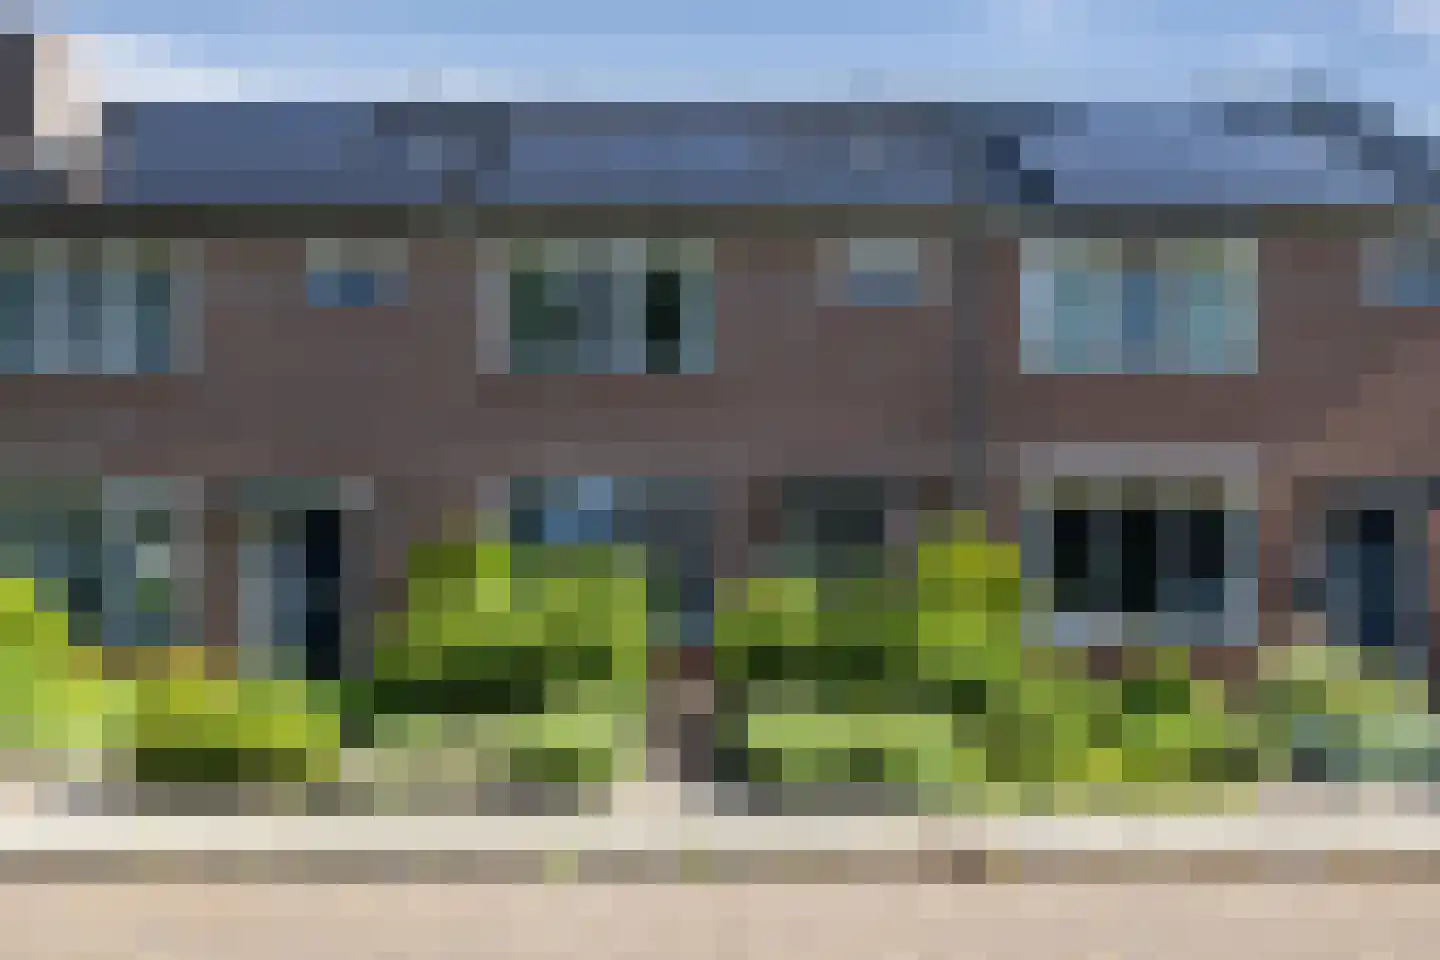
- Available
Uithof 14
7761XJ Schoonebeek
€ 282.000 k.k.
€ 2.186/m²
- Living area
- 129 m²
- Land area
- 156 m²
- Bedrooms
- 4
Searching in 60 houses in Schoonebeek
Type to search. Use arrow down and arrow up to navigate through results and press Enter to open.
Hidden search suggestions.
View current properties in Schoonebeek or search targeted on street, postal code and property characteristics.
View the current housing stock in Schoonebeek and quickly filter by price, living area, rooms and more. There are currently 60 houses in this place within our selection. View also 40 sold houses in Schoonebeek for extra insight into the local housing market.
7761XJ Schoonebeek
€ 282.000 k.k.
€ 2.186/m²
Schoonebeek
€ 245.000 k.k.
€ 1.531/m²
2222AM Schoonebeek
€ 209.000 k.k.
€ 1.866/m²
7761DG Schoonebeek
€ 259.500 k.k.
€ 2.569/m²
7761KA Schoonebeek
€ 399.500 k.k.
€ 3.567/m²
7761BB Schoonebeek
€ 275.000 k.k.
€ 3.198/m²
7761ZA Schoonebeek
€ 550.000 k.k.
€ 3.005/m²
4824AS Schoonebeek
€ 235.000 k.k.
€ 2.026/m²
7761PJ Schoonebeek
€ 1.695.000 k.k.
€ 10.935/m²
7761PT Schoonebeek
€ 995.000 k.k.
€ 4.234/m²
7761XX Schoonebeek
€ 499.500 k.k.
€ 3.493/m²
7761KB Schoonebeek
€ 775.000 k.k.
€ 2.860/m²
7761PC Schoonebeek
€ 395.000 k.k.
€ 1.580/m²
7761PH Schoonebeek
€ 419.500 k.k.
€ 2.243/m²
7761AC Schoonebeek
€ 487.500 k.k.
€ 2.413/m²
7761HC Schoonebeek
€ 539.500 k.k.
7761CP Schoonebeek
€ 475.000 k.k.
7761KE Schoonebeek
€ 350.000 k.k.
€ 2.632/m²
7761PP Schoonebeek
€ 1.495.000 k.k.
€ 4.271/m²
7761KH Schoonebeek
€ 449.500 k.k.
€ 2.470/m²
7761AE Schoonebeek
€ 985.000 k.k.
€ 3.774/m²
7761DT Schoonebeek
€ 260.000 k.k.
€ 2.241/m²
7761XA Schoonebeek
€ 250.000 k.k.
€ 2.273/m²
7761GM Schoonebeek
€ 375.000 k.k.
€ 3.713/m²
7761CJ Schoonebeek
€ 275.000 k.k.
€ 2.350/m²
7761DK Schoonebeek
€ 259.500 k.k.
€ 2.359/m²
7761XL Schoonebeek
€ 279.500 k.k.
€ 2.236/m²
7761AE Schoonebeek
€ 639.500 k.k.
€ 2.642/m²
Get free quotes from real estate agents with local market knowledge. Compare more than 18 real estate agents in Schoonebeek.
Selling a home in Schoonebeek? Compare all real estate agents in Schoonebeek or view the top 10 real estate agents in Schoonebeek for extra context for your choice.
Real estate agents make sharper offers when they know you're comparing — ask for quotes for sale or purchase.
Practical answers about housing supply, sales and comparing real estate agents in Schoonebeek.
The costs of a real estate agent in Schoonebeek depend on commission, setup costs, property presentation and the chosen service. Compare the 18 real estate agents in Schoonebeek via the real estate agent page and request multiple quotes to compare rates and approach well.
Within our selection, we are currently showing 60 houses in Schoonebeek. View also the sold houses in Schoonebeek to compare the current offering with recent transactions.
Take into account not only price and living area but also maintenance, energy label, location, outdoor space and sales status. This way you compare houses in Schoonebeek on more than just the asking price.
A local real estate agent knows the neighborhoods, recent transactions and demand in Schoonebeek. By comparing 18 real estate agents in the region you get a better insight into prices, sales strategy and expected yield; the top 10 in Schoonebeek provides a useful starting point.
Yes, when making a sales plan, a valuation in Schoonebeek is wise. You gain insight into a realistic asking price and can then compare offers from real estate agents specifically.
View current location data on residents, WOZ development, housing stock, energy consumption, business activity and safety in Schoonebeek. In 2026 were there 4.351 residents. The average WOZ value in 2025 is EUR 296.850.
These figures help to better assess and compare the housing stock in Schoonebeek with recent sold homes. Orient yourself then on suitable top real estate agents in Schoonebeek for sales advice in this region.
Residents
4.351
Last year: 2026
Average WOZ
EUR 296.850
Last year: 2025
Average income per person.
EUR 26.801
Source: AllNumbers
Crimes (current year)
96
Total registered
| Year | Residents |
|---|---|
| 2021 | 4.365 |
| 2022 | 4.400 |
| 2023 | 4.385 |
| 2024 | 4.390 |
| 2025 | 4.390 |
| 2026 | 4.351 |
| Year | Average WOZ |
|---|---|
| 2021 | EUR 204.483 |
| 2022 | EUR 227.916 |
| 2023 | EUR 262.957 |
| 2024 | EUR 277.903 |
| 2025 | EUR 296.850 |
Hoger
580
Praktisch
830
Middelbaar
1.570
Europa
255
Nederland
4.000
Buiten Europa
135
Label A
607
Label C
513
Label B
315
Label D
163
Label G
156
Label F
138
Label E
88
Label A+
18
Label A+++
16
Label A++
11
Label A++++
2
Label A+++++
0
| Year | Gas (m3) | Electricity (kWh) |
|---|---|---|
| 2020 | 1.425 | 3.052 |
| 2021 | 1.558 | 3.151 |
| 2022 | 1.215 | 2.990 |
| 2023 | 1.025 | 2.902 |
| 2024 | 990 | 3.081 |
Hoekwoning
Gas: 885 • Electricity: 2.200
Huurwoning
Gas: 799 • Electricity: 2.082
Koopwoning
Gas: 1.096 • Electricity: 3.142
Appartement
Gas: 644 • Electricity: 1.440
Tussenwoning
Gas: 832 • Electricity: 2.066
Vrijstaande woning
Gas: 1.238 • Electricity: 3.572
Twee-onder-één-kap woning
Gas: 945 • Electricity: 2.928
Total number of company establishments: 380
| Period | Crimes |
|---|---|
| jan 2026 | 12 |
| jul 2025 | 6 |
| jun 2025 | 10 |
| mei 2025 | 9 |
| mrt 2025 | 10 |
| mrt 2026 | 6 |
| nov 2024 | 3 |
| nov 2025 | 9 |
| okt 2024 | 4 |
| okt 2025 | 6 |
| sep 2024 | 11 |
| sep 2025 | 6 |
These figures give an indicative picture of safety trends in the living environment of Schoonebeek.
Short answers based on current local statistics, handy for a quick comparison of the living environment.
Schoonebeek telt in 2026 ongeveer 4.351 inwoners.
De gemiddelde WOZ-waarde in Schoonebeek is in 2025 circa € 296.850.
Het gemiddelde inkomen per inwoner in Schoonebeek ligt rond € 26.801 per jaar.
Voor het huidige jaar gaat het om ongeveer 96 geregistreerde misdrijven. Gebruik deze cijfers als indicatie en vergelijk trends per periode.
In Schoonebeek komt vooral "Twee-onder-één-kap woningen" veel voor, met ongeveer 697 woningen.