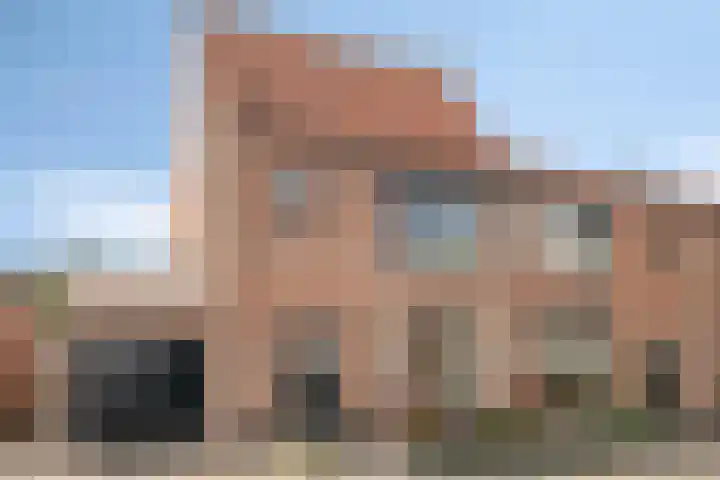
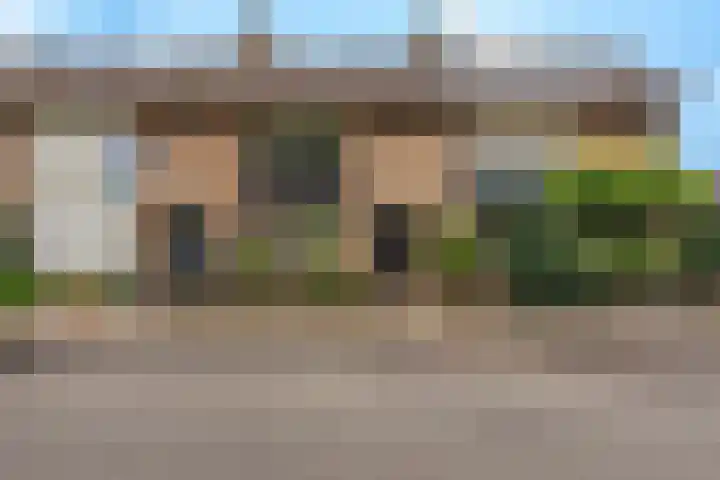
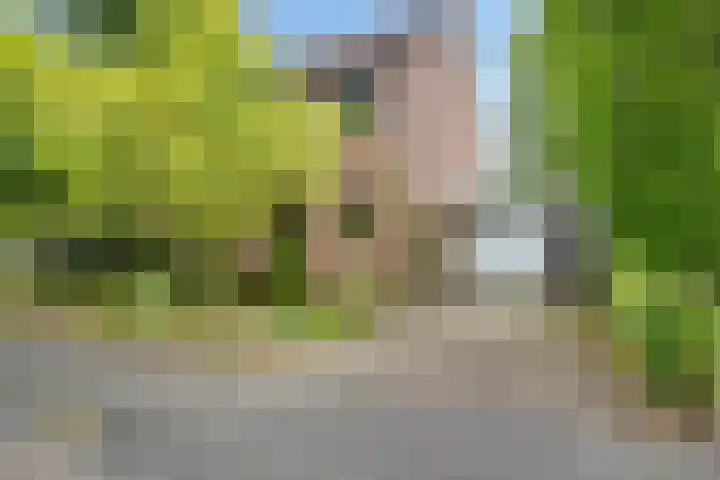
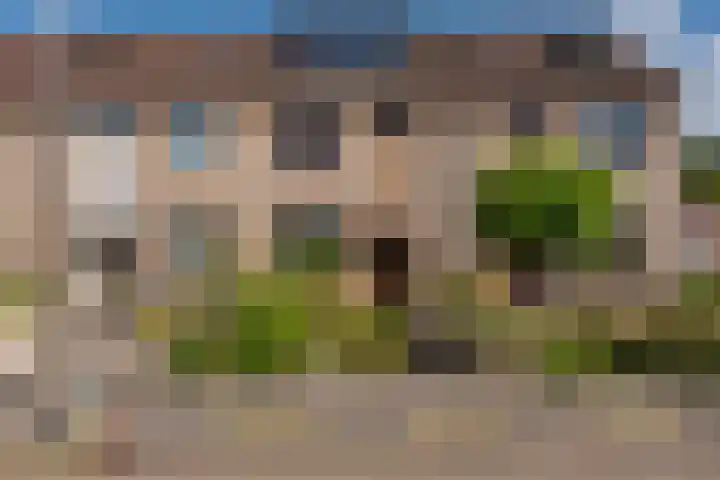
- Sold
Buntgraslaan 26 A
8084RA 't Harde
€ 599.000 k.k.
€ 4.404/m²
- Living area
- 136 m²
- Land area
- 316 m²
- Bedrooms
- 4
View 68 sold houses in 't Harde
Type to search. Use arrow down and arrow up to navigate through results and press Enter to open.
Hidden search suggestions.
Compare sold homes in 't Harde or view the current offering in this location directly.
On this page you will find recently sold homes in 't Harde. Use this overview to better estimate selling prices, popular neighborhoods, and the local housing supply before you choose a real estate agent. Also view the current housing supply with 82 houses in 't Harde.
8084RA 't Harde
€ 599.000 k.k.
€ 4.404/m²
8084PW 't Harde
€ 825.000 k.k.
€ 8.009/m²
8084BK 't Harde
€ 400.000 k.k.
€ 4.347/m²
8084HV 't Harde
€ 395.000 k.k.
€ 3.211/m²
8084VC 't Harde
€ 525.000 k.k.
€ 3.697/m²
8084EH 't Harde
€ 489.000 k.k.
€ 3.569/m²
8084RM 't Harde
€ 675.000 k.k.
€ 4.383/m²
8084BR 't Harde
€ 317.500 k.k.
€ 4.290/m²
8084CD 't Harde
€ 425.000 k.k.
€ 3.863/m²
8084VV 't Harde
€ 334.500 k.k.
€ 3.097/m²
8084VT 't Harde
€ 349.000 k.k.
€ 4.256/m²
8084PL 't Harde
€ 950.000 k.k.
€ 5.219/m²
8084JA 't Harde
€ 675.000 k.k.
€ 2.922/m²
8084GN 't Harde
€ 500.000 k.k.
€ 3.846/m²
8084CW 't Harde
€ 375.000 k.k.
€ 3.125/m²
8084JE 't Harde
€ 589.000 k.k.
€ 6.929/m²
8084HV 't Harde
€ 399.000 k.k.
€ 4.030/m²
8084VS 't Harde
€ 344.500 k.k.
€ 3.377/m²
8084ES 't Harde
€ 379.000 k.k.
€ 0/m²
8084XA 't Harde
€ 339.500 k.k.
€ 0/m²
8084JT 't Harde
€ 450.000 k.k.
€ 3.461/m²
8084JT 't Harde
€ 395.000 k.k.
€ 3.211/m²
8084JT 't Harde
€ 339.500 k.k.
€ 2.901/m²
8084CR 't Harde
€ 310.000 k.k.
€ 4.133/m²
8084PP 't Harde
€ 995.000 k.k.
€ 4.252/m²
8084JH 't Harde
€ 315.000 k.k.
€ 3.888/m²
8084EV 't Harde
€ 359.000 k.k.
€ 4.487/m²
8084VV 't Harde
€ 289.000 k.k.
€ 2.651/m²
Bekijk recente verkopen en ontvang gratis offertes van lokale makelaars. Vergelijk meer dan 16 makelaars in 't Harde.
Selling your own home in 't Harde? Compare real estate agents in 't Harde or view the best real estate agents in 't Harde as a reference for your choice.
Real estate agents make sharper offers when they know you're comparing — ask for quotes for sale or purchase.
Short answers about housing prices, sold homes and comparing real estate agents in 't Harde.
De kosten van een makelaar in 't Harde verschillen per kantoor, woningtype en verkoopaanpak. In 't Harde kun je 16 real estate agents vergelijken; bekijk daarom ook de makelaars in 't Harde om tarieven, presentatie en lokale ervaring beter naast elkaar te zetten.
On this page we currently show 68 sold houses in 't Harde from our selection. This helps you to better assess recent transactions and the local housing market.
Houses sold in 't Harde give insight into asking prices, house types and neighborhoods where recent transactions have taken place. Compare this also with the current housing stock in 't Harde to better understand the market.
You can use sold homes as a first market indication, but a local real estate agent can better take into account finishing, location, maintenance and current demand in 't Harde.
Vergelijk de 16 real estate agents in 't Harde op lokale verkoopervaring, reviews, verwachte opbrengst, courtage en marketingaanpak. Bekijk verkoopmakelaars in 't Harde of de top 10 makelaars in 't Harde om snel sterke kantoren te ontdekken.
View current location data on residents, WOZ development, housing stock, energy consumption, business activity and safety in 't Harde. In 2026 were there 7.079 residents. The average WOZ value in 2025 is EUR 386.000.
These figures help to better assess and compare the housing stock in 't Harde with recent sold homes. Orient yourself then on suitable top real estate agents in 't Harde for sales advice in this region.
Residents
7.079
Last year: 2026
Average WOZ
EUR 386.000
Last year: 2025
Average income per person.
EUR 30.500
Source: AllNumbers
Crimes (current year)
185
Total registered
| Year | Residents |
|---|---|
| 2021 | 6.890 |
| 2022 | 6.975 |
| 2023 | 7.040 |
| 2024 | 7.000 |
| 2025 | 6.985 |
| 2026 | 7.079 |
| Year | Average WOZ |
|---|---|
| 2021 | EUR 275.000 |
| 2022 | EUR 295.000 |
| 2023 | EUR 339.000 |
| 2024 | EUR 356.000 |
| 2025 | EUR 386.000 |
Hoger
1.130
Praktisch
1.550
Middelbaar
2.290
Europa
175
Nederland
6.430
Buiten Europa
375
Label A
782
Label C
650
Label D
433
Label B
340
Label F
237
Label E
220
Label G
150
Label A+++
58
Label A+
48
Label A++
32
Label A++++
5
Label A+++++
1
| Year | Gas (m3) | Electricity (kWh) |
|---|---|---|
| 2020 | 1.320 | 2.910 |
| 2021 | 1.500 | 2.990 |
| 2022 | 1.160 | 2.870 |
| 2023 | 970 | 2.730 |
| 2024 | 930 | 2.830 |
Hoekwoning
Gas: 940 • Electricity: 2.610
Huurwoning
Gas: 750 • Electricity: 1.940
Koopwoning
Gas: 1.070 • Electricity: 3.110
Appartement
Gas: 640 • Electricity: 1.690
Tussenwoning
Gas: 830 • Electricity: 2.360
Vrijstaande woning
Gas: 1.450 • Electricity: 3.940
Twee-onder-één-kap woning
Gas: 970 • Electricity: 3.010
Total number of company establishments: 745
| Period | Crimes |
|---|---|
| jan 2026 | 11 |
| jul 2025 | 14 |
| jun 2025 | 7 |
| mei 2025 | 22 |
| mrt 2025 | 12 |
| mrt 2026 | 13 |
| nov 2024 | 16 |
| nov 2025 | 14 |
| okt 2024 | 17 |
| okt 2025 | 16 |
| sep 2024 | 10 |
| sep 2025 | 14 |
These figures give an indicative picture of safety trends in the living environment of 't Harde.
Short answers based on current local statistics, handy for a quick comparison of the living environment.
't Harde telt in 2026 ongeveer 7.079 inwoners.
De gemiddelde WOZ-waarde in 't Harde is in 2025 circa € 386.000.
Het gemiddelde inkomen per inwoner in 't Harde ligt rond € 30.500 per jaar.
Voor het huidige jaar gaat het om ongeveer 185 geregistreerde misdrijven. Gebruik deze cijfers als indicatie en vergelijk trends per periode.
In 't Harde komt vooral "Tussenwoningen" veel voor, met ongeveer 1.021 woningen.