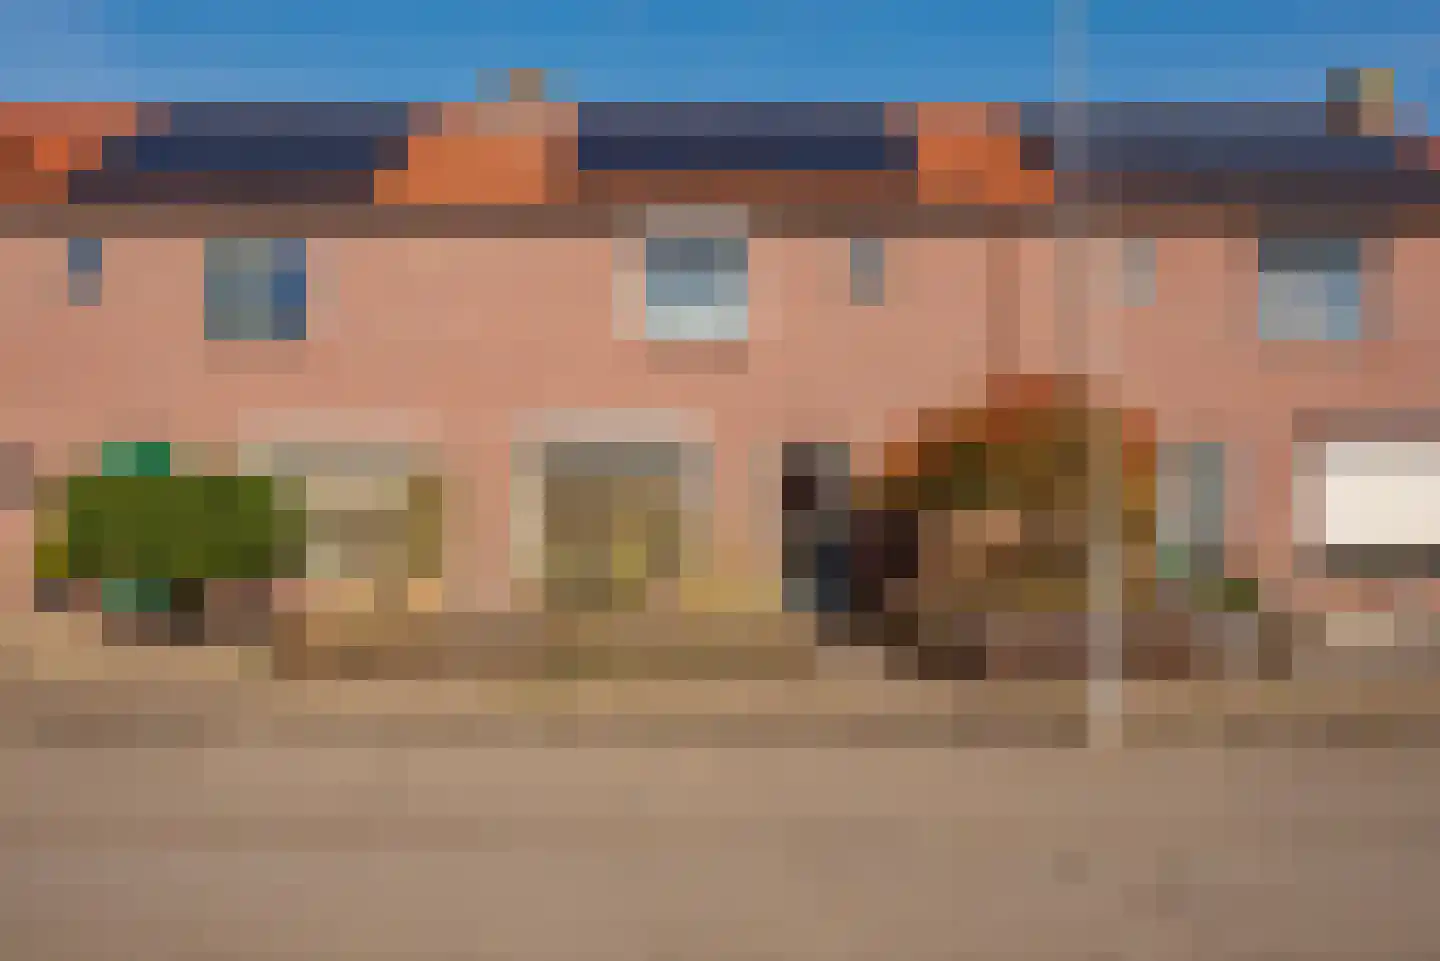
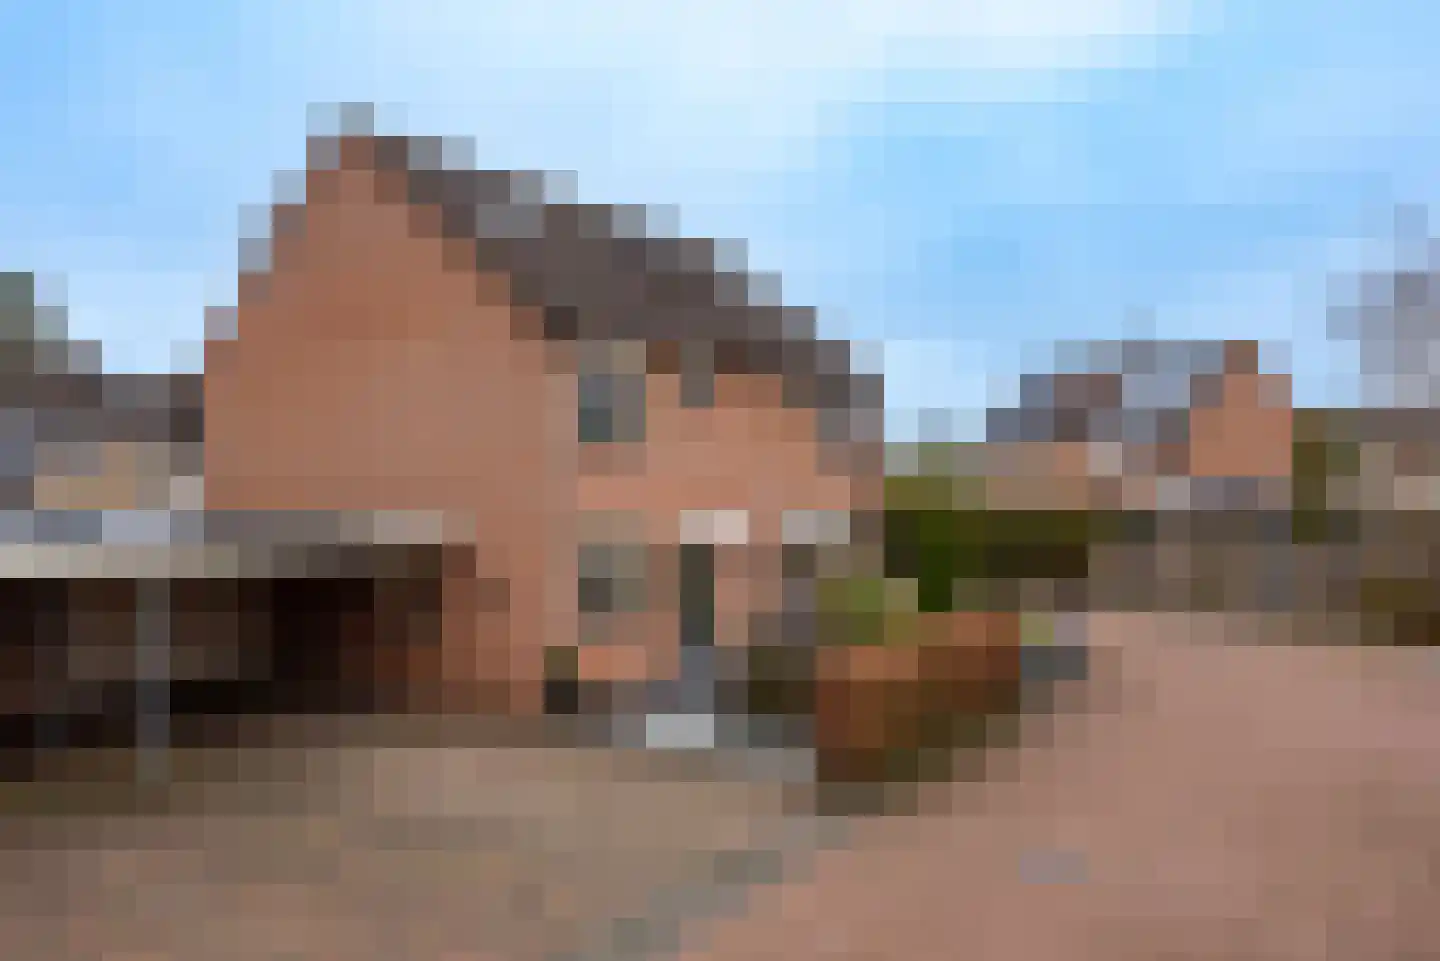
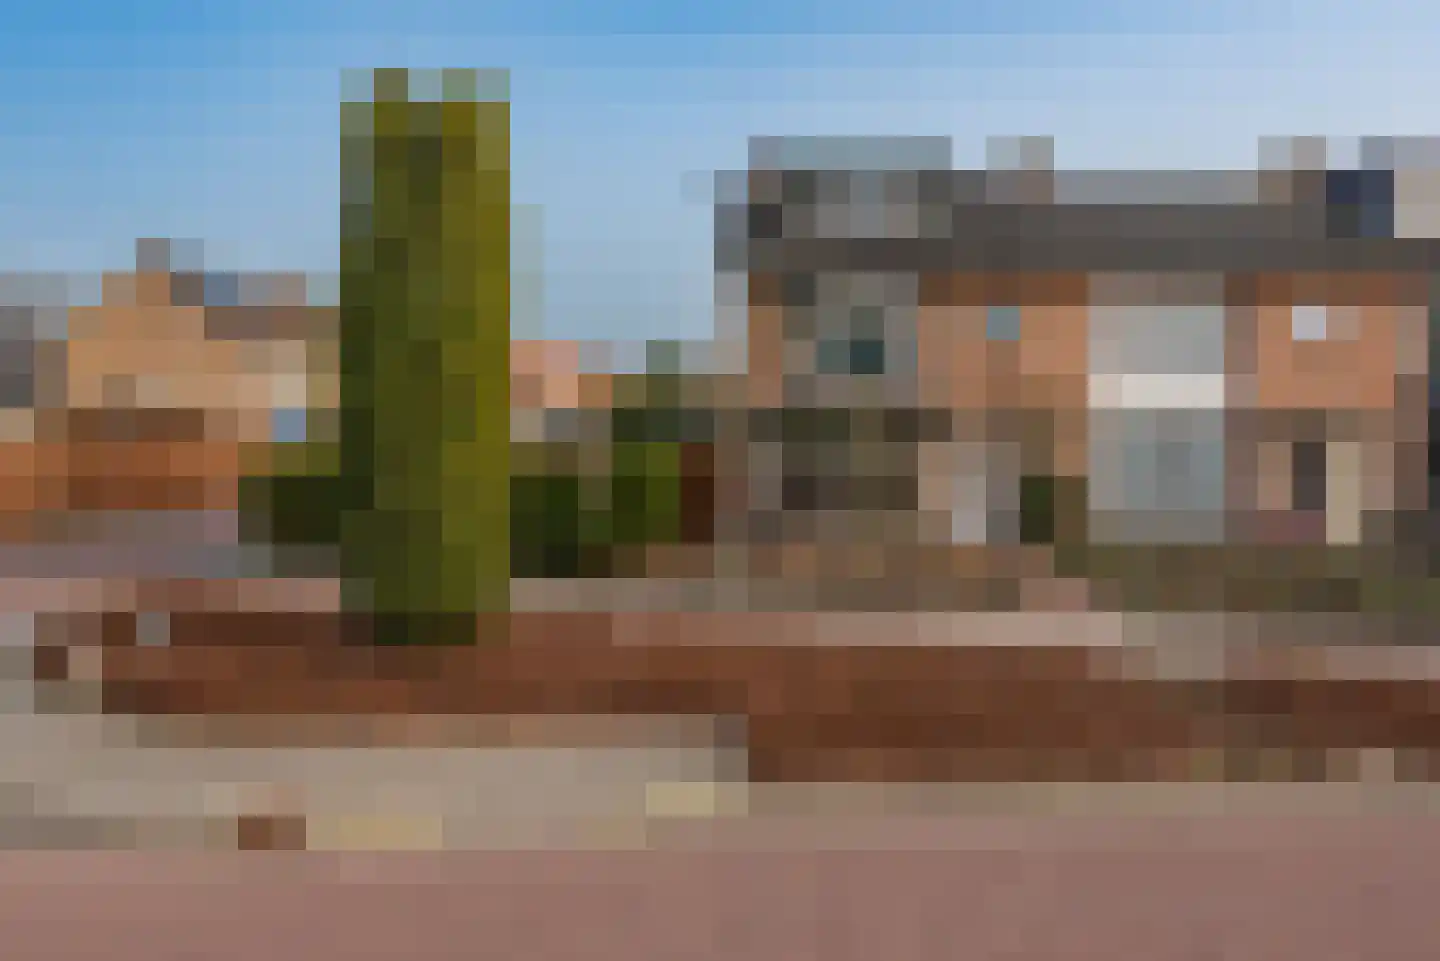
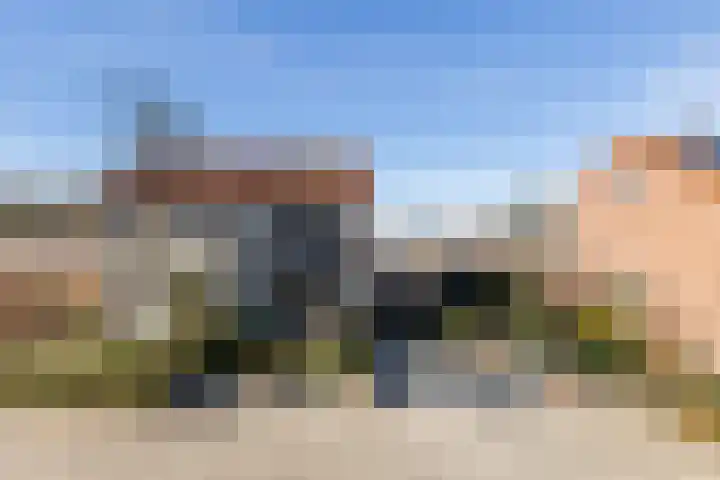
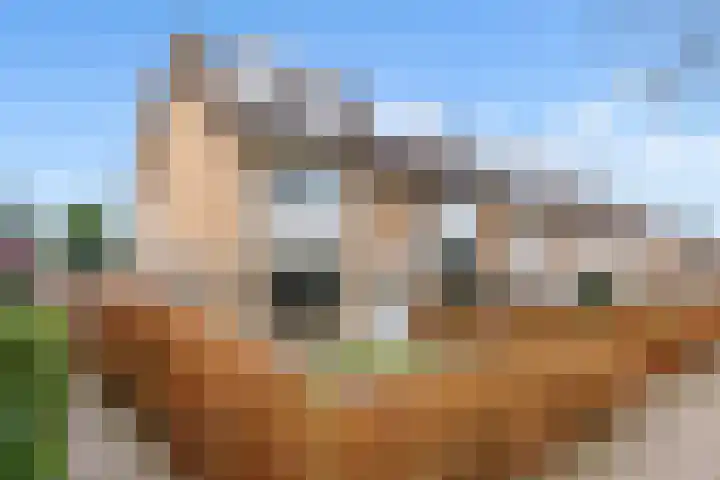
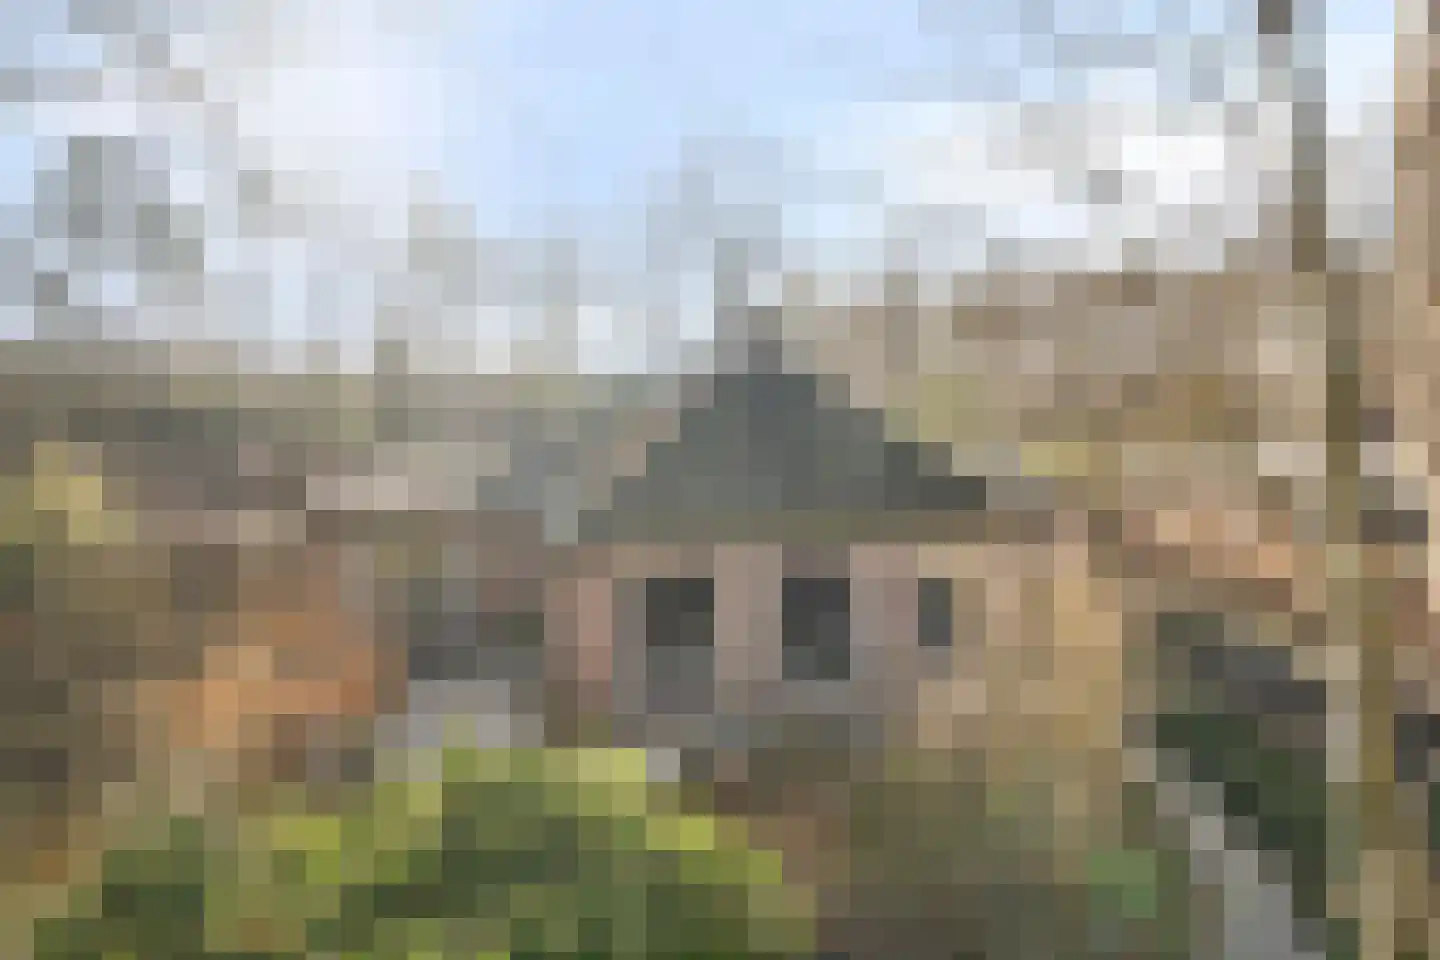
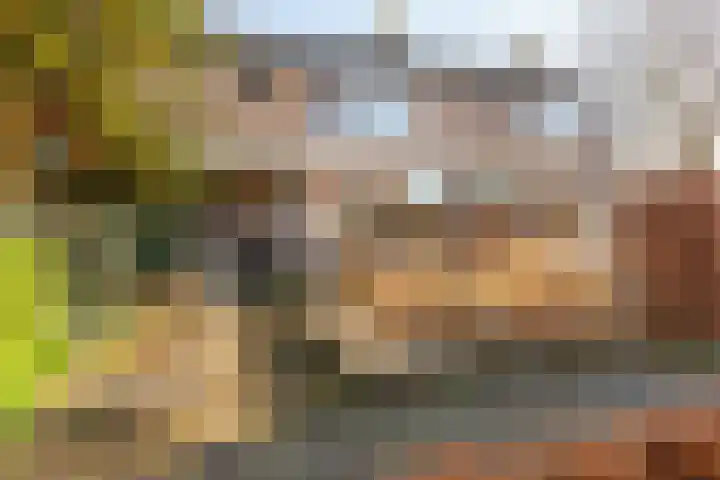
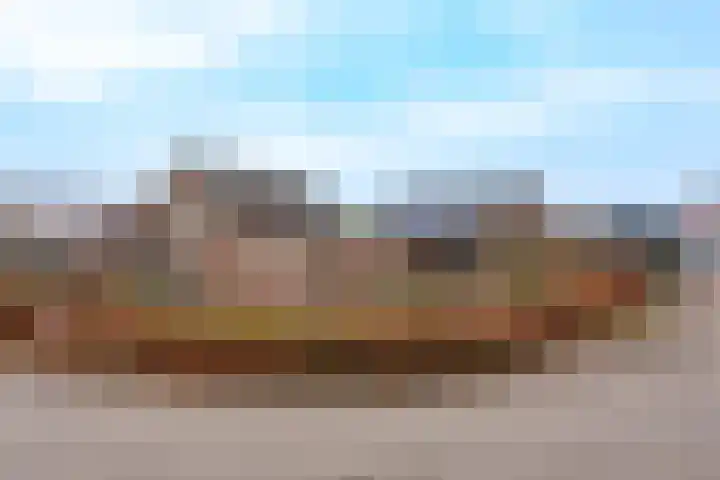
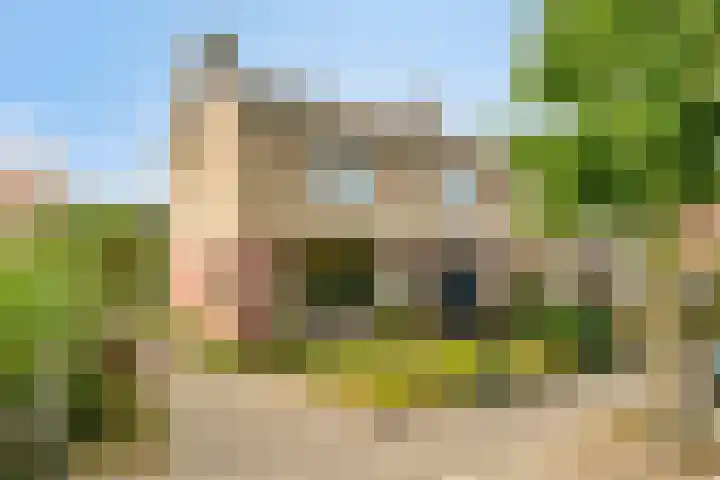
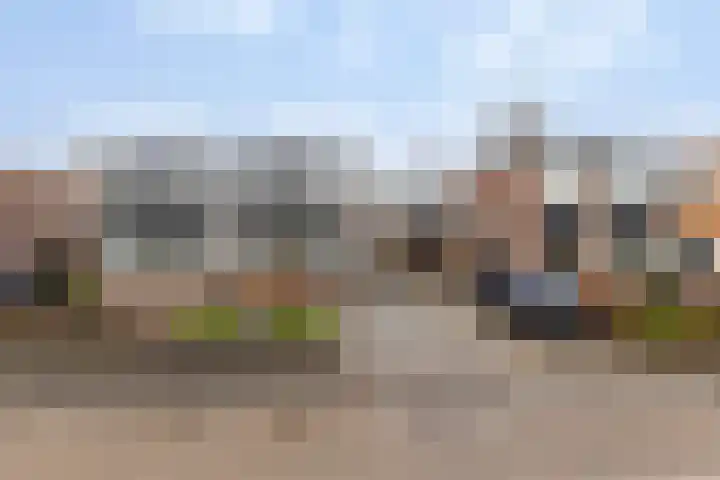
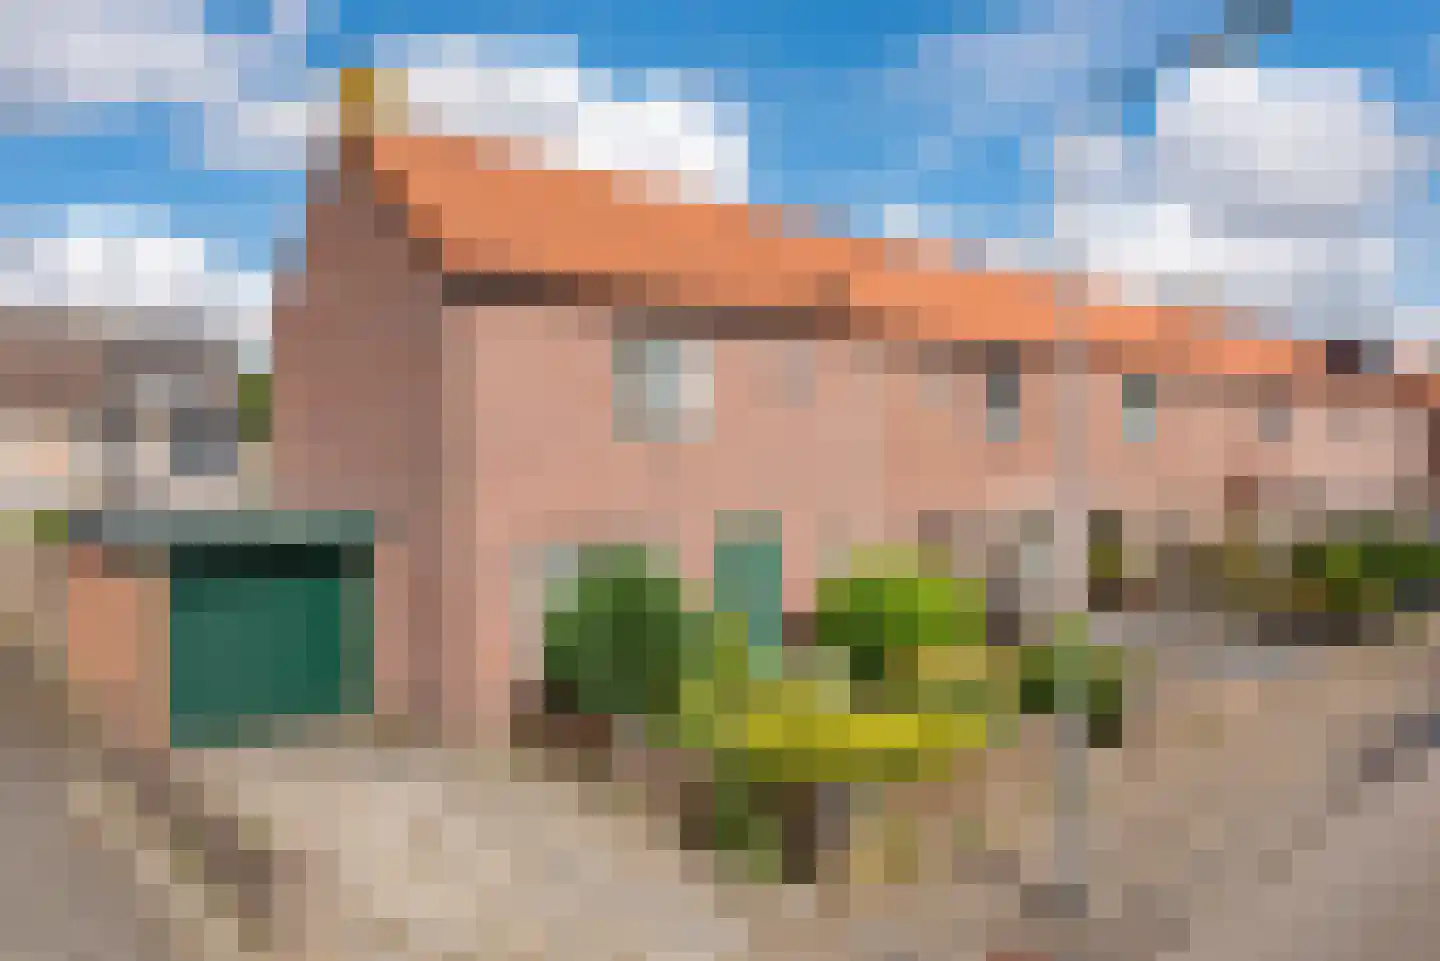
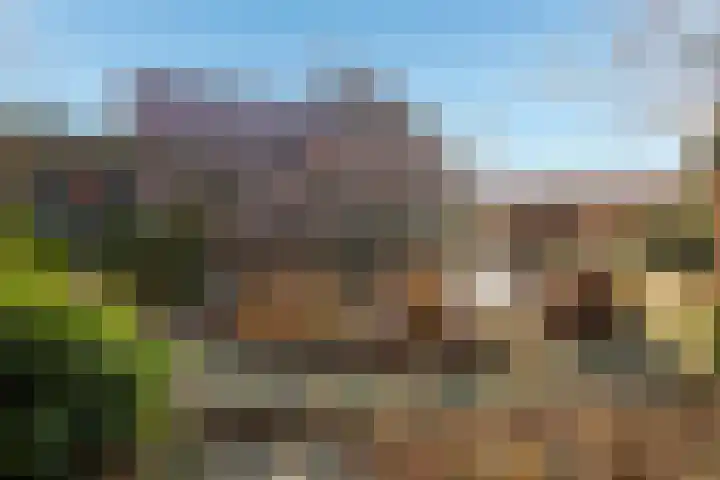
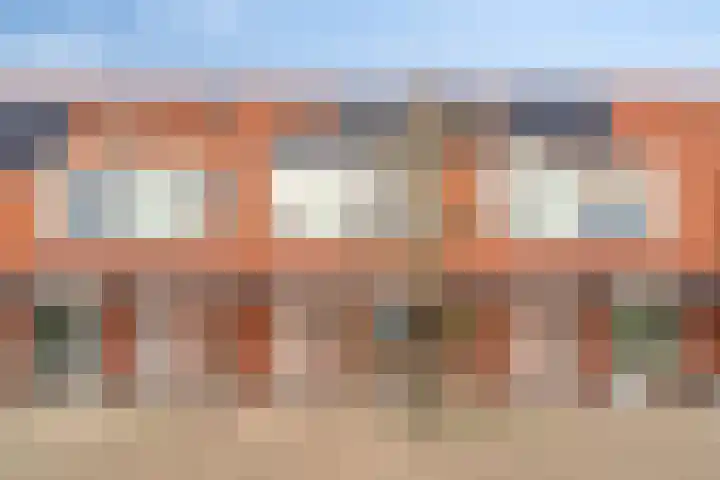
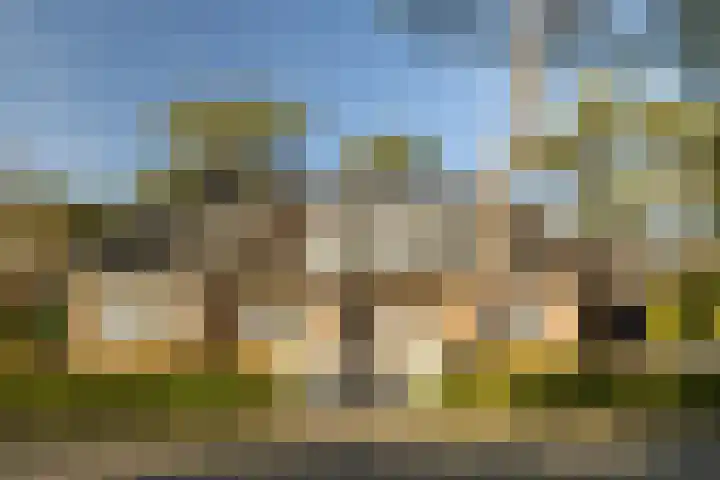
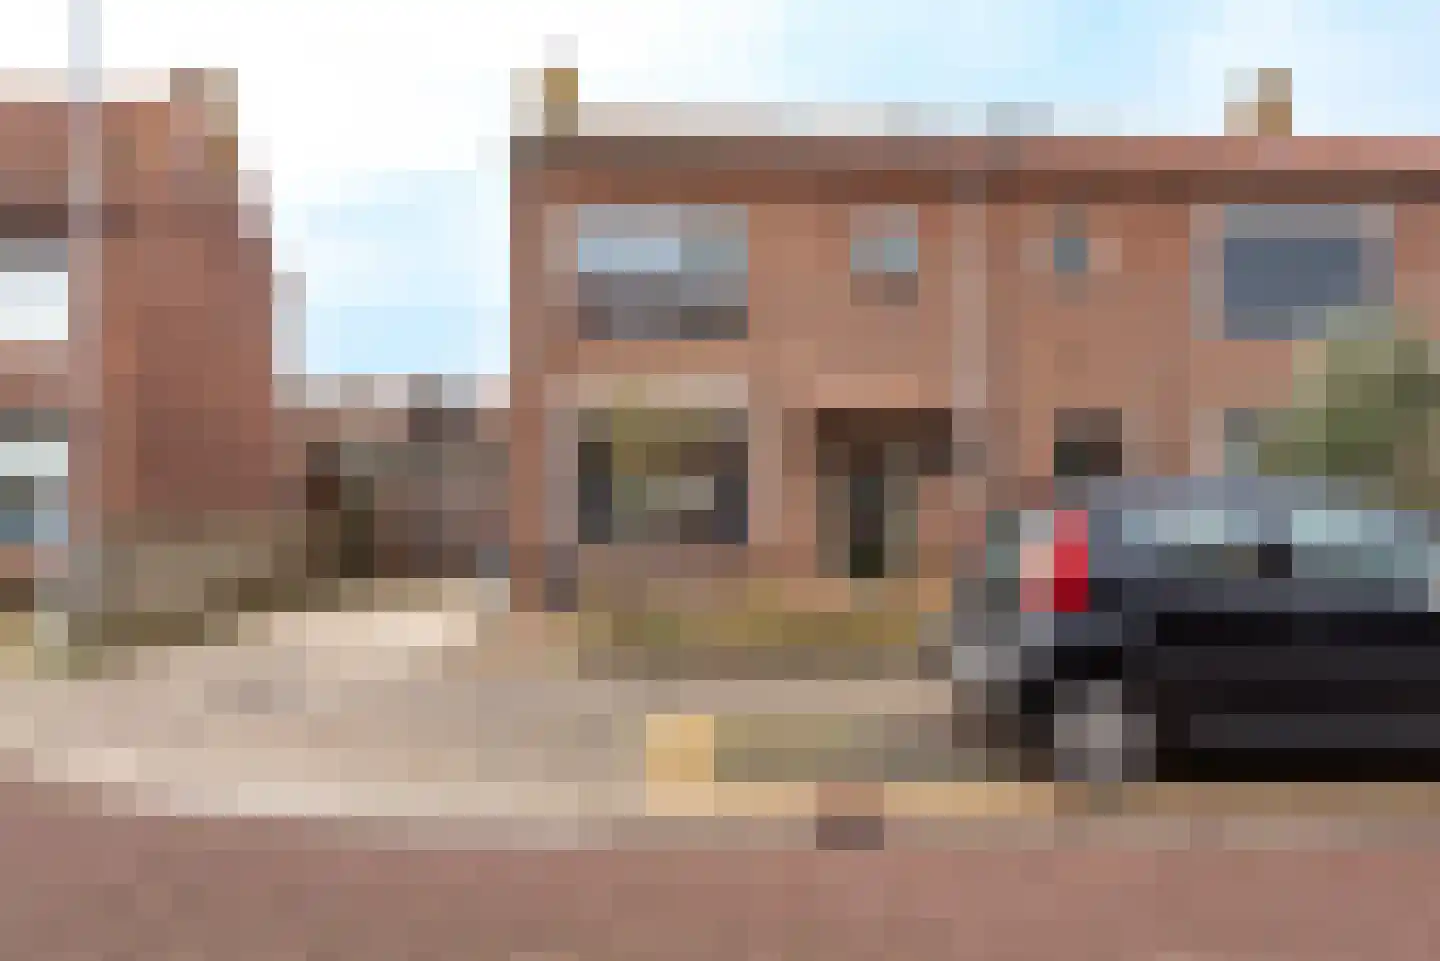
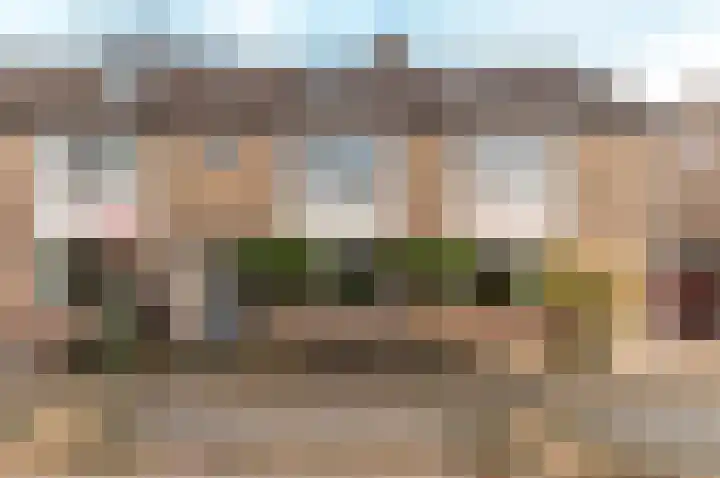
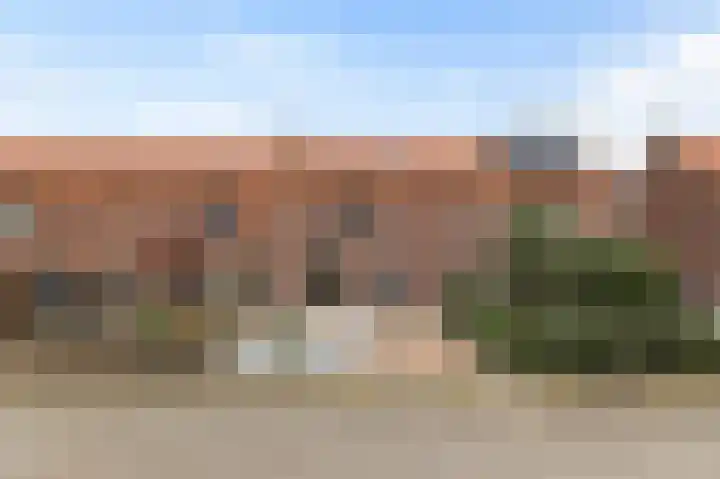
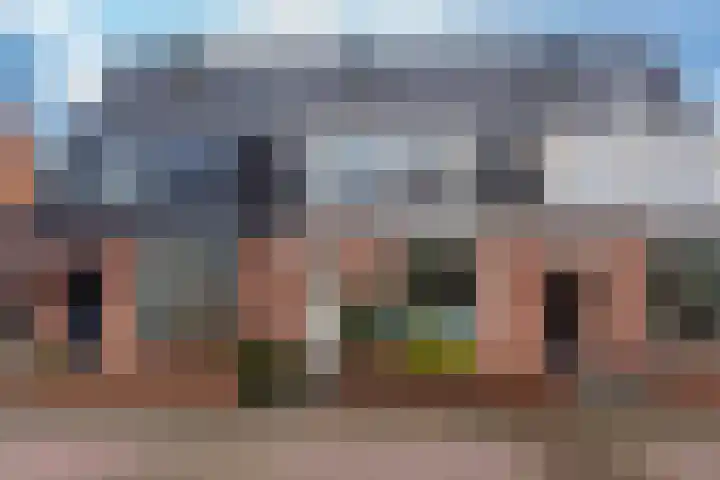
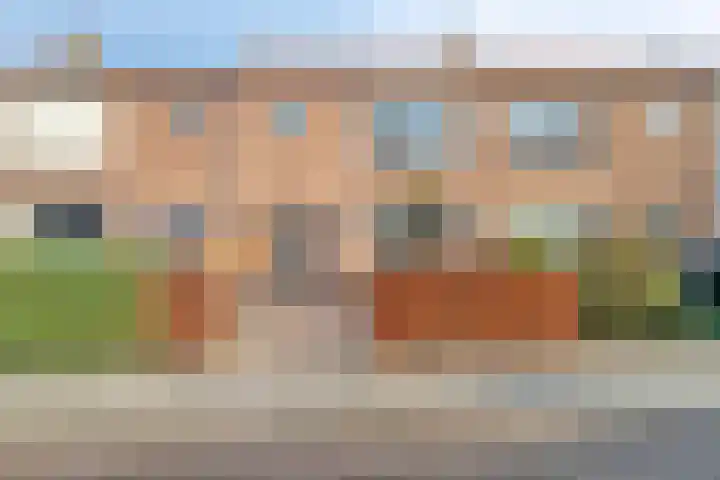
Houses sold in 't Harde

View 68 sold houses in 't Harde

Connected to: Vastgoed Nederland NVM Makelaars

On this page you will find recently sold homes in 't Harde. Use this overview to better estimate selling prices, popular neighborhoods, and the local housing supply before you choose a real estate agent. Also view the current housing supply with 82 houses in 't Harde.

Selection

Search and filter homes

Set your preferences and discover homes that suit you.

Total supply 242.695
Filters

Set price, area and other characteristics. Adjust a filter or click on Show homes. Location changes directly above.

Reset filters

You search for

  • Place 't Harde
  • Status Sold

Sell your house in 't Harde? Compare real estate agents

Bekijk recente verkopen en ontvang gratis offertes van lokale makelaars. Vergelijk meer dan 16 makelaars in 't Harde.

Free request a quote

  • Quotes in 't Harde
  • Non-binding
  • Personal
  • Compare free rates

Selling your own home in 't Harde? Compare real estate agents in 't Harde or view the best real estate agents in 't Harde as a reference for your choice.

Compare multiple quotes

Real estate agents make sharper offers when they know you're comparing — ask for quotes for sale or purchase.

Frequently asked questions about sold homes in 't Harde

Short answers about housing prices, sold homes and comparing real estate agents in 't Harde.

Residential and neighborhood statistics in 't Harde

View current location data on residents, WOZ development, housing stock, energy consumption, business activity and safety in 't Harde. In 2026 were there 7.079 residents. The average WOZ value in 2025 is EUR 386.000.

These figures help to better assess and compare the housing stock in 't Harde with recent sold homes. Orient yourself then on suitable top real estate agents in 't Harde for sales advice in this region.

Residents

7.079

Last year: 2026

Average WOZ

EUR 386.000

Last year: 2025

Average income per person.

EUR 30.500

Source: AllNumbers

Crimes (current year)

185

Total registered

Demographics and WOZ development

Inhabitants per year

Inhabitants per year in 't Harde
Year Residents
2021 6.890
2022 6.975
2023 7.040
2024 7.000
2025 6.985
2026 7.079

Annual WOZ value

WOZ value per year in 't Harde
Year Average WOZ
2021 EUR 275.000
2022 EUR 295.000
2023 EUR 339.000
2024 EUR 356.000
2025 EUR 386.000

Composition of residents

Age build-up

65+: 1.655 0-15: 1.230 15-25: 820 25-45: 1.660 45-65: 1.720

Education level

Hoger

1.130

Praktisch

1.550

Middelbaar

2.290

Origin of residents (2025)

Europa

175

Nederland

6.430

Buiten Europa

375

Housing stock and construction periods

Types of homes

Hoekwoningen 584
Appartementen 381
Tussenwoningen 1.021
Vrijstaande woningen 601
Twee-onder-één-kap woningen 421

Construction period of buildings

Voor 1700 2
1700 tot 1900 45
1900 tot 1925 32
1925 tot 1950 97
1950 tot 1970 1.349
1970 tot 1980 614
1980 tot 1990 196
1990 tot 2000 258
2000 tot 2010 248
2010 tot 2020 185
2020 en later 82

Energy and sustainability

Energy label distribution

Label A

782

Label C

650

Label D

433

Label B

340

Label F

237

Label E

220

Label G

150

Label A+++

58

Label A+

48

Label A++

32

Label A++++

5

Label A+++++

1

Average energy consumption per year

Average energy consumption per year in 't Harde
Year Gas (m3) Electricity (kWh)
2020 1.320 2.910
2021 1.500 2.990
2022 1.160 2.870
2023 970 2.730
2024 930 2.830

Consumption per house type

Hoekwoning

Gas: 940 • Electricity: 2.610

Huurwoning

Gas: 750 • Electricity: 1.940

Koopwoning

Gas: 1.070 • Electricity: 3.110

Appartement

Gas: 640 • Electricity: 1.690

Tussenwoning

Gas: 830 • Electricity: 2.360

Vrijstaande woning

Gas: 1.450 • Electricity: 3.940

Twee-onder-één-kap woning

Gas: 970 • Electricity: 3.010

Business activity in 't Harde (2025)

Handel en HORECA 125
Nijverheid en energie 150
Zakelijke dienstverlening 170
Overheid, onderwijs en zorg 120
Landbouw, bosbouw en visserij 40
Vervoer, informatie en communicatie 50
Financiele diensten en onroerendgoed 20
Cultuur, recreatie en overige diensten 70

Total number of company establishments: 745

Recent crime statistics

Recent crime statistics in 't Harde
Period Crimes
jan 2026 11
jul 2025 14
jun 2025 7
mei 2025 22
mrt 2025 12
mrt 2026 13
nov 2024 16
nov 2025 14
okt 2024 17
okt 2025 16
sep 2024 10
sep 2025 14

These figures give an indicative picture of safety trends in the living environment of 't Harde.

Frequently asked questions about living in 't Harde

Short answers based on current local statistics, handy for a quick comparison of the living environment.

Hoeveel inwoners heeft 't Harde?

't Harde telt in 2026 ongeveer 7.079 inwoners.

Wat is de gemiddelde WOZ-waarde in 't Harde?

De gemiddelde WOZ-waarde in 't Harde is in 2025 circa € 386.000.

Wat is het gemiddelde inkomen per inwoner in 't Harde?

Het gemiddelde inkomen per inwoner in 't Harde ligt rond € 30.500 per jaar.

Hoe veilig is wonen in 't Harde?

Voor het huidige jaar gaat het om ongeveer 185 geregistreerde misdrijven. Gebruik deze cijfers als indicatie en vergelijk trends per periode.

Welke woningtypen komen het meest voor in 't Harde?

In 't Harde komt vooral "Tussenwoningen" veel voor, met ongeveer 1.021 woningen.

Receive free, non-binding quotes

Compare multiple real estate agents and choose the best match.