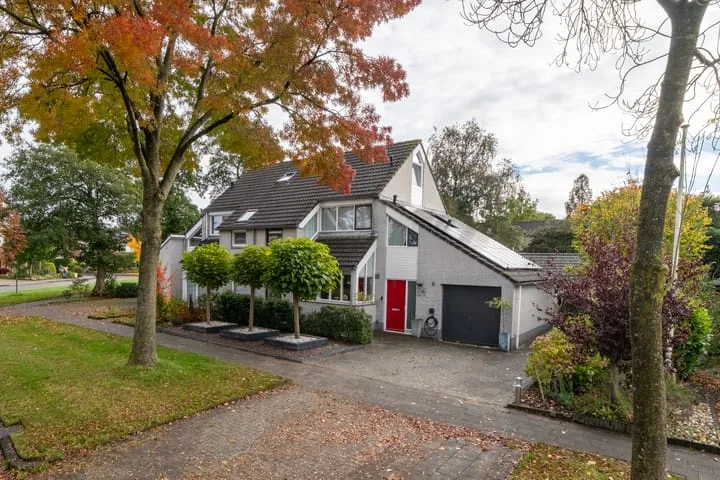
- Sold
Waterman 18
9356DA Tolbert
€ 475.000 k.k.
€ 3.861/m²
- Living area
- 123 m²
- Land area
- 427 m²
- Bedrooms
- 4
Searching in 50 houses in Tolbert
Type to search. Use arrow down and arrow up to navigate through results and press Enter to open.
Hidden search suggestions.
View current properties in Tolbert or search targeted on street, postal code and property characteristics.
View the current housing stock in Tolbert and quickly filter by price, living area, rooms and more. There are currently 50 houses in this place within our selection. View also 38 sold houses in Tolbert for extra insight into the local housing market.
9356DA Tolbert
€ 475.000 k.k.
€ 3.861/m²
9356HE Tolbert
€ 369.000 k.k.
€ 3.208/m²
9356EK Tolbert
€ 349.000 k.k.
€ 2.982/m²
9356HD Tolbert
€ 525.000 k.k.
€ 3.977/m²
9356AD Tolbert
€ 369.000 k.k.
€ 2.928/m²
9356DK Tolbert
€ 485.000 k.k.
€ 3.415/m²
9356ES Tolbert
€ 395.000 k.k.
€ 3.558/m²
9356CP Tolbert
€ 389.500 k.k.
€ 3.042/m²
9356VA Tolbert
€ 549.000 k.k.
€ 4.575/m²
9356CM Tolbert
€ 325.000 k.k.
€ 3.282/m²
9356DJ Tolbert
€ 460.000 k.k.
€ 2.754/m²
9356TB Tolbert
€ 925.000 k.k.
€ 2.974/m²
9356EG Tolbert
€ 315.000 k.k.
€ 2.971/m²
9356BL Tolbert
€ 315.000 k.k.
€ 2.480/m²
9356CD Tolbert
€ 345.000 k.k.
€ 0/m²
9356AD Tolbert
€ 375.000 k.k.
€ 0/m²
9356BK Tolbert
€ 425.000 k.k.
€ 0/m²
9356ED Tolbert
€ 349.000 k.k.
€ 3.008/m²
9356BS Tolbert
€ 449.000 k.k.
€ 2.973/m²
9356VB Tolbert
€ 539.500 k.k.
€ 3.250/m²
9356TB Tolbert
€ 379.000 k.k.
€ 3.907/m²
9356DC Tolbert
Price upon request
Get free quotes from real estate agents with local market knowledge. Compare more than 23 real estate agents in Tolbert.
Selling a home in Tolbert? Compare all real estate agents in Tolbert or view the top 10 real estate agents in Tolbert for extra context for your choice.
Real estate agents make sharper offers when they know you're comparing — ask for quotes for sale or purchase.
Practical answers about housing supply, sales and comparing real estate agents in Tolbert.
The costs of a real estate agent in Tolbert depend on commission, setup costs, property presentation and the chosen service. Compare the 23 real estate agents in Tolbert via the real estate agent page and request multiple quotes to compare rates and approach well.
Within our selection, we are currently showing 50 houses in Tolbert. View also the sold houses in Tolbert to compare the current offering with recent transactions.
Take into account not only price and living area but also maintenance, energy label, location, outdoor space and sales status. This way you compare houses in Tolbert on more than just the asking price.
A local real estate agent knows the neighborhoods, recent transactions and demand in Tolbert. By comparing 23 real estate agents in the region you get a better insight into prices, sales strategy and expected yield; the top 10 in Tolbert provides a useful starting point.
Yes, when making a sales plan, a valuation in Tolbert is wise. You gain insight into a realistic asking price and can then compare offers from real estate agents specifically.
View current location data on residents, WOZ development, housing stock, energy consumption, business activity and safety in Tolbert. In 2025 were there 4.243 residents. The average WOZ value in 2025 is EUR 286.563.
These figures help to better assess and compare the housing stock in Tolbert with recent sold homes. Orient yourself then on suitable top real estate agents in Tolbert for sales advice in this region.
Residents
4.243
Last year: 2025
Average WOZ
EUR 286.563
Last year: 2025
Average income per person.
EUR 213
Source: AllNumbers
Crimes (current year)
86
Total registered
| Year | Residents |
|---|---|
| 2021 | 4.262 |
| 2022 | 4.239 |
| 2023 | 4.251 |
| 2024 | 4.225 |
| 2025 | 4.243 |
| Year | Average WOZ |
|---|---|
| 2021 | EUR 209.388 |
| 2022 | EUR 229.315 |
| 2023 | EUR 264.448 |
| 2024 | EUR 260.463 |
| 2025 | EUR 286.563 |
Hoger
872
Praktisch
721
Middelbaar
1.551
Europa
141
Nederland
3.746
Buiten Europa
354
Label C
692
Label B
469
Label A
354
Label G
132
Label A++
119
Label D
113
Label A+
87
Label F
79
Label A+++
70
Label E
29
Label A++++
2
Label A+++++
0
| Year | Gas (m3) | Electricity (kWh) |
|---|---|---|
| 2020 | 1.331 | 2.691 |
| 2021 | 1.446 | 2.717 |
| 2022 | 1.136 | 2.505 |
| 2023 | 934 | 2.413 |
| 2024 | 874 | 2.508 |
Hoekwoning
Gas: 898 • Electricity: 2.112
Huurwoning
Gas: 801 • Electricity: 1.811
Koopwoning
Gas: 992 • Electricity: 2.720
Appartement
Gas: 565 • Electricity: 1.608
Tussenwoning
Gas: 838 • Electricity: 2.004
Vrijstaande woning
Gas: 1.189 • Electricity: 3.094
Twee-onder-één-kap woning
Gas: 941 • Electricity: 2.647
Total number of company establishments: 482
| Period | Crimes |
|---|---|
| jan 2025 | 4 |
| jan 2026 | 8 |
| jul 2025 | 6 |
| jun 2025 | 20 |
| mei 2025 | 7 |
| mrt 2025 | 4 |
| nov 2024 | 5 |
| nov 2025 | 2 |
| okt 2024 | 7 |
| okt 2025 | 6 |
| sep 2024 | 7 |
| sep 2025 | 13 |
These figures give an indicative picture of safety trends in the living environment of Tolbert.
Short answers based on current local statistics, handy for a quick comparison of the living environment.
Tolbert telt in 2025 ongeveer 4.243 inwoners.
De gemiddelde WOZ-waarde in Tolbert is in 2025 circa € 286.563.
Het gemiddelde inkomen per inwoner in Tolbert ligt rond € 213 per jaar.
Voor het huidige jaar gaat het om ongeveer 86 geregistreerde misdrijven. Gebruik deze cijfers als indicatie en vergelijk trends per periode.
In Tolbert komt vooral "Vrijstaande woningen" veel voor, met ongeveer 556 woningen.