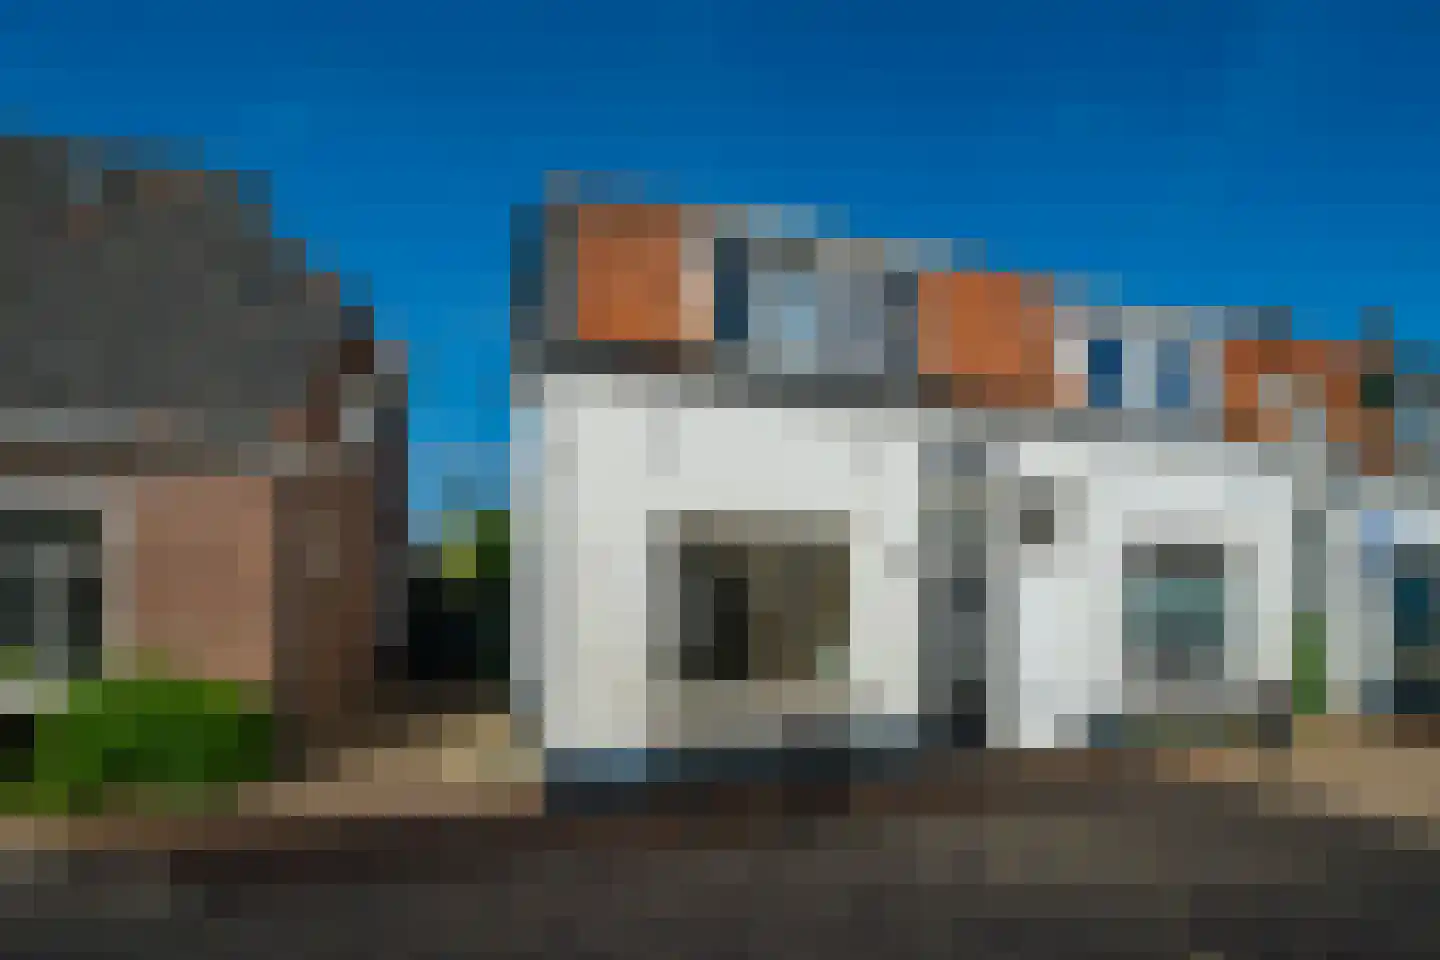
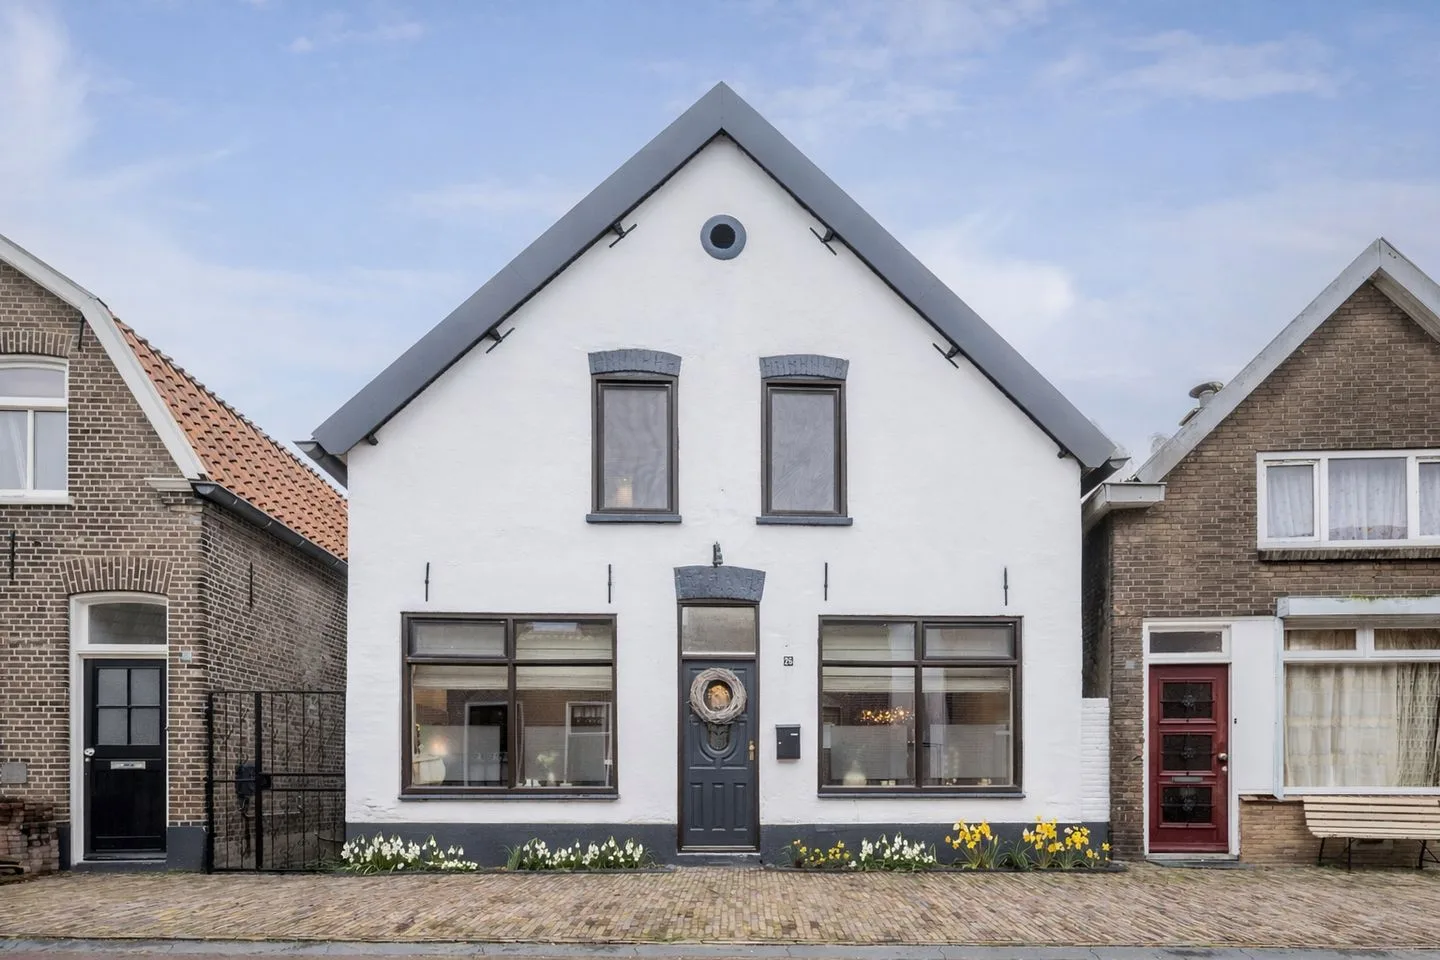
- Available
Hoofdstraat 59 A
6916AB Tolkamer
€ 598.500 k.k.
€ 3.990/m²
- Living area
- 150 m²
- Land area
- —
- Bedrooms
- 4
Searching in 33 houses in Tolkamer
Type to search. Use arrow down and arrow up to navigate through results and press Enter to open.
Hidden search suggestions.
View current properties in Tolkamer or search targeted on street, postal code and property characteristics.
View the current housing stock in Tolkamer and quickly filter by price, living area, rooms and more. There are currently 33 houses in this place within our selection. View also 19 sold houses in Tolkamer for extra insight into the local housing market.
6916AB Tolkamer
€ 598.500 k.k.
€ 3.990/m²
6916BC Tolkamer
€ 525.000 k.k.
€ 4.907/m²
6916AV Tolkamer
€ 175.000 k.k.
€ 3.646/m²
6916LL Tolkamer
€ 749.000 k.k.
€ 4.741/m²
6916BL Tolkamer
€ 365.000 k.k.
€ 3.650/m²
6916LG Tolkamer
€ 349.000 k.k.
€ 3.674/m²
6916BX Tolkamer
€ 475.000 k.k.
6916MB Tolkamer
€ 509.000 k.k.
€ 3.305/m²
6916BD Tolkamer
€ 422.500 k.k.
€ 2.874/m²
6916AV Tolkamer
€ 425.000 k.k.
€ 3.728/m²
6916BC Tolkamer
€ 650.000 k.k.
€ 4.221/m²
6916MR Tolkamer
€ 379.000 k.k.
€ 3.414/m²
6916AC Tolkamer
€ 425.000 k.k.
€ 2.348/m²
6916LN Tolkamer
€ 495.000 k.k.
€ 3.278/m²
6916MA Tolkamer
€ 499.000 k.k.
€ 3.282/m²
6916BP Tolkamer
€ 335.000 k.k.
€ 3.350/m²
6916MP Tolkamer
€ 945.000 k.k.
€ 3.810/m²
6916BX Tolkamer
€ 249.000 k.k.
€ 3.507/m²
6916LK Tolkamer
€ 599.500 k.k.
€ 3.746/m²
6916LA Tolkamer
€ 385.000 k.k.
€ 3.850/m²
6916BC Tolkamer
€ 450.000 k.k.
€ 3.689/m²
6916BC Tolkamer
€ 699.000 k.k.
€ 4.262/m²
6916MS Tolkamer
€ 455.000 k.k.
€ 3.321/m²
6916LM Tolkamer
€ 450.000 k.k.
€ 3.333/m²
6916BZ Tolkamer
€ 269.000 k.k.
€ 3.635/m²
6916LA Tolkamer
€ 365.000 k.k.
€ 3.762/m²
6916AV Tolkamer
€ 325.000 k.k.
€ 3.282/m²
6916LE Tolkamer
€ 350.000 k.k.
€ 4.729/m²
Get free quotes from real estate agents with local market knowledge. Compare more than 18 real estate agents in Tolkamer.
Selling a home in Tolkamer? Compare all real estate agents in Tolkamer or view the top 10 real estate agents in Tolkamer for extra context for your choice.
Real estate agents make sharper offers when they know you're comparing — ask for quotes for sale or purchase.
Practical answers about housing supply, sales and comparing real estate agents in Tolkamer.
The costs of a real estate agent in Tolkamer depend on commission, setup costs, property presentation and the chosen service. Compare the 18 real estate agents in Tolkamer via the real estate agent page and request multiple quotes to compare rates and approach well.
Within our selection, we are currently showing 33 houses in Tolkamer. View also the sold houses in Tolkamer to compare the current offering with recent transactions.
Take into account not only price and living area but also maintenance, energy label, location, outdoor space and sales status. This way you compare houses in Tolkamer on more than just the asking price.
A local real estate agent knows the neighborhoods, recent transactions and demand in Tolkamer. By comparing 18 real estate agents in the region you get a better insight into prices, sales strategy and expected yield; the top 10 in Tolkamer provides a useful starting point.
Yes, when making a sales plan, a valuation in Tolkamer is wise. You gain insight into a realistic asking price and can then compare offers from real estate agents specifically.
View current location data on residents, WOZ development, housing stock, energy consumption, business activity and safety in Tolkamer. In 2026 were there 2.836 residents. The average WOZ value in 2025 is EUR 311.000.
These figures help to better assess and compare the housing stock in Tolkamer with recent sold homes. Orient yourself then on suitable top real estate agents in Tolkamer for sales advice in this region.
Residents
2.836
Last year: 2026
Average WOZ
EUR 311.000
Last year: 2025
Average income per person.
EUR 32.000
Source: AllNumbers
Crimes (current year)
44
Total registered
| Year | Residents |
|---|---|
| 2021 | 2.765 |
| 2022 | 2.755 |
| 2023 | 2.825 |
| 2024 | 2.820 |
| 2025 | 2.835 |
| 2026 | 2.836 |
| Year | Average WOZ |
|---|---|
| 2021 | EUR 218.000 |
| 2022 | EUR 246.000 |
| 2023 | EUR 285.000 |
| 2024 | EUR 306.000 |
| 2025 | EUR 311.000 |
Hoger
410
Praktisch
620
Middelbaar
1.090
Europa
280
Nederland
2.410
Buiten Europa
145
Label A
378
Label B
366
Label C
227
Label G
141
Label F
93
Label E
41
Label D
35
Label A+++
23
Label A++++
19
Label A+
14
Label A++
7
Label A+++++
0
| Year | Gas (m3) | Electricity (kWh) |
|---|---|---|
| 2020 | 1.190 | 2.970 |
| 2021 | 1.290 | 2.990 |
| 2022 | 1.010 | 2.880 |
| 2023 | 820 | 2.780 |
| 2024 | 810 | 2.840 |
Hoekwoning
Gas: 850 • Electricity: 2.860
Huurwoning
Gas: 640 • Electricity: 2.180
Koopwoning
Gas: 910 • Electricity: 3.070
Appartement
Gas: 530 • Electricity: 1.890
Tussenwoning
Gas: 750 • Electricity: 2.620
Vrijstaande woning
Gas: 1.120 • Electricity: 3.950
Twee-onder-één-kap woning
Gas: 980 • Electricity: 2.970
Total number of company establishments: 280
| Period | Crimes |
|---|---|
| jan 2026 | 2 |
| jul 2025 | 3 |
| jun 2025 | 0 |
| mei 2025 | 0 |
| mrt 2025 | 7 |
| mrt 2026 | 2 |
| nov 2024 | 3 |
| nov 2025 | 8 |
| okt 2024 | 4 |
| okt 2025 | 3 |
| sep 2024 | 9 |
| sep 2025 | 2 |
These figures give an indicative picture of safety trends in the living environment of Tolkamer.
Short answers based on current local statistics, handy for a quick comparison of the living environment.
Tolkamer telt in 2026 ongeveer 2.836 inwoners.
De gemiddelde WOZ-waarde in Tolkamer is in 2025 circa € 311.000.
Het gemiddelde inkomen per inwoner in Tolkamer ligt rond € 32.000 per jaar.
Voor het huidige jaar gaat het om ongeveer 44 geregistreerde misdrijven. Gebruik deze cijfers als indicatie en vergelijk trends per periode.
In Tolkamer komt vooral "Tussenwoningen" veel voor, met ongeveer 344 woningen.