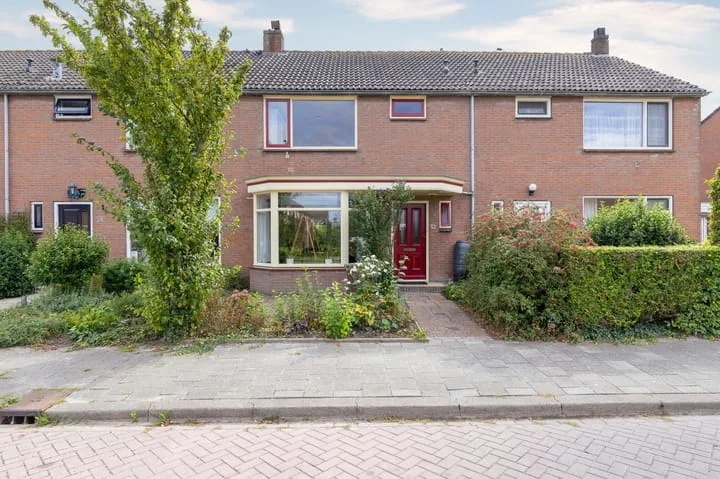
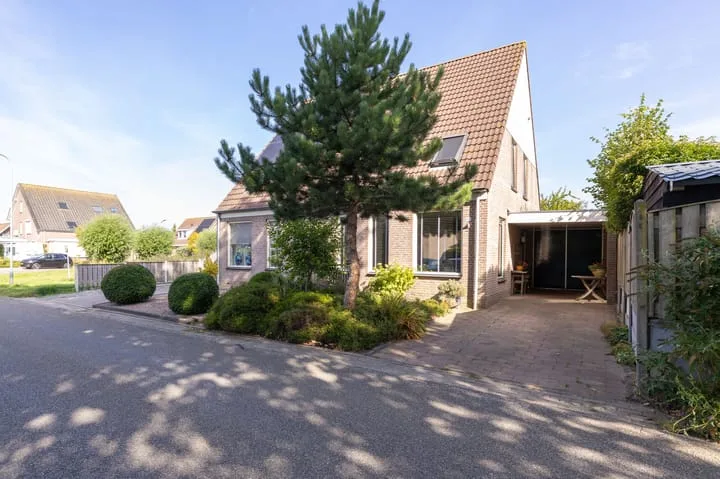
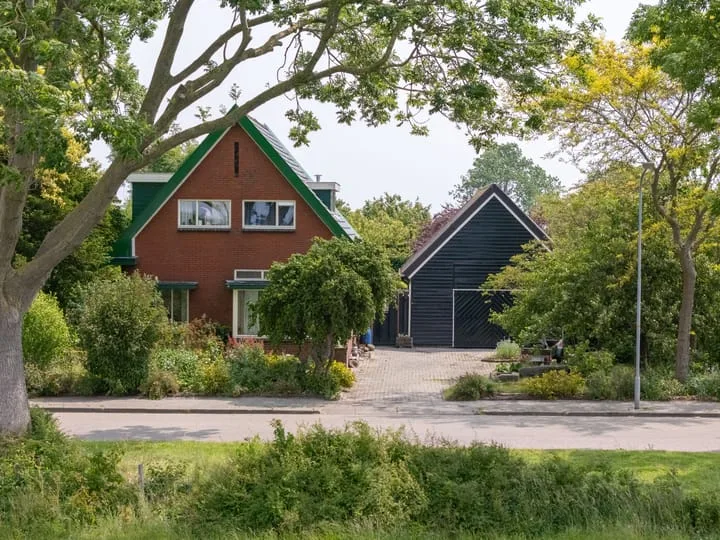
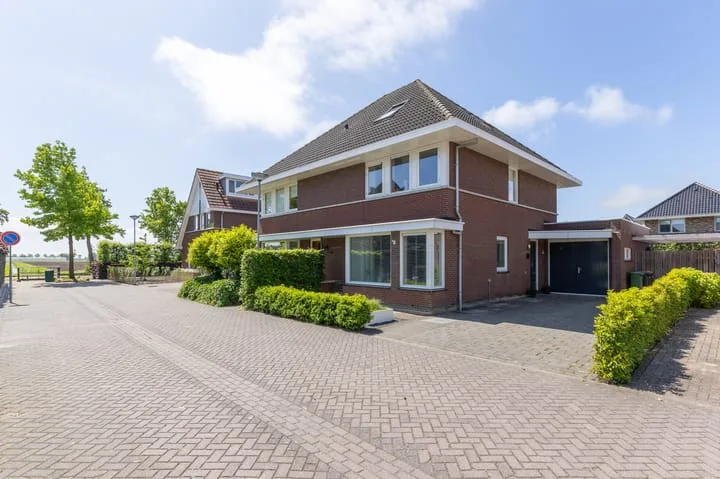
- Sold
Rietgors 8
1606CL Venhuizen
€ 389.500 k.k.
€ 3.219/m²
- Living area
- 121 m²
- Land area
- 239 m²
- Bedrooms
- 4
Searching in 47 houses in Venhuizen
Type to search. Use arrow down and arrow up to navigate through results and press Enter to open.
Hidden search suggestions.
View current properties in Venhuizen or search targeted on street, postal code and property characteristics.
View the current housing stock in Venhuizen and quickly filter by price, living area, rooms and more. There are currently 47 houses in this place within our selection. View also 40 sold houses in Venhuizen for extra insight into the local housing market.
1606CL Venhuizen
€ 389.500 k.k.
€ 3.219/m²
1606BJ Venhuizen
€ 375.000 k.k.
€ 3.232/m²
1606DM Venhuizen
€ 560.000 k.k.
€ 3.888/m²
1606BW Venhuizen
Price upon request
1606AB Venhuizen
€ 785.000 k.k.
€ 5.946/m²
1606MG Venhuizen
€ 650.000 k.k.
€ 4.362/m²
1606XG Venhuizen
€ 315.000 k.k.
€ 2.669/m²
1606CT Venhuizen
€ 440.000 k.k.
€ 4.074/m²
1606AK Venhuizen
€ 795.000 k.k.
€ 5.445/m²
1606NE Venhuizen
€ 325.000 k.k.
€ 3.186/m²
1606BT Venhuizen
€ 350.000 k.k.
€ 2.845/m²
1606BV Venhuizen
€ 419.000 k.k.
€ 4.554/m²
1606BZ Venhuizen
€ 1.200.000 k.k.
€ 3.539/m²
1606BZ Venhuizen
€ 750.000 k.k.
€ 3.846/m²
1606NJ Venhuizen
€ 335.000 k.k.
€ 3.316/m²
1606DJ Venhuizen
€ 375.000 k.k.
€ 3.571/m²
1606AN Venhuizen
€ 595.000 k.k.
€ 4.648/m²
1606NM Venhuizen
€ 650.000 k.k.
€ 5.462/m²
1606DG Venhuizen
€ 525.000 k.k.
€ 3.571/m²
Get free quotes from real estate agents with local market knowledge. Compare more than 26 real estate agents in Venhuizen.
Selling a home in Venhuizen? Compare all real estate agents in Venhuizen or view the top 10 real estate agents in Venhuizen for extra context for your choice.
Real estate agents make sharper offers when they know you're comparing — ask for quotes for sale or purchase.
Practical answers about housing supply, sales and comparing real estate agents in Venhuizen.
The costs of a real estate agent in Venhuizen depend on commission, setup costs, property presentation and the chosen service. Compare the 26 real estate agents in Venhuizen via the real estate agent page and request multiple quotes to compare rates and approach well.
Within our selection, we are currently showing 47 houses in Venhuizen. View also the sold houses in Venhuizen to compare the current offering with recent transactions.
Take into account not only price and living area but also maintenance, energy label, location, outdoor space and sales status. This way you compare houses in Venhuizen on more than just the asking price.
A local real estate agent knows the neighborhoods, recent transactions and demand in Venhuizen. By comparing 26 real estate agents in the region you get a better insight into prices, sales strategy and expected yield; the top 10 in Venhuizen provides a useful starting point.
Yes, when making a sales plan, a valuation in Venhuizen is wise. You gain insight into a realistic asking price and can then compare offers from real estate agents specifically.
View current location data on residents, WOZ development, housing stock, energy consumption, business activity and safety in Venhuizen. In 2025 were there 4.285 residents. The average WOZ value in 2025 is EUR 396.000.
These figures help to better assess and compare the housing stock in Venhuizen with recent sold homes. Orient yourself then on suitable top real estate agents in Venhuizen for sales advice in this region.
Residents
4.285
Last year: 2025
Average WOZ
EUR 396.000
Last year: 2025
Average income per person.
EUR 33.500
Source: AllNumbers
Crimes (current year)
68
Total registered
| Year | Residents |
|---|---|
| 2021 | 4.335 |
| 2022 | 4.325 |
| 2023 | 4.335 |
| 2024 | 4.300 |
| 2025 | 4.285 |
| Year | Average WOZ |
|---|---|
| 2021 | EUR 290.000 |
| 2022 | EUR 317.000 |
| 2023 | EUR 374.000 |
| 2024 | EUR 386.000 |
| 2025 | EUR 396.000 |
Hoger
740
Praktisch
850
Middelbaar
1.550
Europa
320
Nederland
3.705
Buiten Europa
260
Label A
560
Label B
428
Label C
409
Label G
177
Label D
167
Label F
82
Label A++
37
Label A+++
33
Label A+
32
Label E
23
Label A++++
10
Label A+++++
0
| Year | Gas (m3) | Electricity (kWh) |
|---|---|---|
| 2020 | 1.390 | 3.100 |
| 2021 | 1.490 | 3.120 |
| 2022 | 1.150 | 2.900 |
| 2023 | 960 | 2.770 |
| 2024 | 930 | 2.860 |
Hoekwoning
Gas: 860 • Electricity: 2.620
Huurwoning
Gas: 760 • Electricity: 1.980
Koopwoning
Gas: 1.040 • Electricity: 3.090
Appartement
Gas: 650 • Electricity: 1.540
Tussenwoning
Gas: 790 • Electricity: 2.400
Vrijstaande woning
Gas: 1.210 • Electricity: 3.500
Twee-onder-één-kap woning
Gas: 1.030 • Electricity: 2.890
Total number of company establishments: 590
| Period | Crimes |
|---|---|
| jan 2025 | 3 |
| jan 2026 | 6 |
| jul 2025 | 3 |
| jun 2025 | 12 |
| mei 2025 | 7 |
| mrt 2025 | 5 |
| nov 2024 | 4 |
| nov 2025 | 3 |
| okt 2024 | 5 |
| okt 2025 | 4 |
| sep 2024 | 0 |
| sep 2025 | 8 |
These figures give an indicative picture of safety trends in the living environment of Venhuizen.
Short answers based on current local statistics, handy for a quick comparison of the living environment.
Venhuizen telt in 2025 ongeveer 4.285 inwoners.
De gemiddelde WOZ-waarde in Venhuizen is in 2025 circa € 396.000.
Het gemiddelde inkomen per inwoner in Venhuizen ligt rond € 33.500 per jaar.
Voor het huidige jaar gaat het om ongeveer 68 geregistreerde misdrijven. Gebruik deze cijfers als indicatie en vergelijk trends per periode.
In Venhuizen komt vooral "Vrijstaande woningen" veel voor, met ongeveer 678 woningen.