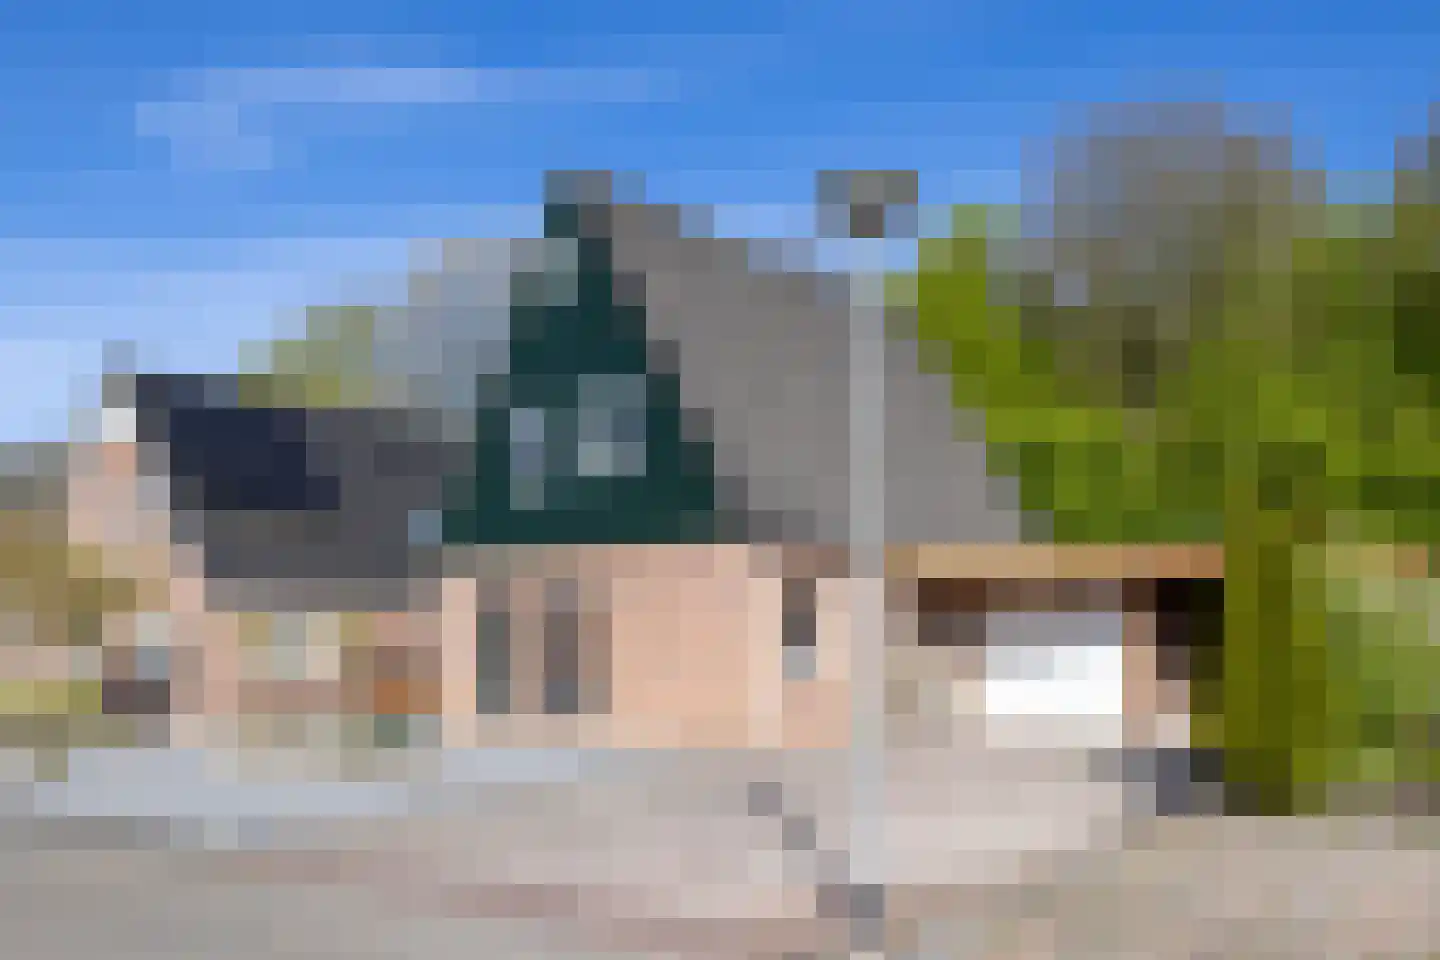
- Available
Tranendallaan 9
9678PB Westerlee
€ 349.500 k.k.
€ 3.679/m²
- Living area
- 95 m²
- Land area
- 2400 m²
- Bedrooms
- 3
Searching in 20 houses in Westerlee
Type to search. Use arrow down and arrow up to navigate through results and press Enter to open.
Hidden search suggestions.
View current properties in Westerlee or search targeted on street, postal code and property characteristics.
View the current housing stock in Westerlee and quickly filter by price, living area, rooms and more. There are currently 20 houses in this place within our selection. View also 12 sold houses in Westerlee for extra insight into the local housing market.
9678PB Westerlee
€ 349.500 k.k.
€ 3.679/m²
9678RT Westerlee
€ 399.500 k.k.
9678RK Westerlee
€ 550.000 k.k.
9678PB Westerlee
€ 699.000 k.k.
€ 3.013/m²
9678RT Westerlee
€ 397.500 k.k.
€ 3.549/m²
9678RH Westerlee
€ 399.000 k.k.
€ 3.410/m²
9678PT Westerlee
€ 359.500 k.k.
€ 3.559/m²
9678RJ Westerlee
€ 549.500 k.k.
€ 4.040/m²
9678PL Westerlee
€ 375.000 k.k.
€ 3.571/m²
9678TL Westerlee
€ 399.500 k.k.
€ 3.566/m²
9678TK Westerlee
€ 375.000 k.k.
€ 3.676/m²
9678PP Westerlee
€ 395.000 k.k.
€ 3.591/m²
9678PE Westerlee
€ 475.000 k.k.
€ 2.896/m²
9678PB Westerlee
€ 489.500 k.k.
€ 3.599/m²
9678PP Westerlee
€ 550.000 k.k.
€ 2.381/m²
9678RS Westerlee
€ 449.500 k.k.
€ 3.908/m²
9678TL Westerlee
€ 499.000 k.k.
€ 2.207/m²
9678RT Westerlee
€ 385.000 k.k.
€ 3.318/m²
9678RW Westerlee
€ 449.500 k.k.
€ 3.908/m²
9678PS Westerlee
€ 325.000 k.k.
€ 2.876/m²
Get free quotes from real estate agents with local market knowledge. Compare more than 25 real estate agents in Westerlee.
Selling a home in Westerlee? Compare all real estate agents in Westerlee or view the top 10 real estate agents in Westerlee for extra context for your choice.
Real estate agents make sharper offers when they know you're comparing — ask for quotes for sale or purchase.
Practical answers about housing supply, sales and comparing real estate agents in Westerlee.
The costs of a real estate agent in Westerlee depend on commission, setup costs, property presentation and the chosen service. Compare the 25 real estate agents in Westerlee via the real estate agent page and request multiple quotes to compare rates and approach well.
Within our selection, we are currently showing 20 houses in Westerlee. View also the sold houses in Westerlee to compare the current offering with recent transactions.
Take into account not only price and living area but also maintenance, energy label, location, outdoor space and sales status. This way you compare houses in Westerlee on more than just the asking price.
A local real estate agent knows the neighborhoods, recent transactions and demand in Westerlee. By comparing 25 real estate agents in the region you get a better insight into prices, sales strategy and expected yield; the top 10 in Westerlee provides a useful starting point.
Yes, when making a sales plan, a valuation in Westerlee is wise. You gain insight into a realistic asking price and can then compare offers from real estate agents specifically.
View current location data on residents, WOZ development, housing stock, energy consumption, business activity and safety in Westerlee. In 2025 were there 1.495 residents. The average WOZ value in 2025 is EUR 333.000.
These figures help to better assess and compare the housing stock in Westerlee with recent sold homes. Orient yourself then on suitable top real estate agents in Westerlee for sales advice in this region.
Residents
1.495
Last year: 2025
Average WOZ
EUR 333.000
Last year: 2025
Average income per person.
EUR 28.800
Source: AllNumbers
Crimes (current year)
27
Total registered
| Year | Residents |
|---|---|
| 2021 | 1.490 |
| 2022 | 1.505 |
| 2023 | 1.520 |
| 2024 | 1.505 |
| 2025 | 1.495 |
| Year | Average WOZ |
|---|---|
| 2021 | EUR 218.000 |
| 2022 | EUR 248.000 |
| 2023 | EUR 305.000 |
| 2024 | EUR 324.000 |
| 2025 | EUR 333.000 |
Hoger
280
Praktisch
310
Middelbaar
590
Europa
55
Nederland
1.395
Buiten Europa
40
Label G
190
Label B
107
Label A
89
Label C
67
Label D
58
Label F
37
Label A+
29
Label E
24
Label A++
10
Label A+++
2
Label A++++
0
Label A+++++
0
| Year | Gas (m3) | Electricity (kWh) |
|---|---|---|
| 2020 | 1.660 | 3.240 |
| 2021 | 1.880 | 3.140 |
| 2022 | 1.430 | 2.890 |
| 2023 | 1.160 | 2.900 |
| 2024 | 1.110 | 3.050 |
Hoekwoning
Gas: 990 • Electricity: 1.980
Huurwoning
Gas: 990 • Electricity: 2.200
Koopwoning
Gas: 1.200 • Electricity: 3.080
Appartement
Gas: 1.010 • Electricity: 1.840
Tussenwoning
Gas: 760 • Electricity: 2.030
Vrijstaande woning
Gas: 1.240 • Electricity: 3.160
Twee-onder-één-kap woning
Gas: 1.090 • Electricity: 2.590
Total number of company establishments: 155
| Period | Crimes |
|---|---|
| jan 2025 | 4 |
| jan 2026 | 1 |
| jul 2025 | 0 |
| jun 2025 | 3 |
| mei 2025 | 3 |
| mrt 2025 | 1 |
| nov 2024 | 2 |
| nov 2025 | 2 |
| okt 2024 | 1 |
| okt 2025 | 6 |
| sep 2024 | 7 |
| sep 2025 | 4 |
These figures give an indicative picture of safety trends in the living environment of Westerlee.
Short answers based on current local statistics, handy for a quick comparison of the living environment.
Westerlee telt in 2025 ongeveer 1.495 inwoners.
De gemiddelde WOZ-waarde in Westerlee is in 2025 circa € 333.000.
Het gemiddelde inkomen per inwoner in Westerlee ligt rond € 28.800 per jaar.
Voor het huidige jaar gaat het om ongeveer 27 geregistreerde misdrijven. Gebruik deze cijfers als indicatie en vergelijk trends per periode.
In Westerlee komt vooral "Vrijstaande woningen" veel voor, met ongeveer 423 woningen.