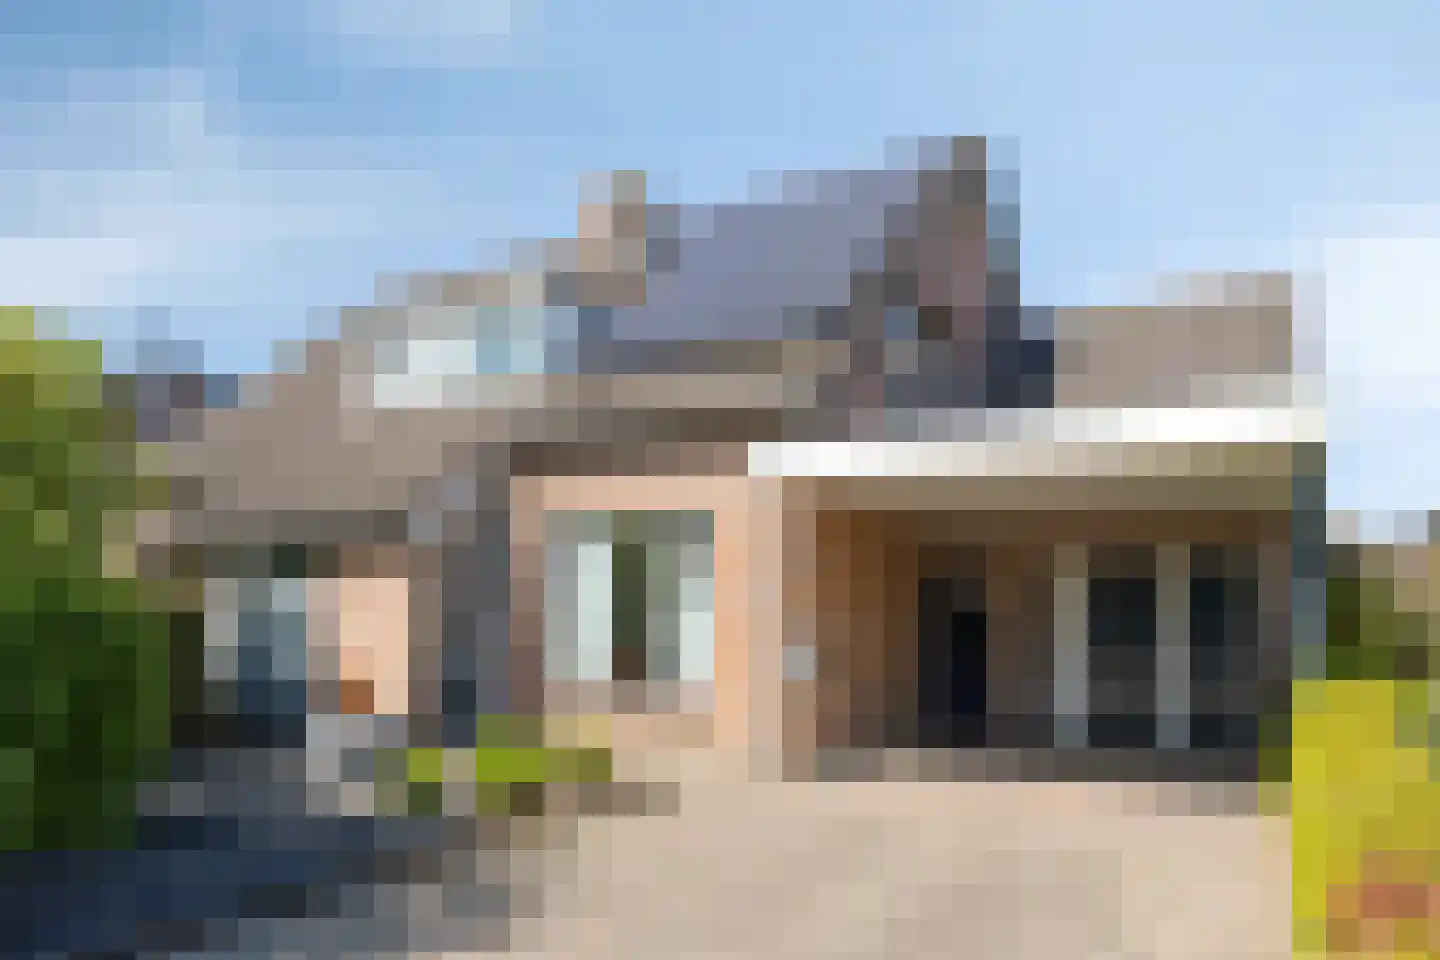
Housing offer in Wintelre

Searching in 18 houses in Wintelre

Connected to: Vastgoed Nederland NVM Makelaars

View the current housing stock in Wintelre and quickly filter by price, living area, rooms and more. There are currently 18 houses in this place within our selection. View also 9 sold houses in Wintelre for extra insight into the local housing market.

Selection

Search and filter homes

Set your preferences and discover homes that suit you.

Total supply 242.647
Filters

Set price, area and other characteristics. Adjust a filter or click on Show homes. Location changes directly above.

Reset filters

You search for

  • Place Wintelre

Selling a home in Wintelre? Compare realtor offers

Get free quotes from real estate agents with local market knowledge. Compare more than 101 real estate agents in Wintelre.

Free request a quote

  • Quotes in Wintelre
  • Non-binding
  • Personal
  • Compare free rates

Selling a home in Wintelre? Compare all real estate agents in Wintelre or view the top 10 real estate agents in Wintelre for extra context for your choice.

Compare multiple quotes

Real estate agents make sharper offers when they know you're comparing — ask for quotes for sale or purchase.

Frequently asked questions about homes in Wintelre

Practical answers about housing supply, sales and comparing real estate agents in Wintelre.

Residential and neighborhood statistics in Wintelre

View current location data on residents, WOZ development, housing stock, energy consumption, business activity and safety in Wintelre. In 2025 were there 2.210 residents. The average WOZ value in 2025 is EUR 484.000.

These figures help to better assess and compare the housing stock in Wintelre with recent sold homes. Orient yourself then on suitable top real estate agents in Wintelre for sales advice in this region.

Residents

2.210

Last year: 2025

Average WOZ

EUR 484.000

Last year: 2025

Average income per person.

EUR 34.000

Source: AllNumbers

Crimes (current year)

42

Total registered

Demographics and WOZ development

Inhabitants per year

Inhabitants per year in Wintelre
Year Residents
2021 2.030
2022 2.100
2023 2.125
2024 2.145
2025 2.210

Annual WOZ value

WOZ value per year in Wintelre
Year Average WOZ
2021 EUR 359.000
2022 EUR 416.000
2023 EUR 461.000
2024 EUR 499.000
2025 EUR 484.000

Composition of residents

Age build-up

65+: 465 0-15: 375 15-25: 235 25-45: 525 45-65: 605

Education level

Hoger

520

Praktisch

380

Middelbaar

720

Origin of residents (2025)

Europa

110

Nederland

2.030

Buiten Europa

70

Housing stock and construction periods

Types of homes

Hoekwoningen 88
Appartementen 150
Tussenwoningen 97
Vrijstaande woningen 403
Twee-onder-één-kap woningen 182

Construction period of buildings

Voor 1700 0
1700 tot 1900 20
1900 tot 1925 20
1925 tot 1950 50
1950 tot 1970 192
1970 tot 1980 128
1980 tot 1990 166
1990 tot 2000 74
2000 tot 2010 106
2010 tot 2020 126
2020 en later 119

Energy and sustainability

Energy label distribution

Label C

212

Label A

192

Label B

132

Label D

115

Label F

74

Label G

70

Label A+++

38

Label E

29

Label A++++

9

Label A+

7

Label A++

5

Label A+++++

0

Average energy consumption per year

Average energy consumption per year in Wintelre
Year Gas (m3) Electricity (kWh)
2020 1.520 3.580
2021 1.690 3.690
2022 1.340 3.500
2023 1.100 3.300
2024 1.070 3.410

Consumption per house type

Hoekwoning

Gas: 830 • Electricity: 2.560

Huurwoning

Gas: 1.000 • Electricity: 2.450

Koopwoning

Gas: 1.120 • Electricity: 3.490

Appartement

Gas: 980 • Electricity: 3.000

Tussenwoning

Gas: 780 • Electricity: 2.200

Vrijstaande woning

Gas: 1.280 • Electricity: 4.020

Twee-onder-één-kap woning

Gas: 1.100 • Electricity: 2.850

Business activity in Wintelre (2025)

Handel en HORECA 45
Nijverheid en energie 65
Zakelijke dienstverlening 70
Overheid, onderwijs en zorg 40
Landbouw, bosbouw en visserij 65
Vervoer, informatie en communicatie 15
Financiele diensten en onroerendgoed 20
Cultuur, recreatie en overige diensten 30

Total number of company establishments: 355

Recent crime statistics

Recent crime statistics in Wintelre
Period Crimes
jan 2025 0
jan 2026 8
jul 2025 6
jun 2025 1
mei 2025 0
mrt 2025 7
nov 2024 1
nov 2025 2
okt 2024 8
okt 2025 9
sep 2024 6
sep 2025 0

These figures give an indicative picture of safety trends in the living environment of Wintelre.

Frequently asked questions about living in Wintelre

Short answers based on current local statistics, handy for a quick comparison of the living environment.

Hoeveel inwoners heeft Wintelre?

Wintelre telt in 2025 ongeveer 2.210 inwoners.

Wat is de gemiddelde WOZ-waarde in Wintelre?

De gemiddelde WOZ-waarde in Wintelre is in 2025 circa € 484.000.

Wat is het gemiddelde inkomen per inwoner in Wintelre?

Het gemiddelde inkomen per inwoner in Wintelre ligt rond € 34.000 per jaar.

Hoe veilig is wonen in Wintelre?

Voor het huidige jaar gaat het om ongeveer 42 geregistreerde misdrijven. Gebruik deze cijfers als indicatie en vergelijk trends per periode.

Welke woningtypen komen het meest voor in Wintelre?

In Wintelre komt vooral "Vrijstaande woningen" veel voor, met ongeveer 403 woningen.

Receive free, non-binding quotes

Compare multiple real estate agents and choose the best match.