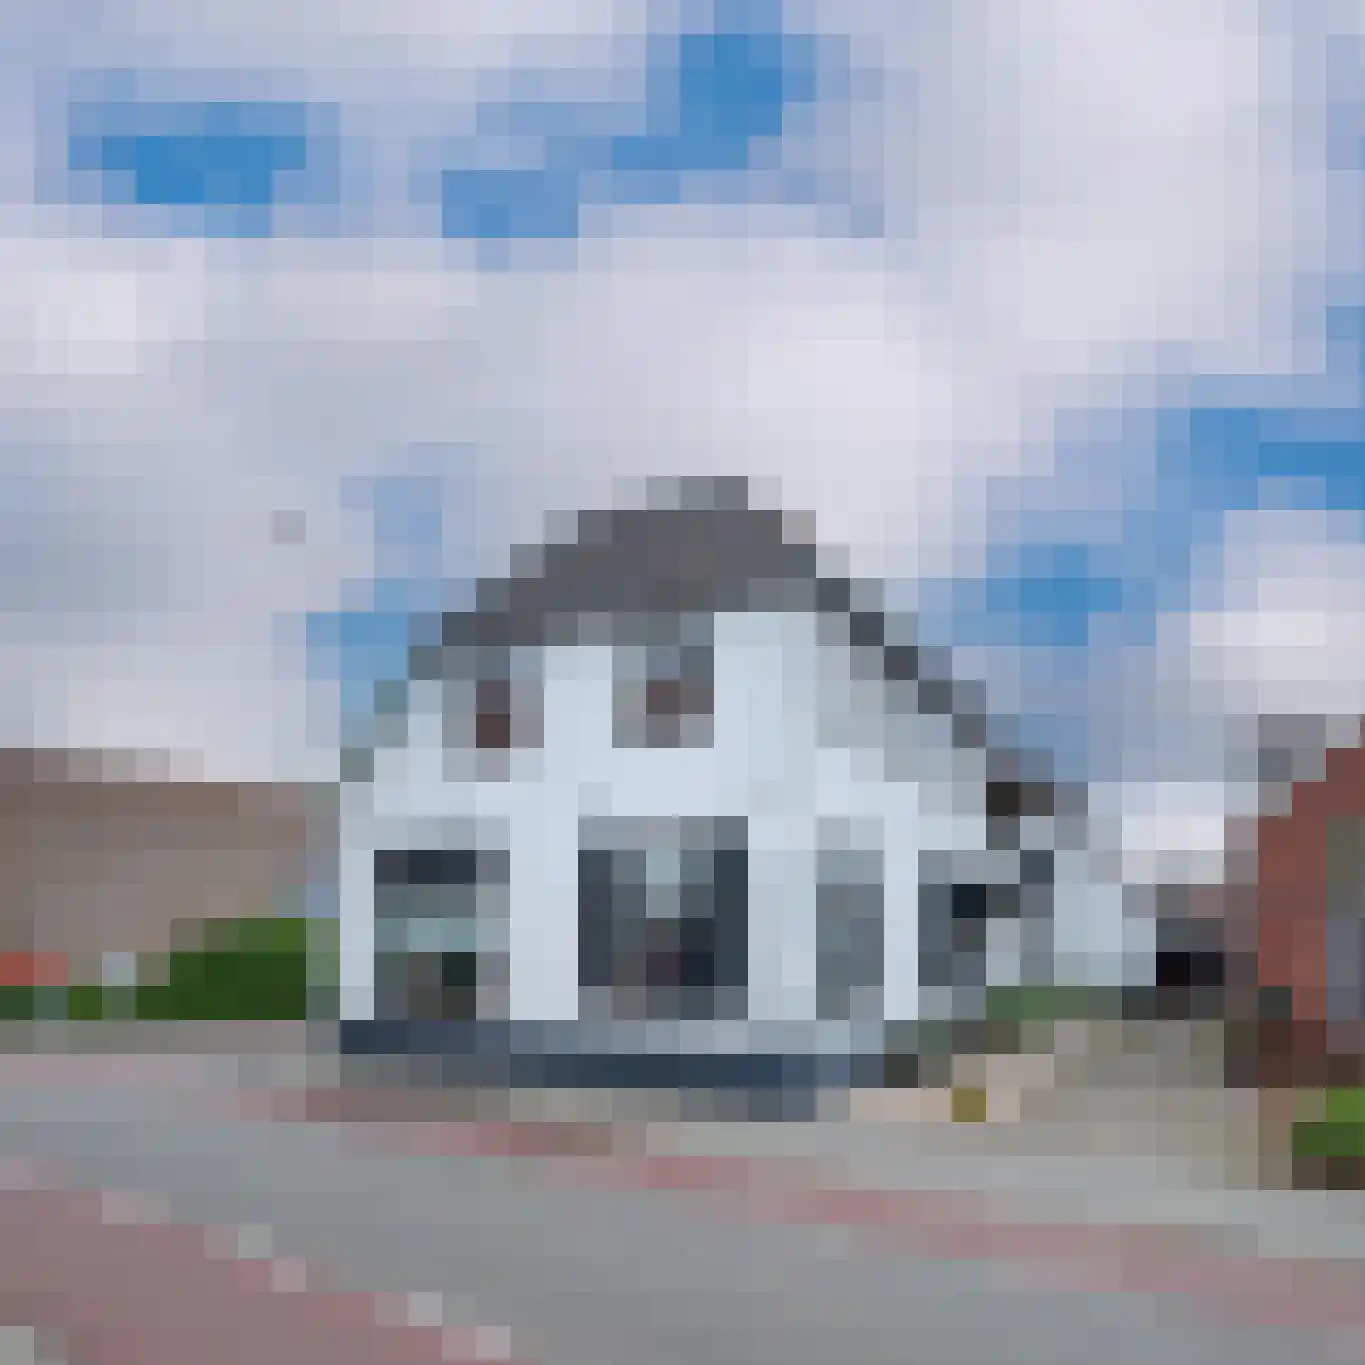
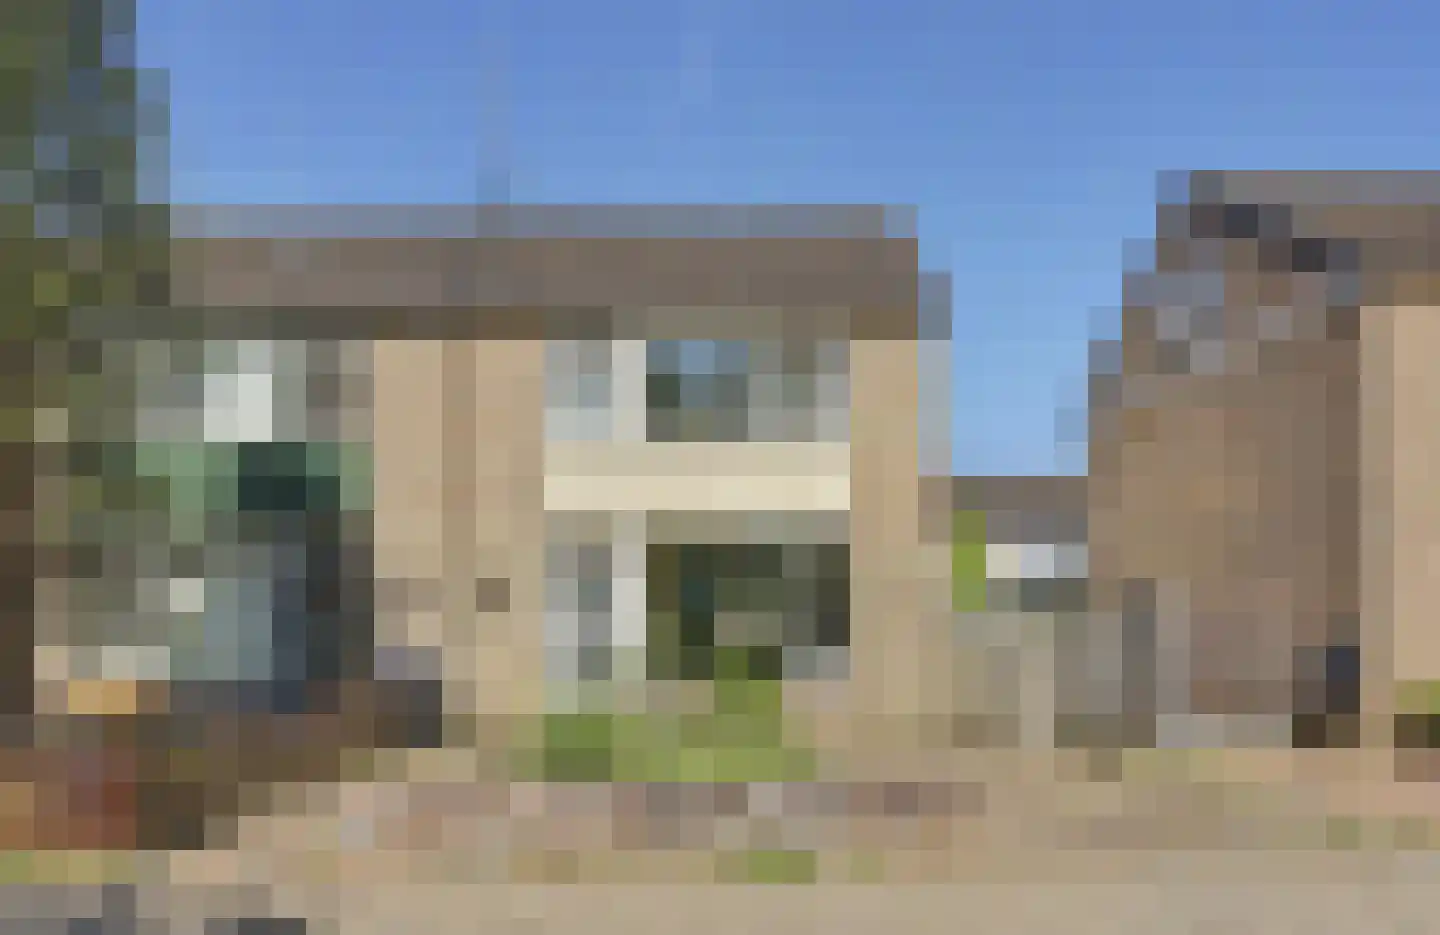
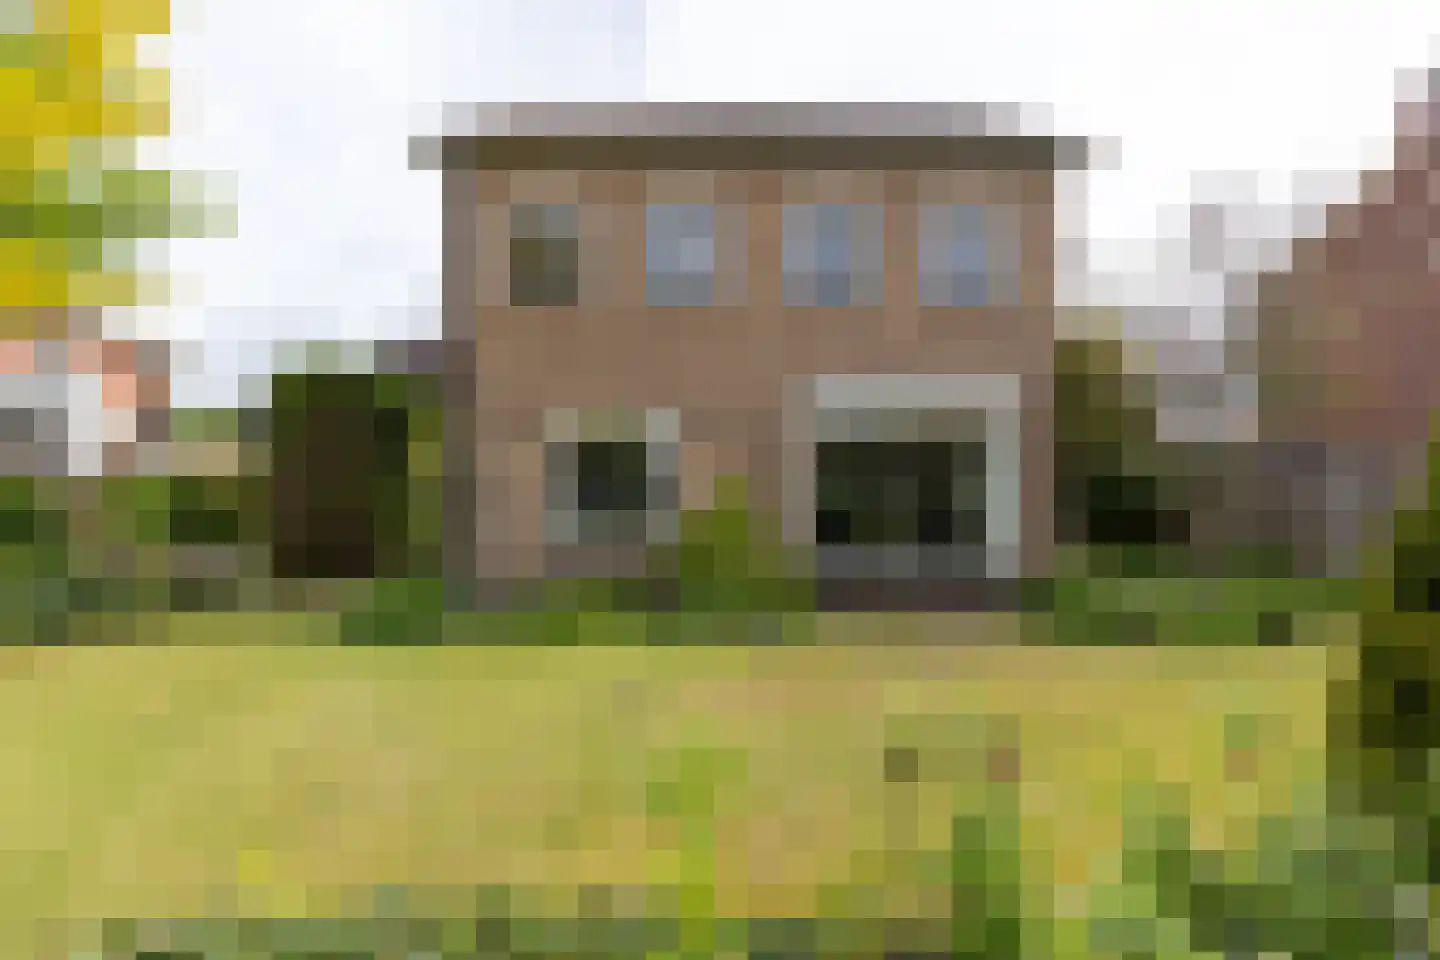
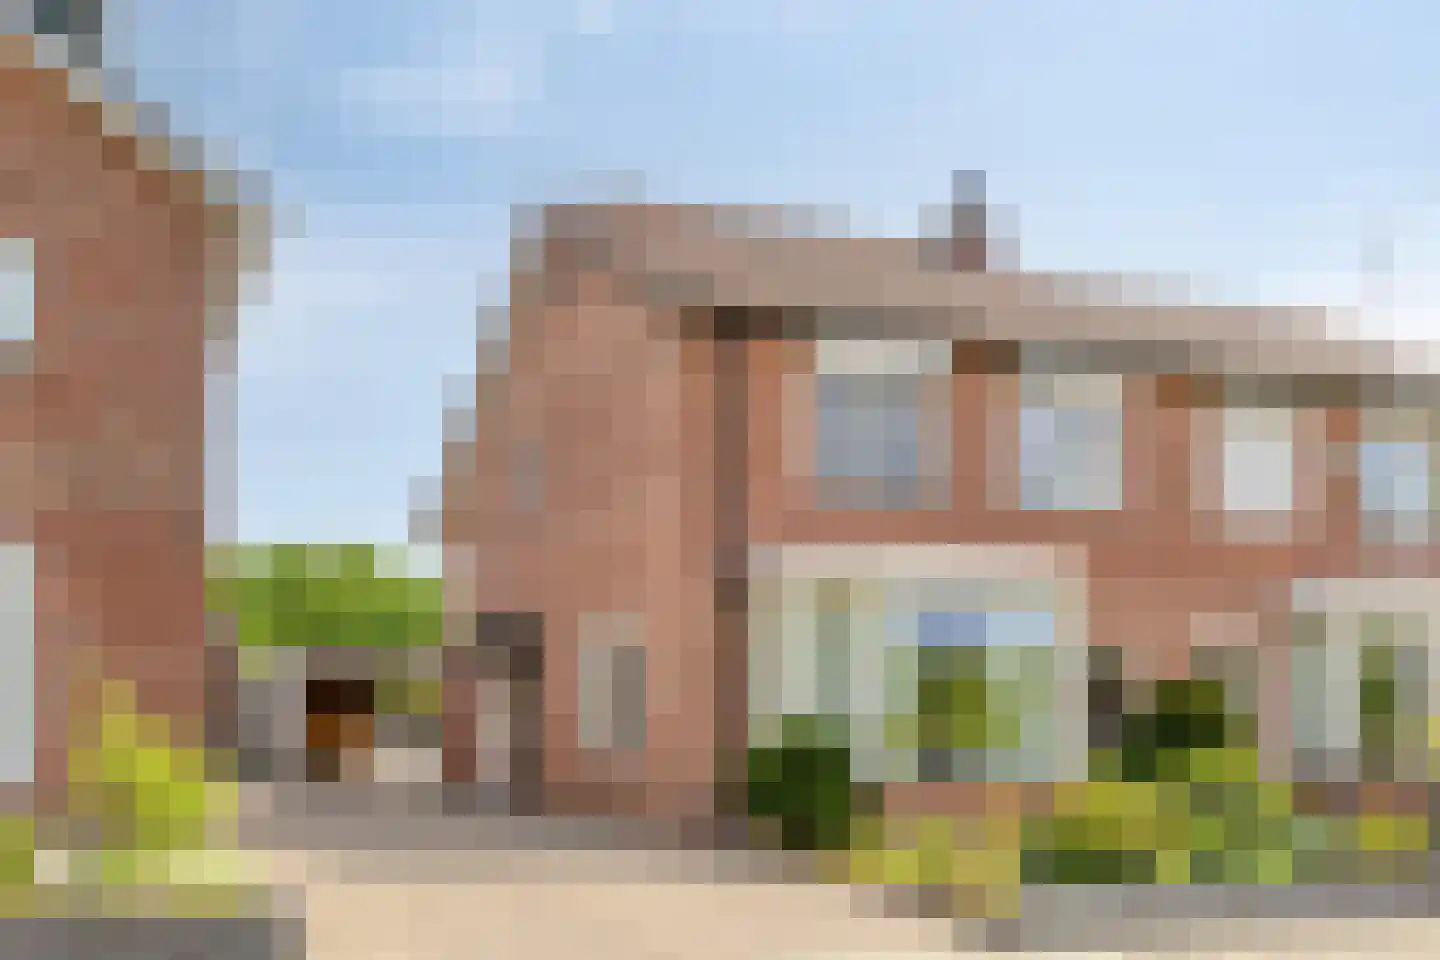
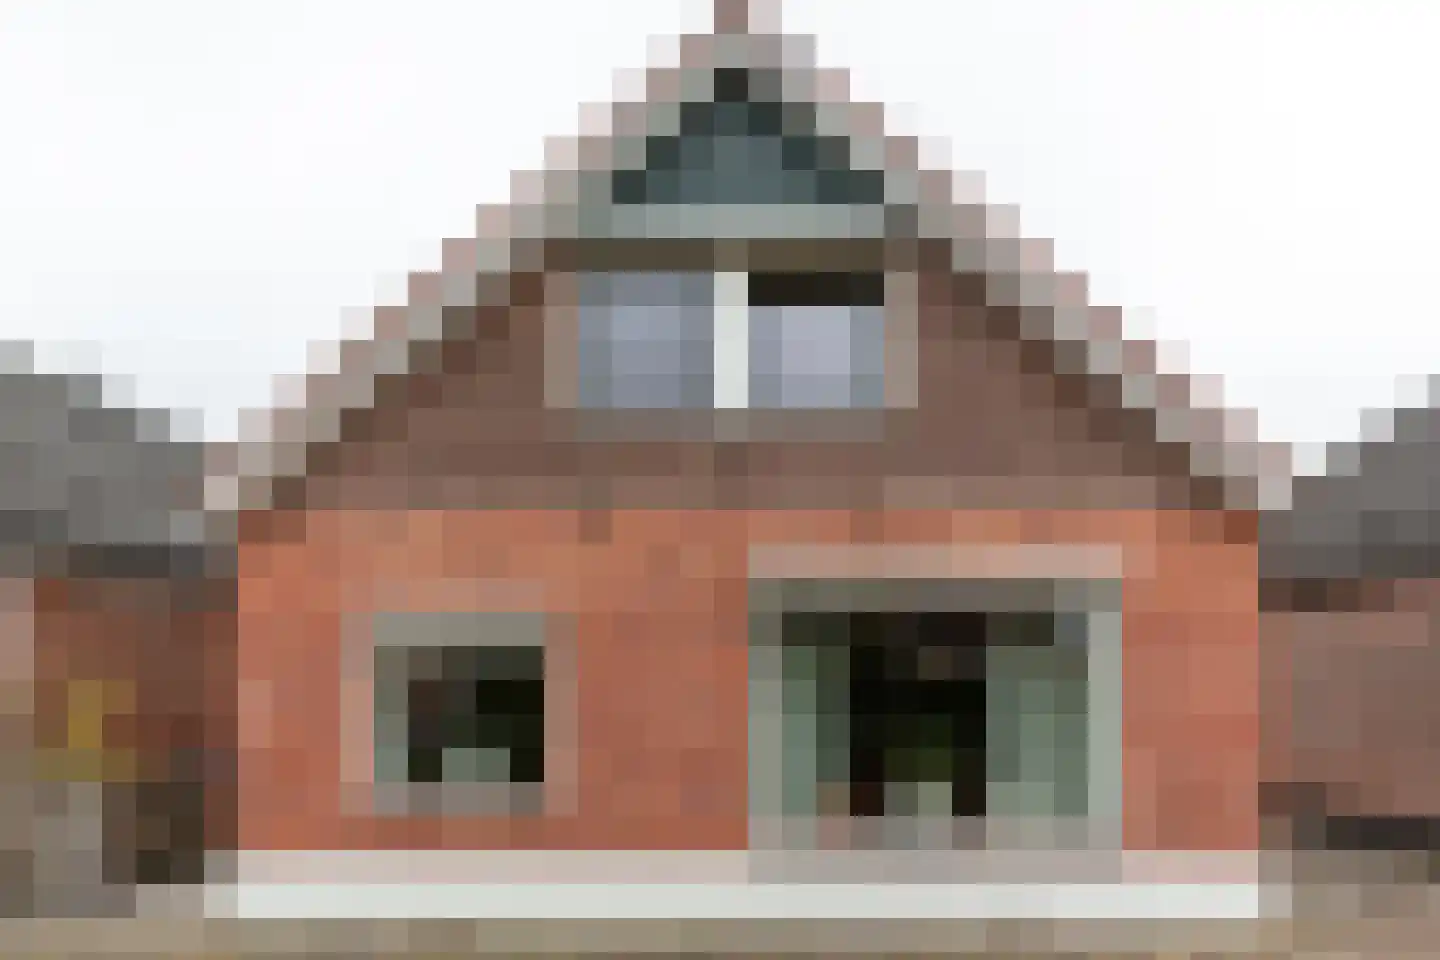
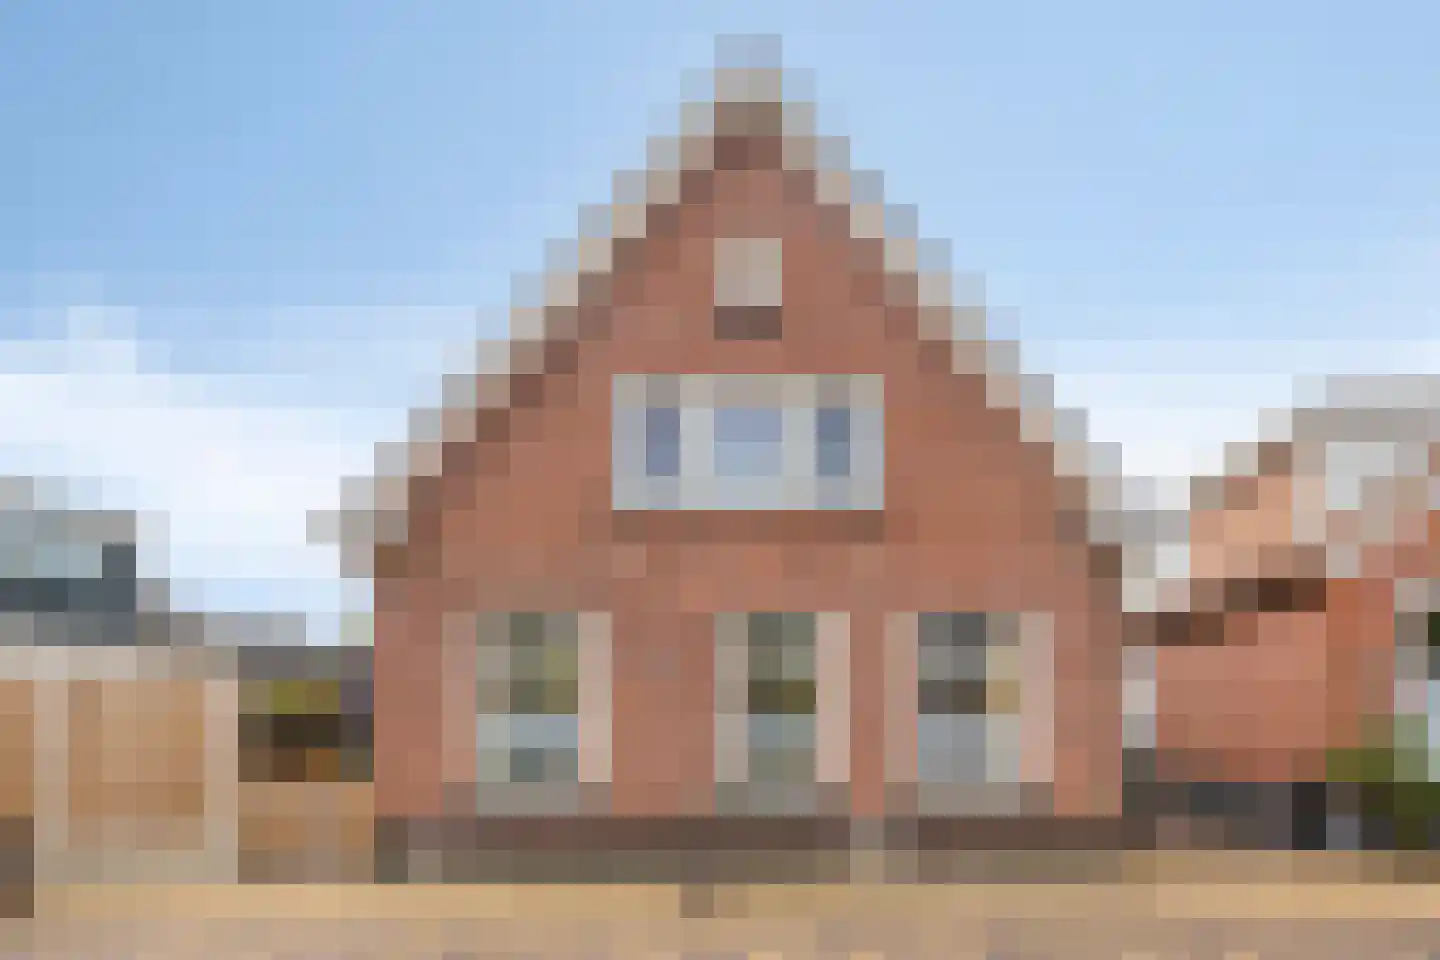
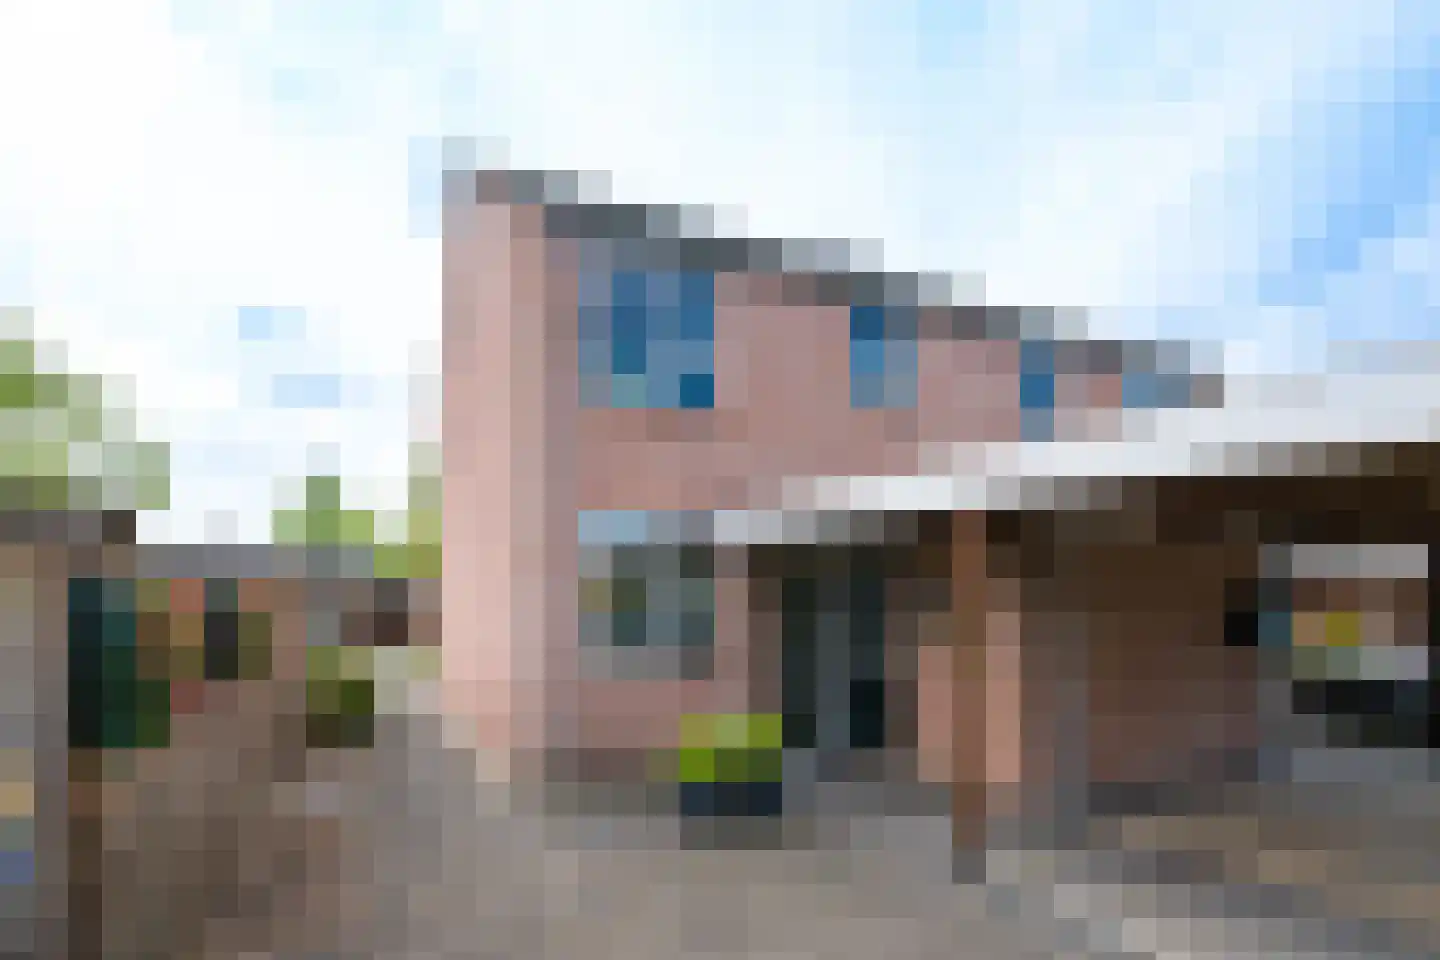
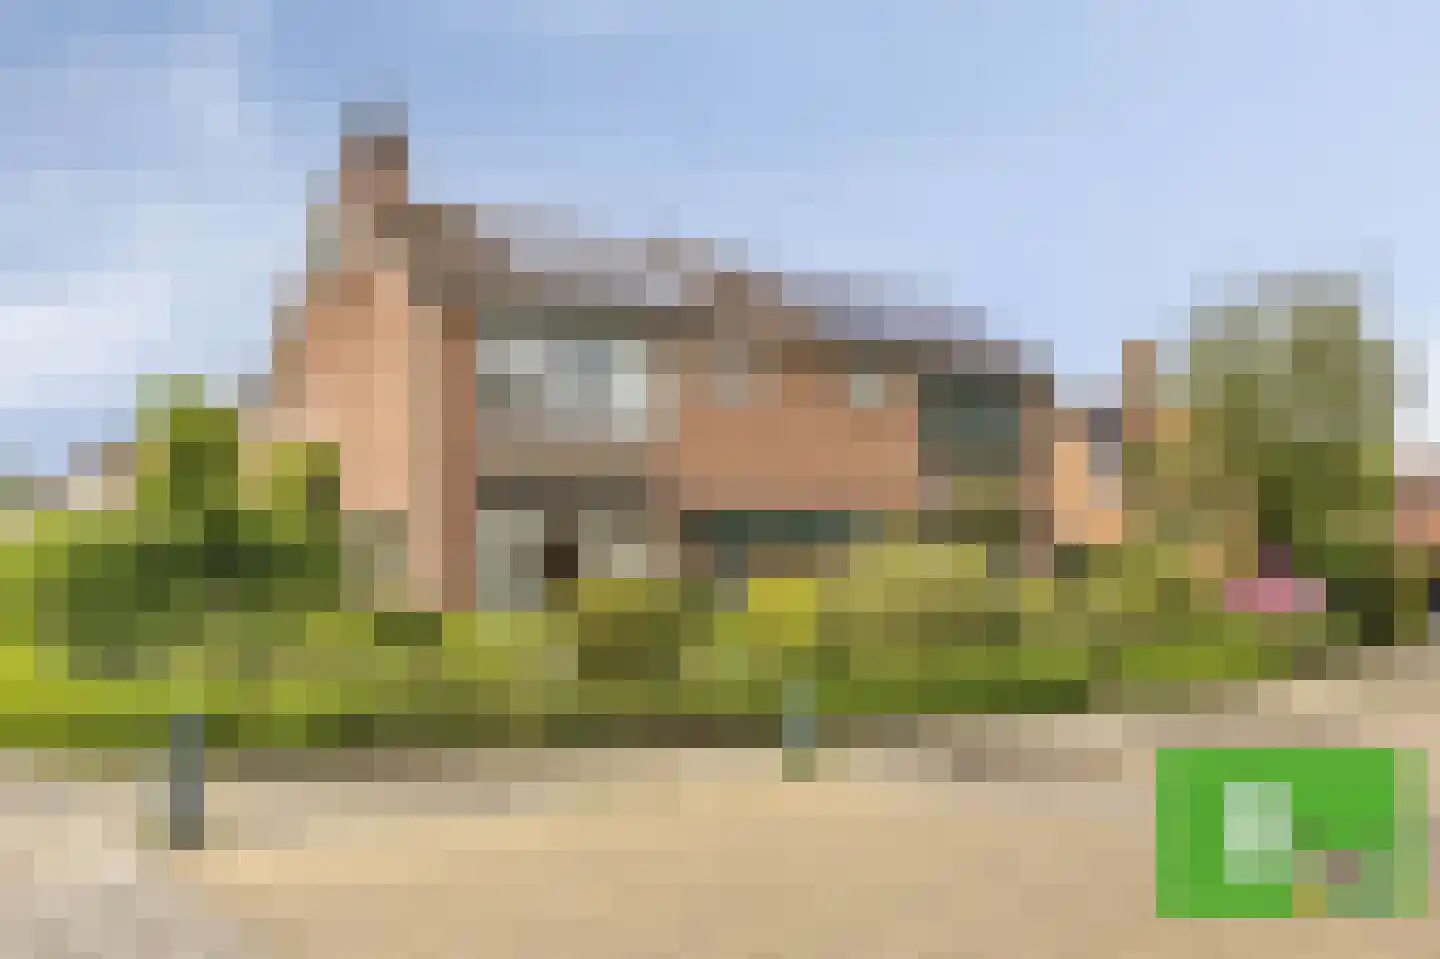
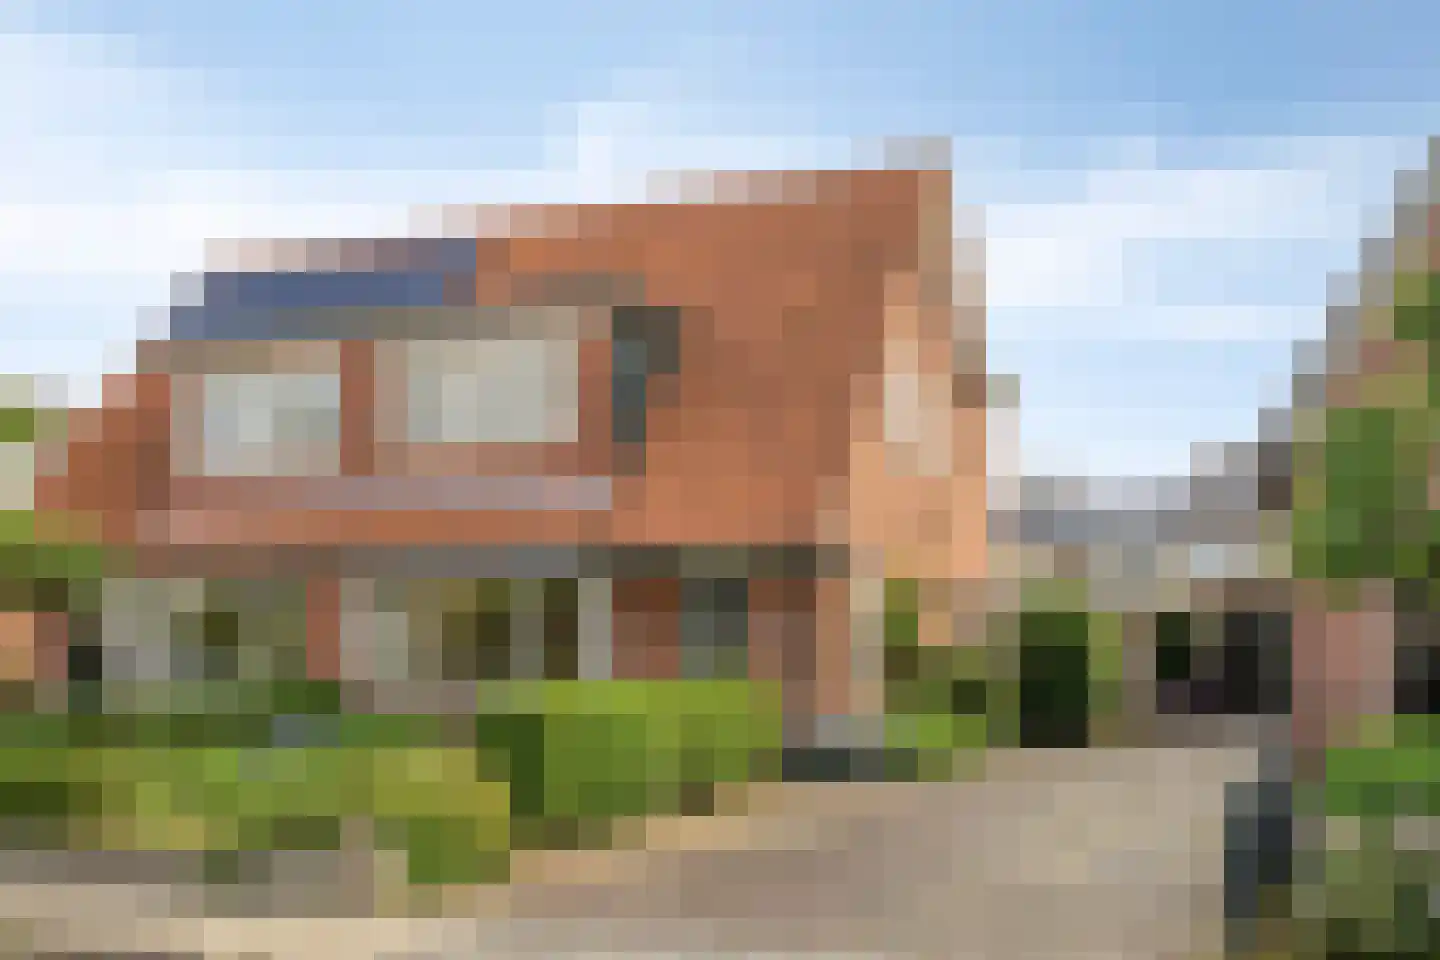
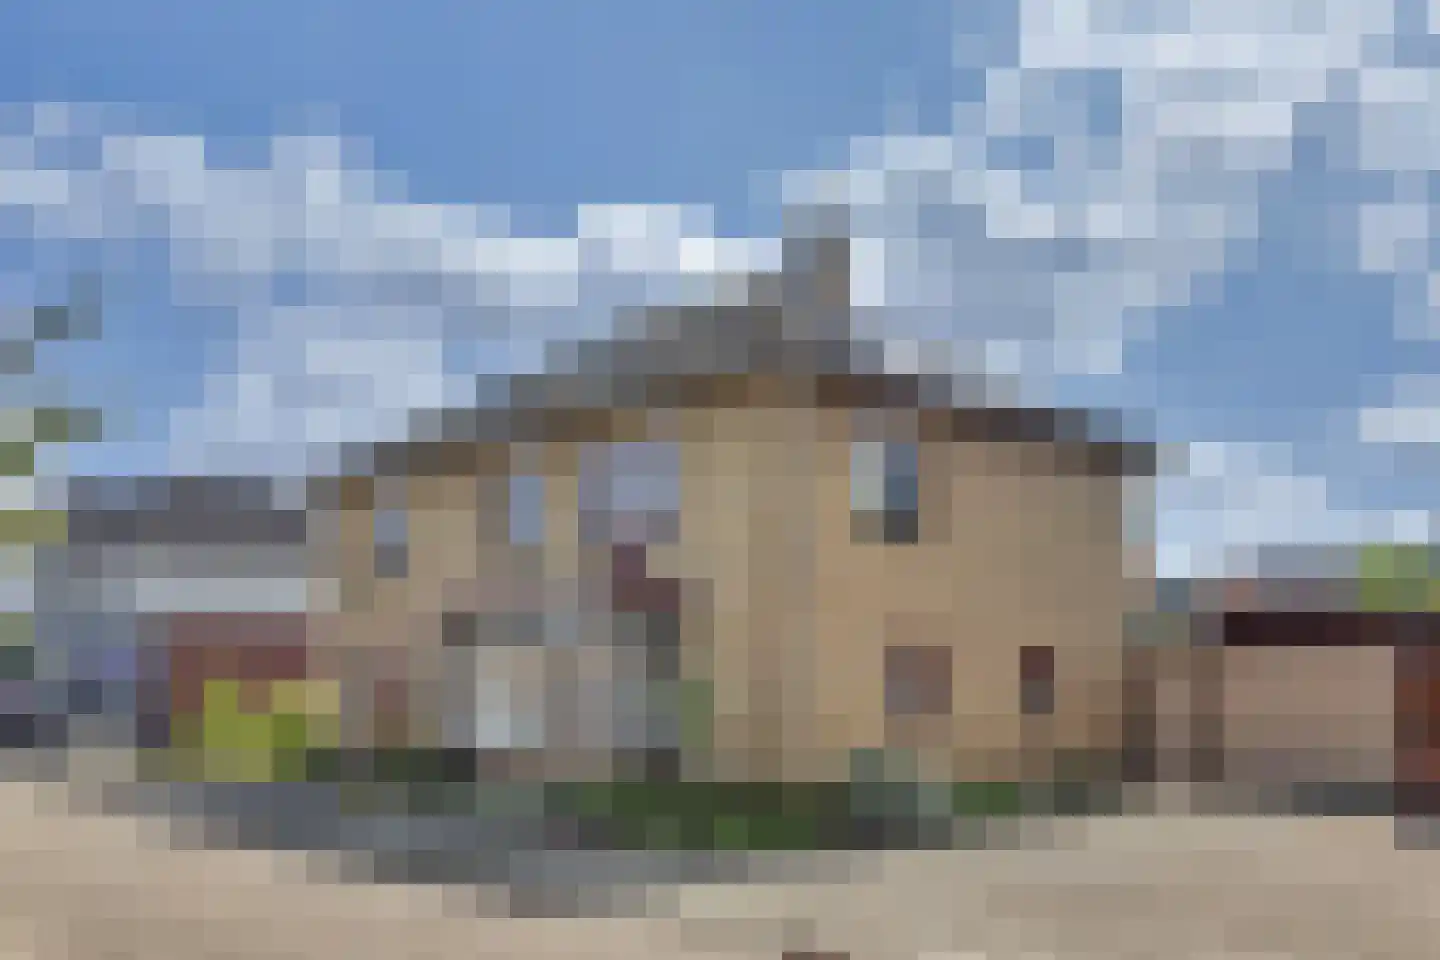
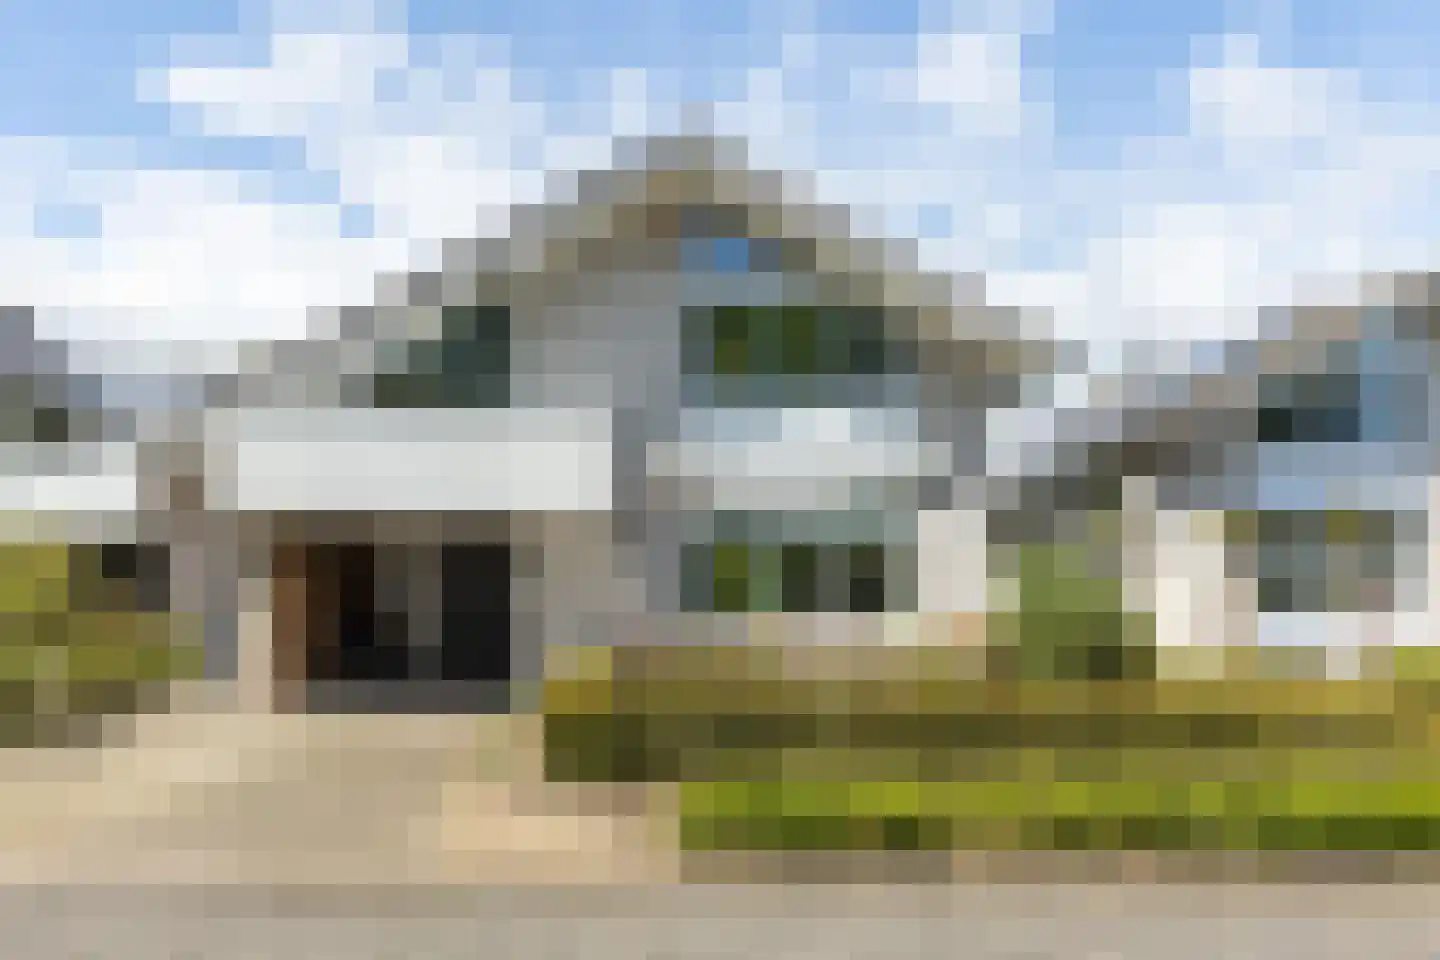
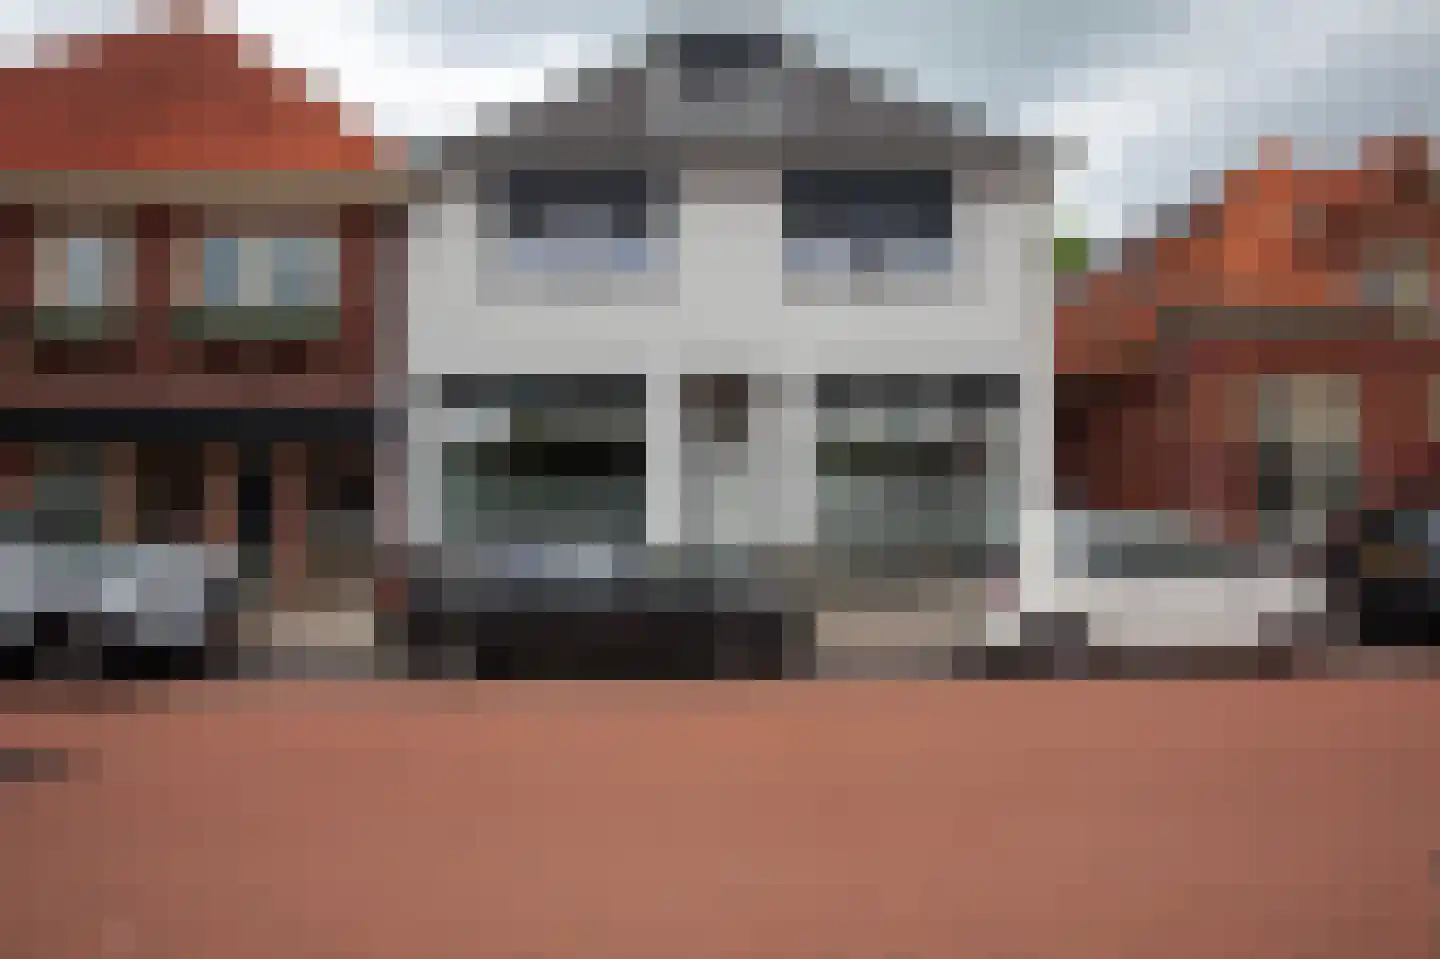
Housing offer in Winterswijk

Searching in 342 houses in Winterswijk

Connected to: Vastgoed Nederland NVM Makelaars

View the current housing stock in Winterswijk and quickly filter by price, living area, rooms and more. There are currently 342 houses in this place within our selection. View also 252 sold houses in Winterswijk for extra insight into the local housing market.

Selection

Search and filter homes

Set your preferences and discover homes that suit you.

Total supply 242.897
Filters

Set price, area and other characteristics. Adjust a filter or click on Show homes. Location changes directly above.

Reset filters

You search for

  • Place Winterswijk

Selling a home in Winterswijk? Compare realtor offers

Get free quotes from real estate agents with local market knowledge. Compare more than 16 real estate agents in Winterswijk.

Free request a quote

  • Quotes in Winterswijk
  • Non-binding
  • Personal
  • Compare free rates

Selling a home in Winterswijk? View the sales-oriented guide sell a house in Winterswijk, compare all real estate agents in Winterswijk or view the top 10 real estate agents in Winterswijk for extra context to your choice.

Compare multiple quotes

Real estate agents make sharper offers when they know you're comparing — ask for quotes for sale or purchase.

Frequently asked questions about homes in Winterswijk

Practical answers about housing supply, sales and comparing real estate agents in Winterswijk.

Residential and neighborhood statistics in Winterswijk

View current location data on residents, WOZ development, housing stock, energy consumption, business activity and safety in Winterswijk. In 2026 were there 23.118 residents. The average WOZ value in 2025 is EUR 283.000.

These figures help to better assess and compare the housing stock in Winterswijk with recent sold homes. Orient yourself then on suitable top real estate agents in Winterswijk for sales advice in this region.

Residents

23.118

Last year: 2026

Average WOZ

EUR 283.000

Last year: 2025

Average income per person.

EUR 29.800

Source: AllNumbers

Crimes (current year)

713

Total registered

Demographics and WOZ development

Inhabitants per year

Inhabitants per year in Winterswijk
Year Residents
2021 22.840
2022 23.020
2023 23.080
2024 23.160
2025 23.150
2026 23.118

Annual WOZ value

WOZ value per year in Winterswijk
Year Average WOZ
2021 EUR 199.000
2022 EUR 225.000
2023 EUR 259.000
2024 EUR 271.000
2025 EUR 283.000

Composition of residents

Age build-up

65+: 6.005 0-15: 3.155 15-25: 2.635 25-45: 5.230 45-65: 6.100

Education level

Hoger

3.920

Praktisch

5.530

Middelbaar

7.630

Origin of residents (2025)

Europa

1.960

Nederland

18.490

Buiten Europa

2.695

Housing stock and construction periods

Types of homes

Hoekwoningen 2.111
Appartementen 2.960
Tussenwoningen 3.230
Vrijstaande woningen 1.797
Twee-onder-één-kap woningen 1.553

Construction period of buildings

Voor 1700 7
1700 tot 1900 520
1900 tot 1925 662
1925 tot 1950 1.542
1950 tot 1970 2.529
1970 tot 1980 1.879
1980 tot 1990 1.042
1990 tot 2000 855
2000 tot 2010 706
2010 tot 2020 299
2020 en later 170

Energy and sustainability

Energy label distribution

Label C

2.943

Label A

2.104

Label B

1.635

Label G

1.390

Label D

1.236

Label F

1.027

Label E

919

Label A+

165

Label A+++

133

Label A++

85

Label A++++

39

Label A+++++

2

Average energy consumption per year

Average energy consumption per year in Winterswijk
Year Gas (m3) Electricity (kWh)
2020 1.210 2.770
2021 1.380 2.780
2022 1.090 2.610
2023 910 2.490
2024 890 2.550

Consumption per house type

Hoekwoning

Gas: 960 • Electricity: 2.550

Huurwoning

Gas: 740 • Electricity: 1.980

Koopwoning

Gas: 980 • Electricity: 2.730

Appartement

Gas: 640 • Electricity: 1.860

Tussenwoning

Gas: 840 • Electricity: 2.400

Vrijstaande woning

Gas: 1.300 • Electricity: 3.440

Twee-onder-één-kap woning

Gas: 1.040 • Electricity: 2.730

Business activity in Winterswijk (2025)

Handel en HORECA 645
Nijverheid en energie 340
Zakelijke dienstverlening 535
Overheid, onderwijs en zorg 460
Landbouw, bosbouw en visserij 20
Vervoer, informatie en communicatie 110
Financiele diensten en onroerendgoed 145
Cultuur, recreatie en overige diensten 280

Total number of company establishments: 2.535

Recent crime statistics

Recent crime statistics in Winterswijk
Period Crimes
jan 2026 66
jul 2025 37
jun 2025 66
mei 2025 61
mrt 2025 61
mrt 2026 77
nov 2024 63
nov 2025 49
okt 2024 79
okt 2025 66
sep 2024 92
sep 2025 50

These figures give an indicative picture of safety trends in the living environment of Winterswijk.

Frequently asked questions about living in Winterswijk

Short answers based on current local statistics, handy for a quick comparison of the living environment.

Hoeveel inwoners heeft Winterswijk?

Winterswijk telt in 2026 ongeveer 23.118 inwoners.

Wat is de gemiddelde WOZ-waarde in Winterswijk?

De gemiddelde WOZ-waarde in Winterswijk is in 2025 circa € 283.000.

Wat is het gemiddelde inkomen per inwoner in Winterswijk?

Het gemiddelde inkomen per inwoner in Winterswijk ligt rond € 29.800 per jaar.

Hoe veilig is wonen in Winterswijk?

Voor het huidige jaar gaat het om ongeveer 713 geregistreerde misdrijven. Gebruik deze cijfers als indicatie en vergelijk trends per periode.

Welke woningtypen komen het meest voor in Winterswijk?

In Winterswijk komt vooral "Tussenwoningen" veel voor, met ongeveer 3.230 woningen.

Receive free, non-binding quotes

Compare multiple real estate agents and choose the best match.