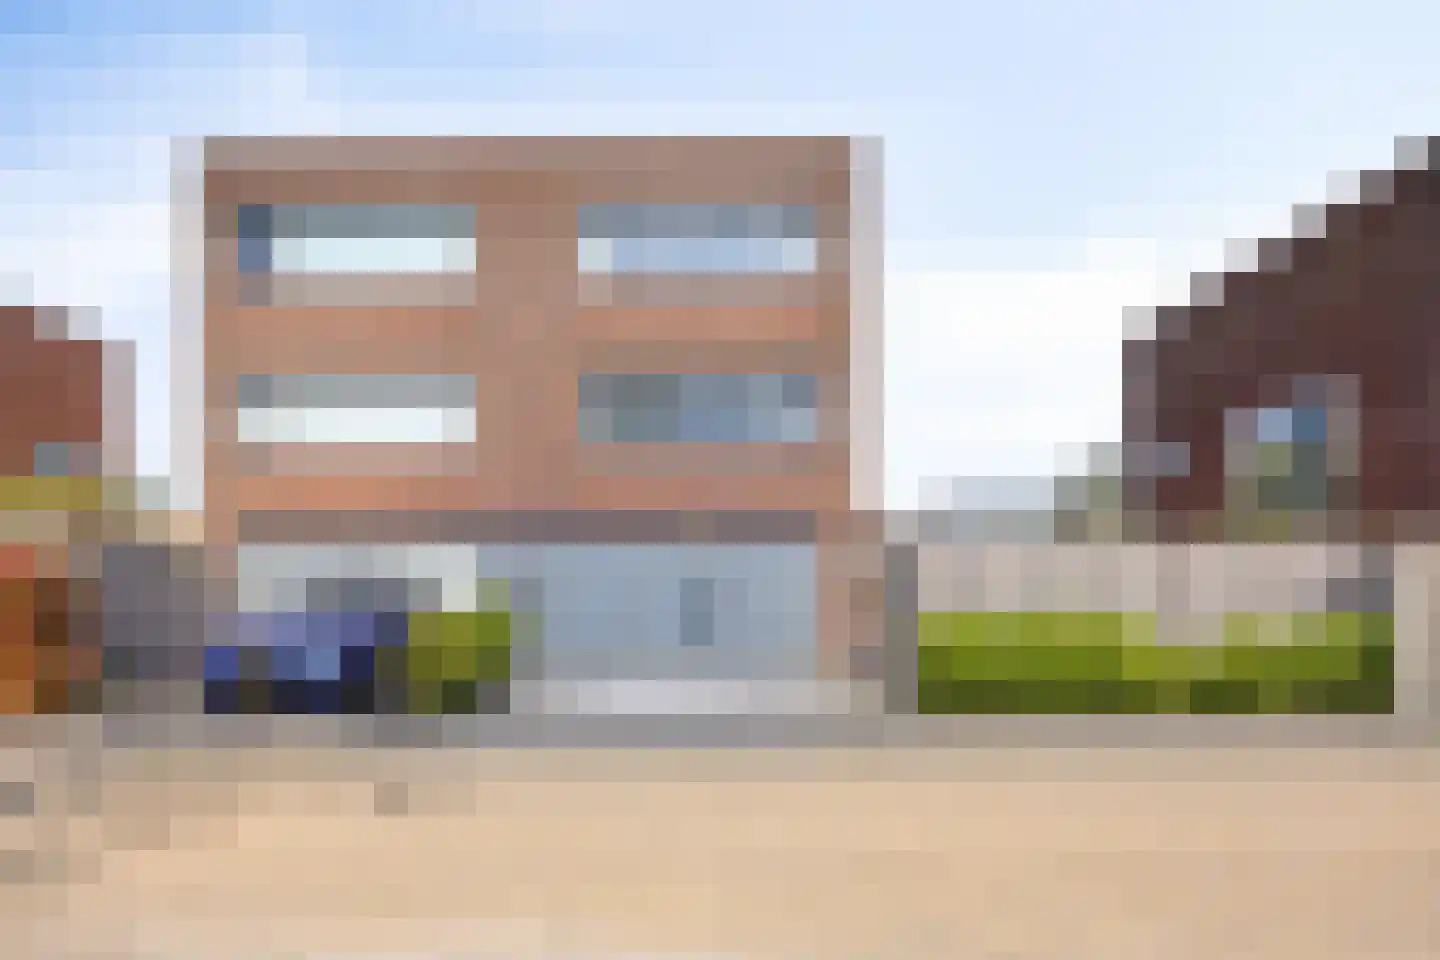
- Available
Kraakstraat 105
1503BV Zaandam
€ 450.000 k.k.
€ 4.206/m²
- Living area
- 107 m²
- Land area
- 142 m²
- Bedrooms
- 4
Searching in 1.117 houses in Zaandam
Type to search. Use arrow down and arrow up to navigate through results and press Enter to open.
Hidden search suggestions.
View current properties in Zaandam or search targeted on street, postal code and property characteristics.
View the current housing stock in Zaandam and quickly filter by price, living area, rooms and more. There are currently 1.117 houses in this place within our selection. View also 698 sold houses in Zaandam for extra insight into the local housing market.
1503BV Zaandam
€ 450.000 k.k.
€ 4.206/m²
1506LW Zaandam
€ 410.000 k.k.
€ 5.000/m²
1505KA Zaandam
€ 350.000 k.k.
€ 5.469/m²
1507VS Zaandam
€ 795.000 k.k.
€ 5.599/m²
1502NK Zaandam
€ 339.500 k.k.
€ 3.612/m²
1505WD Zaandam
€ 350.000 k.k.
€ 5.072/m²
1508AC Zaandam
€ 270.000 k.k.
€ 3.857/m²
1502GE Zaandam
€ 775.000 k.k.
€ 5.236/m²
1504KB Zaandam
€ 700.000 k.k.
€ 4.294/m²
1508VE Zaandam
€ 650.000 k.k.
€ 5.000/m²
1506XT Zaandam
€ 375.000 k.k.
€ 5.068/m²
1509WB Zaandam
€ 475.000 k.k.
€ 4.318/m²
1503AM Zaandam
€ 400.000 k.k.
€ 4.762/m²
1508WP Zaandam
€ 439.000 k.k.
€ 3.955/m²
1506DW Zaandam
€ 250.000 k.k.
€ 5.814/m²
1504HA Zaandam
€ 535.000 k.k.
€ 4.147/m²
1507VS Zaandam
€ 750.000 k.k.
€ 5.102/m²
1506TB Zaandam
€ 395.000 k.k.
€ 5.064/m²
1504LG Zaandam
€ 315.000 k.k.
€ 4.145/m²
1507VK Zaandam
€ 700.000 k.k.
€ 4.667/m²
1507EC Zaandam
€ 385.000 k.k.
€ 6.016/m²
1507PA Zaandam
€ 495.000 k.k.
€ 4.853/m²
1501BE Zaandam
€ 400.000 k.k.
€ 3.846/m²
1506PG Zaandam
€ 499.000 k.k.
€ 4.377/m²
1503HT Zaandam
€ 595.000 k.k.
€ 3.839/m²
1502GW Zaandam
€ 595.000 k.k.
€ 5.174/m²
1504NB Zaandam
€ 300.000 k.k.
€ 4.412/m²
1506DH Zaandam
€ 459.000 k.k.
€ 4.832/m²
Get free quotes from real estate agents with local market knowledge. Compare more than 302 real estate agents in Zaandam.
Selling a home in Zaandam? View the sales-oriented guide sell a house in Zaandam, compare all real estate agents in Zaandam or view the top 10 real estate agents in Zaandam for extra context to your choice.
Real estate agents make sharper offers when they know you're comparing — ask for quotes for sale or purchase.
Practical answers about housing supply, sales and comparing real estate agents in Zaandam.
The costs of a real estate agent in Zaandam depend on commission, setup costs, property presentation and the chosen service. Compare the 302 real estate agents in Zaandam via the real estate agent page and request multiple quotes to compare rates and approach well.
Within our selection, we are currently showing 1.117 houses in Zaandam. View also the sold houses in Zaandam to compare the current offering with recent transactions.
Take into account not only price and living area but also maintenance, energy label, location, outdoor space and sales status. This way you compare houses in Zaandam on more than just the asking price.
A local real estate agent knows the neighborhoods, recent transactions and demand in Zaandam. By comparing 302 real estate agents in the region you get a better insight into prices, sales strategy and expected yield; the top 10 in Zaandam provides a useful starting point.
Yes, when making a sales plan, a valuation in Zaandam is wise. You gain insight into a realistic asking price and can then compare offers from real estate agents specifically.
View current location data on residents, WOZ development, housing stock, energy consumption, business activity and safety in Zaandam. In 2025 were there 82.410 residents. The average WOZ value in 2025 is EUR 370.266.
These figures help to better assess and compare the housing stock in Zaandam with recent sold homes. Orient yourself then on suitable top real estate agents in Zaandam for sales advice in this region.
Residents
82.410
Last year: 2025
Average WOZ
EUR 370.266
Last year: 2025
Average income per person.
EUR 31.749
Source: AllNumbers
Crimes (current year)
4.747
Total registered
| Year | Residents |
|---|---|
| 2021 | 78.730 |
| 2022 | 79.070 |
| 2023 | 80.705 |
| 2024 | 81.465 |
| 2025 | 82.410 |
| Year | Average WOZ |
|---|---|
| 2021 | EUR 264.324 |
| 2022 | EUR 294.509 |
| 2023 | EUR 346.731 |
| 2024 | EUR 369.553 |
| 2025 | EUR 370.266 |
Hoger
16.920
Praktisch
18.340
Middelbaar
26.570
Europa
11.220
Nederland
40.460
Buiten Europa
30.725
Label C
10.587
Label A
8.954
Label B
4.739
Label D
3.411
Label G
2.958
Label E
2.698
Label F
1.816
Label A+++
1.337
Label A+
1.178
Label A++
847
Label A++++
64
Label A+++++
11
| Year | Gas (m3) | Electricity (kWh) |
|---|---|---|
| 2020 | 1.058 | 2.453 |
| 2021 | 1.158 | 2.467 |
| 2022 | 888 | 2.322 |
| 2023 | 778 | 2.191 |
| 2024 | 757 | 2.219 |
Hoekwoning
Gas: 1.035 • Electricity: 2.581
Huurwoning
Gas: 690 • Electricity: 1.855
Koopwoning
Gas: 875 • Electricity: 2.543
Appartement
Gas: 606 • Electricity: 1.781
Tussenwoning
Gas: 856 • Electricity: 2.449
Vrijstaande woning
Gas: 1.466 • Electricity: 3.420
Twee-onder-één-kap woning
Gas: 899 • Electricity: 2.305
Total number of company establishments: 12.465
| Period | Crimes |
|---|---|
| jan 2025 | 369 |
| jan 2026 | 361 |
| jul 2025 | 409 |
| jun 2025 | 366 |
| mei 2025 | 424 |
| mrt 2025 | 406 |
| nov 2024 | 403 |
| nov 2025 | 367 |
| okt 2024 | 374 |
| okt 2025 | 457 |
| sep 2024 | 354 |
| sep 2025 | 420 |
These figures give an indicative picture of safety trends in the living environment of Zaandam.
Short answers based on current local statistics, handy for a quick comparison of the living environment.
Zaandam telt in 2025 ongeveer 82.410 inwoners.
De gemiddelde WOZ-waarde in Zaandam is in 2025 circa € 370.266.
Het gemiddelde inkomen per inwoner in Zaandam ligt rond € 31.749 per jaar.
Voor het huidige jaar gaat het om ongeveer 4.747 geregistreerde misdrijven. Gebruik deze cijfers als indicatie en vergelijk trends per periode.
In Zaandam komt vooral "Appartementen" veel voor, met ongeveer 21.916 woningen.