- Available
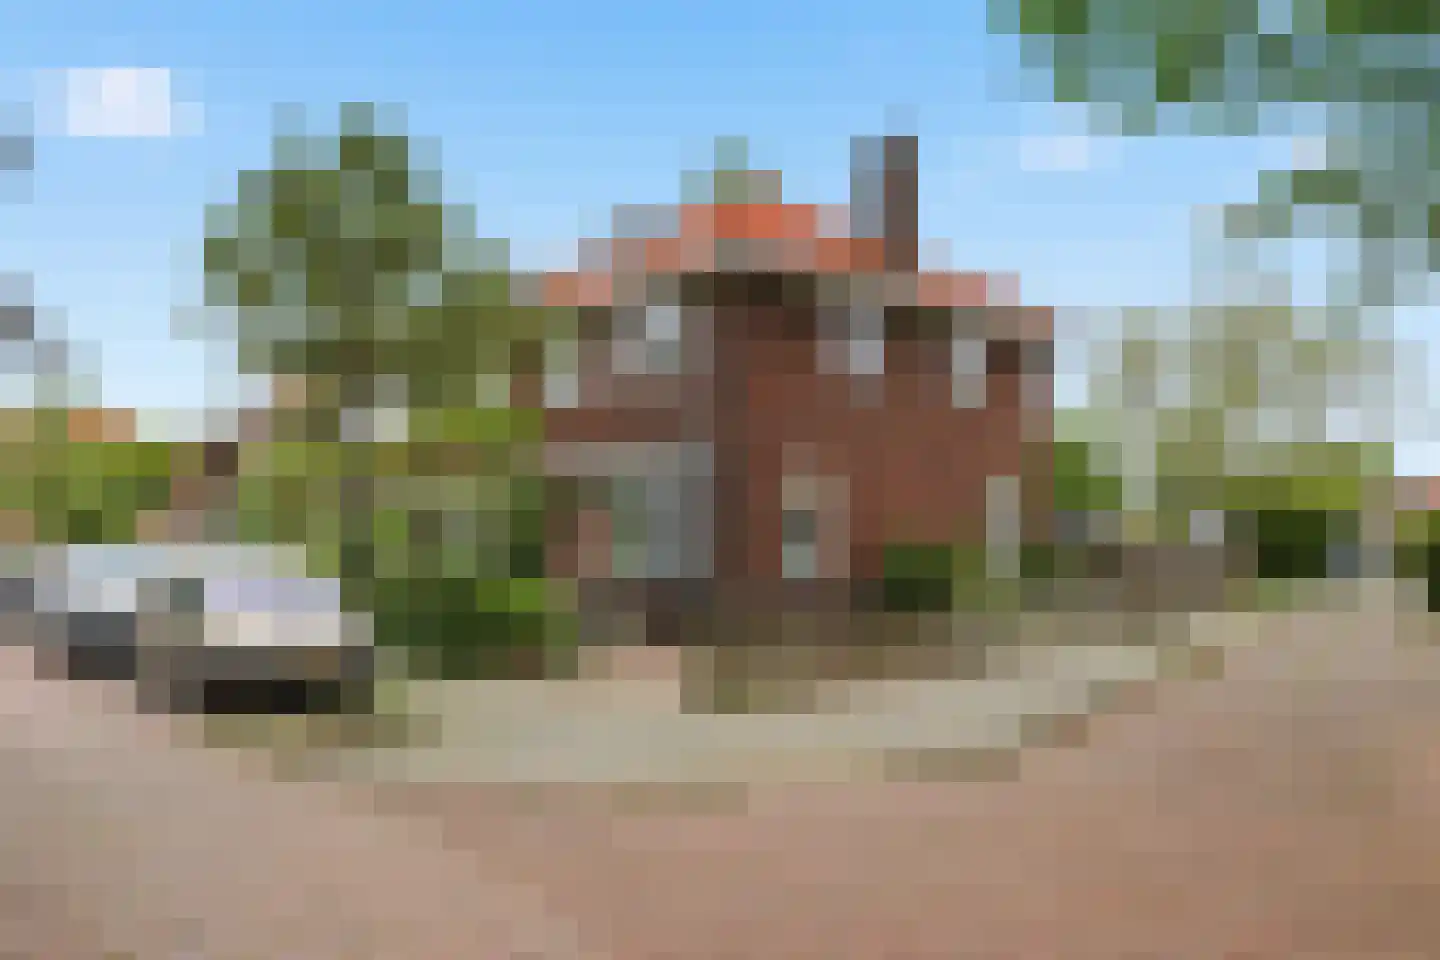
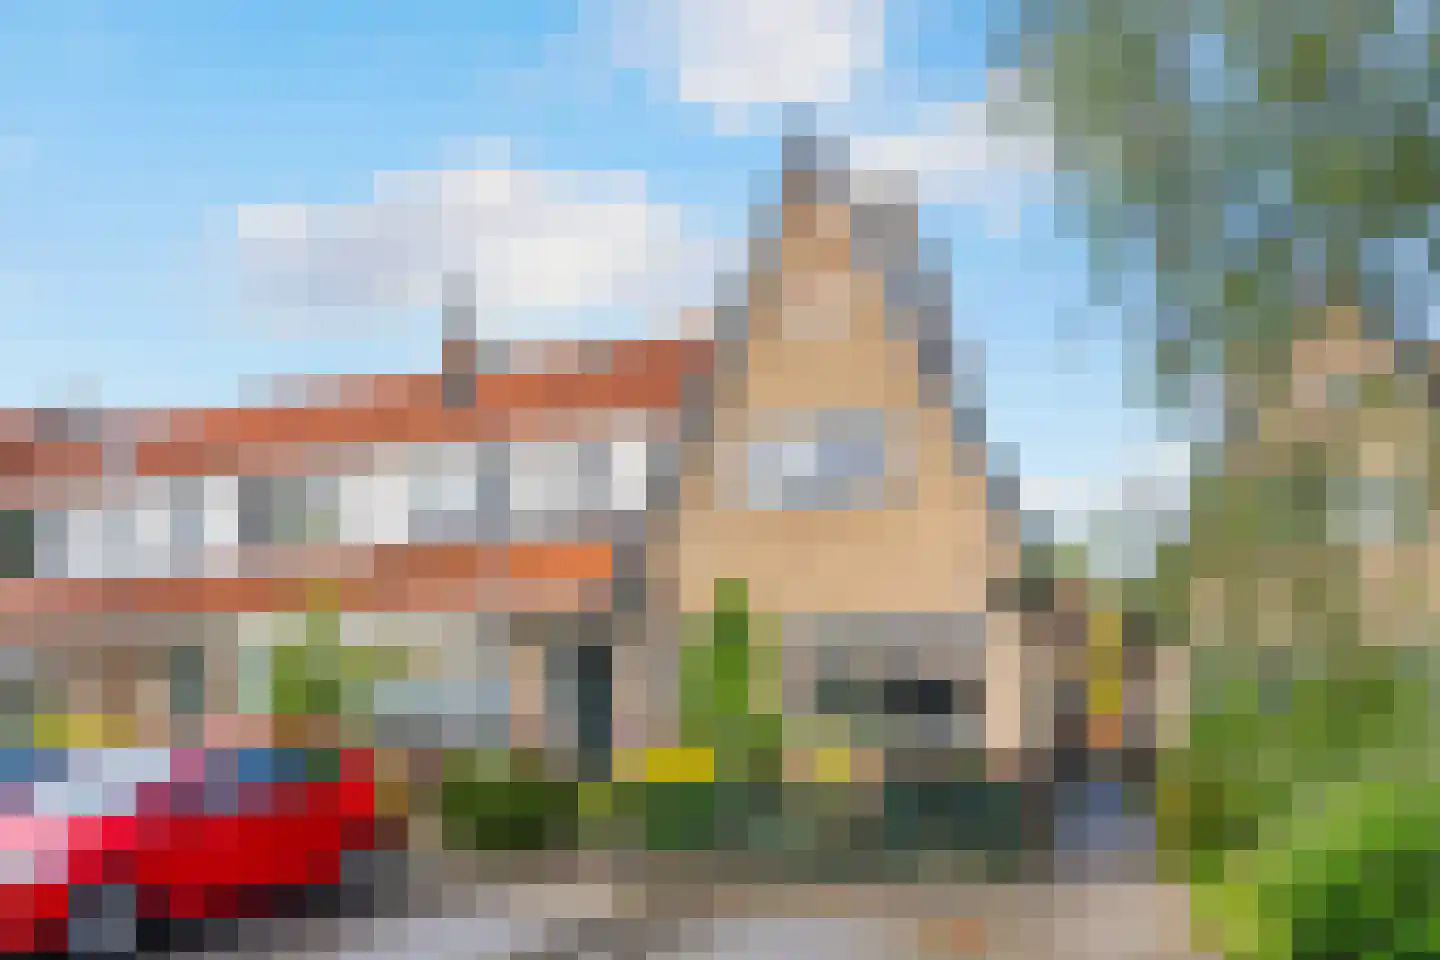
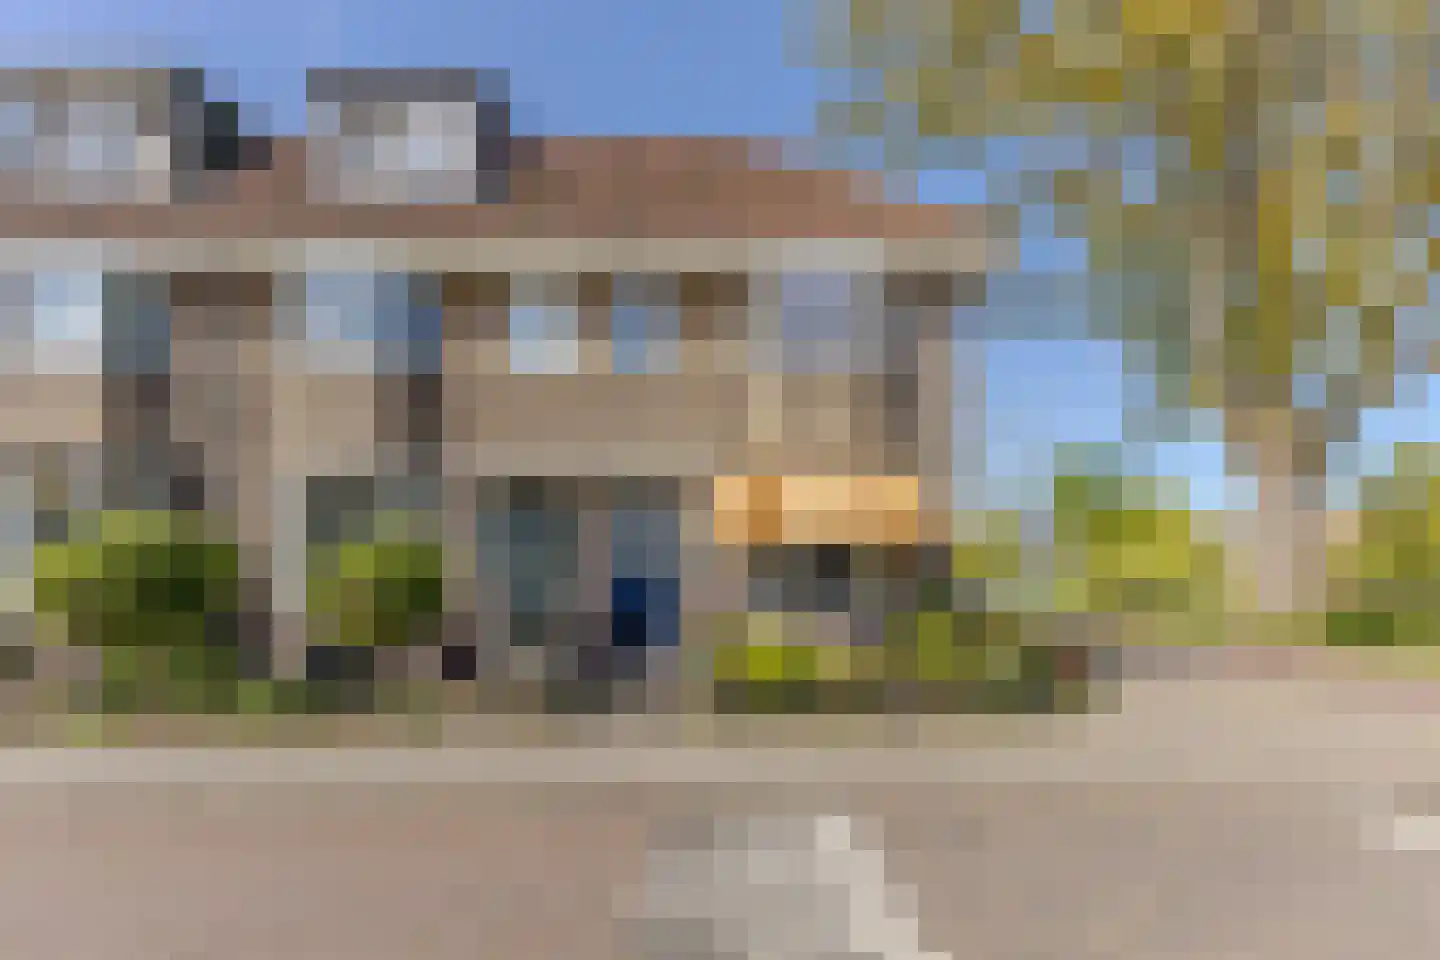
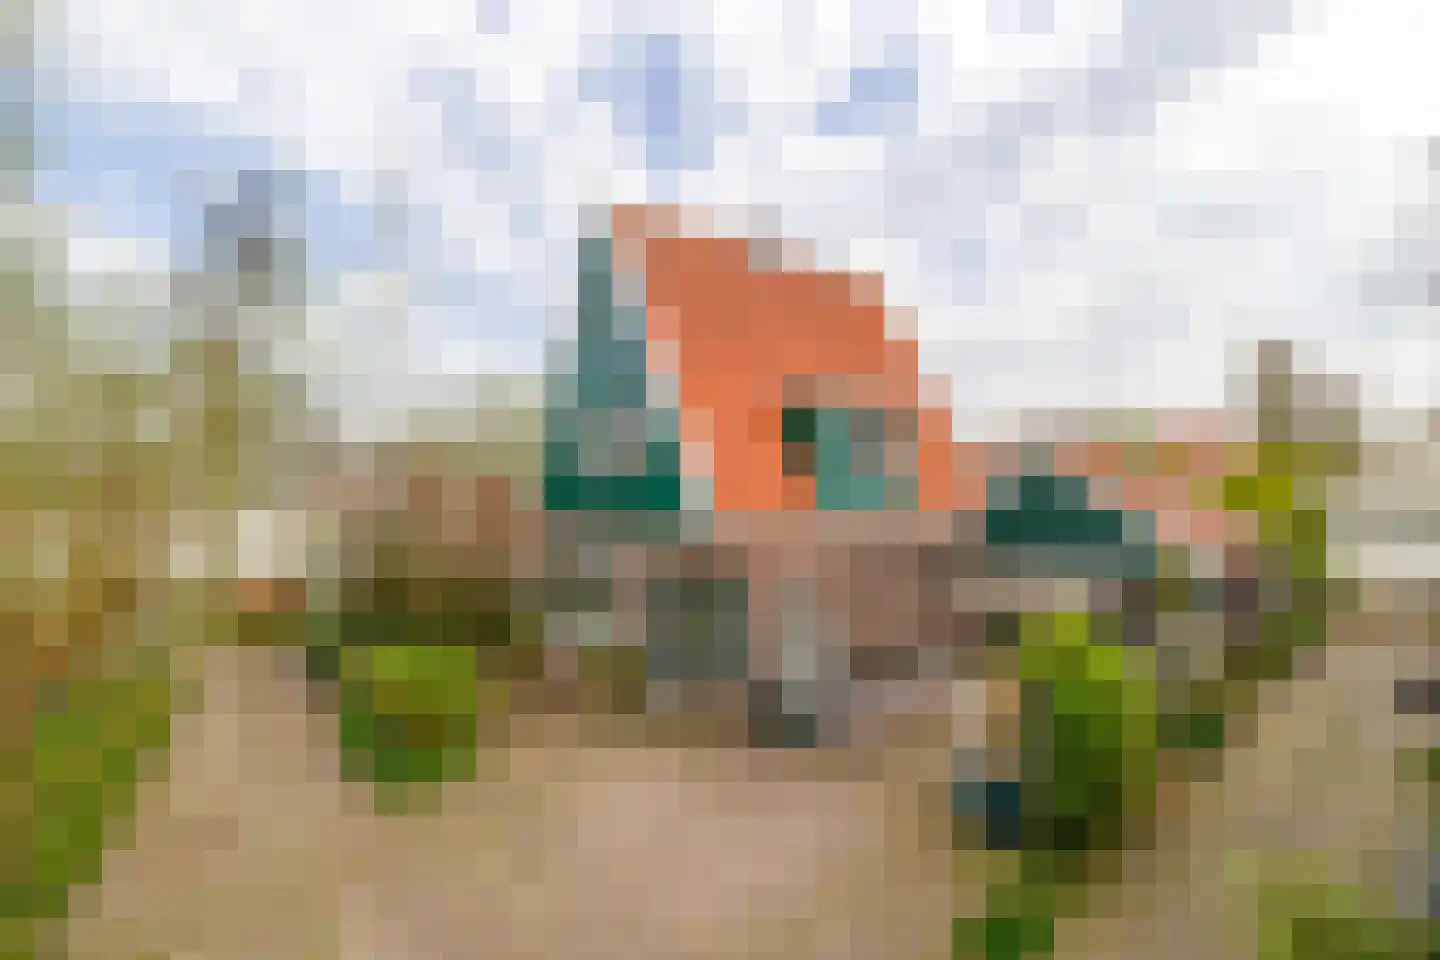
Dr. J.J. van der Horststraat 16
1544XE Zaandijk
€ 925.000 k.k.
€ 5.710/m²
- Living area
- 162 m²
- Land area
- 805 m²
- Bedrooms
- 4
Searching in 94 houses in Zaandijk
Type to search. Use arrow down and arrow up to navigate through results and press Enter to open.
Hidden search suggestions.
View current properties in Zaandijk or search targeted on street, postal code and property characteristics.
View the current housing stock in Zaandijk and quickly filter by price, living area, rooms and more. There are currently 94 houses in this place within our selection. View also 62 sold houses in Zaandijk for extra insight into the local housing market.
1544XE Zaandijk
€ 925.000 k.k.
€ 5.710/m²
1544RT Zaandijk
€ 350.000 k.k.
€ 4.667/m²
1544AL Zaandijk
€ 495.000 k.k.
€ 5.625/m²
1544MT Zaandijk
€ 790.000 k.k.
€ 4.907/m²
1544CP Zaandijk
€ 285.000 k.k.
€ 4.318/m²
1544RS Zaandijk
€ 375.000 k.k.
€ 4.573/m²
1544VH Zaandijk
€ 417.500 k.k.
€ 4.970/m²
1544RW Zaandijk
€ 675.000 k.k.
€ 3.709/m²
1544ZA Zaandijk
€ 450.000 k.k.
€ 4.639/m²
1544RC Zaandijk
€ 419.500 k.k.
1544BB Zaandijk
€ 850.000 k.k.
1544AM Zaandijk
€ 2.085 p/m
€ 26/m²
1544RA Zaandijk
€ 795.000 k.k.
1544AS Zaandijk
€ 550.000 k.k.
1544XA Zaandijk
€ 439.000 k.k.
€ 5.289/m²
1544BL Zaandijk
€ 695.000 k.k.
€ 2.633/m²
1544PS Zaandijk
€ 575.000 k.k.
€ 6.461/m²
1544BC Zaandijk
€ 770.000 k.k.
€ 6.696/m²
1544RP Zaandijk
€ 350.000 k.k.
€ 4.217/m²
1544WL Zaandijk
€ 500.000 k.k.
€ 3.846/m²
1544BC Zaandijk
€ 895.000
€ 5.524/m²
1544BG Zaandijk
€ 1.169.000 k.k.
€ 4.531/m²
1544AN Zaandijk
€ 375.000 k.k.
€ 4.808/m²
1544RN Zaandijk
€ 375.000 k.k.
€ 4.261/m²
1544CN Zaandijk
€ 285.000 k.k.
1544LR Zaandijk
€ 750.000 k.k.
€ 4.573/m²
1544NL Zaandijk
€ 475.000 k.k.
€ 4.060/m²
1544NE Zaandijk
€ 467.500 k.k.
€ 4.137/m²
Get free quotes from real estate agents with local market knowledge. Compare more than 93 real estate agents in Zaandijk.
Selling a home in Zaandijk? Compare all real estate agents in Zaandijk or view the top 10 real estate agents in Zaandijk for extra context for your choice.
Real estate agents make sharper offers when they know you're comparing — ask for quotes for sale or purchase.
Practical answers about housing supply, sales and comparing real estate agents in Zaandijk.
The costs of a real estate agent in Zaandijk depend on commission, setup costs, property presentation and the chosen service. Compare the 93 real estate agents in Zaandijk via the real estate agent page and request multiple quotes to compare rates and approach well.
Within our selection, we are currently showing 94 houses in Zaandijk. View also the sold houses in Zaandijk to compare the current offering with recent transactions.
Take into account not only price and living area but also maintenance, energy label, location, outdoor space and sales status. This way you compare houses in Zaandijk on more than just the asking price.
A local real estate agent knows the neighborhoods, recent transactions and demand in Zaandijk. By comparing 93 real estate agents in the region you get a better insight into prices, sales strategy and expected yield; the top 10 in Zaandijk provides a useful starting point.
Yes, when making a sales plan, a valuation in Zaandijk is wise. You gain insight into a realistic asking price and can then compare offers from real estate agents specifically.
View current location data on residents, WOZ development, housing stock, energy consumption, business activity and safety in Zaandijk. In 2025 were there 8.700 residents. The average WOZ value in 2025 is EUR 382.923.
These figures help to better assess and compare the housing stock in Zaandijk with recent sold homes. Orient yourself then on suitable top real estate agents in Zaandijk for sales advice in this region.
Residents
8.700
Last year: 2025
Average WOZ
EUR 382.923
Last year: 2025
Average income per person.
EUR 34.180
Source: AllNumbers
Crimes (current year)
396
Total registered
| Year | Residents |
|---|---|
| 2021 | 8.605 |
| 2022 | 8.490 |
| 2023 | 8.485 |
| 2024 | 8.520 |
| 2025 | 8.700 |
| Year | Average WOZ |
|---|---|
| 2021 | EUR 276.518 |
| 2022 | EUR 307.793 |
| 2023 | EUR 356.799 |
| 2024 | EUR 371.178 |
| 2025 | EUR 382.923 |
Hoger
1.850
Praktisch
1.950
Middelbaar
2.720
Europa
620
Nederland
6.020
Buiten Europa
2.060
Label B
1.120
Label A
820
Label C
698
Label D
373
Label G
326
Label A+++
197
Label F
191
Label E
172
Label A++
161
Label A+
46
Label A++++
23
Label A+++++
0
| Year | Gas (m3) | Electricity (kWh) |
|---|---|---|
| 2020 | 1.106 | 2.587 |
| 2021 | 1.246 | 2.635 |
| 2022 | 959 | 2.455 |
| 2023 | 835 | 2.325 |
| 2024 | 825 | 2.378 |
Hoekwoning
Gas: 988 • Electricity: 2.692
Huurwoning
Gas: 671 • Electricity: 1.880
Koopwoning
Gas: 977 • Electricity: 2.735
Appartement
Gas: 669 • Electricity: 1.679
Tussenwoning
Gas: 815 • Electricity: 2.484
Vrijstaande woning
Gas: 1.425 • Electricity: 3.422
Twee-onder-één-kap woning
Gas: 1.131 • Electricity: 2.836
Total number of company establishments: 1.000
| Period | Crimes |
|---|---|
| jan 2025 | 36 |
| jan 2026 | 30 |
| jul 2025 | 49 |
| jun 2025 | 22 |
| mei 2025 | 24 |
| mrt 2025 | 35 |
| nov 2024 | 39 |
| nov 2025 | 31 |
| okt 2024 | 37 |
| okt 2025 | 35 |
| sep 2024 | 14 |
| sep 2025 | 26 |
These figures give an indicative picture of safety trends in the living environment of Zaandijk.
Short answers based on current local statistics, handy for a quick comparison of the living environment.
Zaandijk telt in 2025 ongeveer 8.700 inwoners.
De gemiddelde WOZ-waarde in Zaandijk is in 2025 circa € 382.923.
Het gemiddelde inkomen per inwoner in Zaandijk ligt rond € 34.180 per jaar.
Voor het huidige jaar gaat het om ongeveer 396 geregistreerde misdrijven. Gebruik deze cijfers als indicatie en vergelijk trends per periode.
In Zaandijk komt vooral "Tussenwoningen" veel voor, met ongeveer 1.641 woningen.