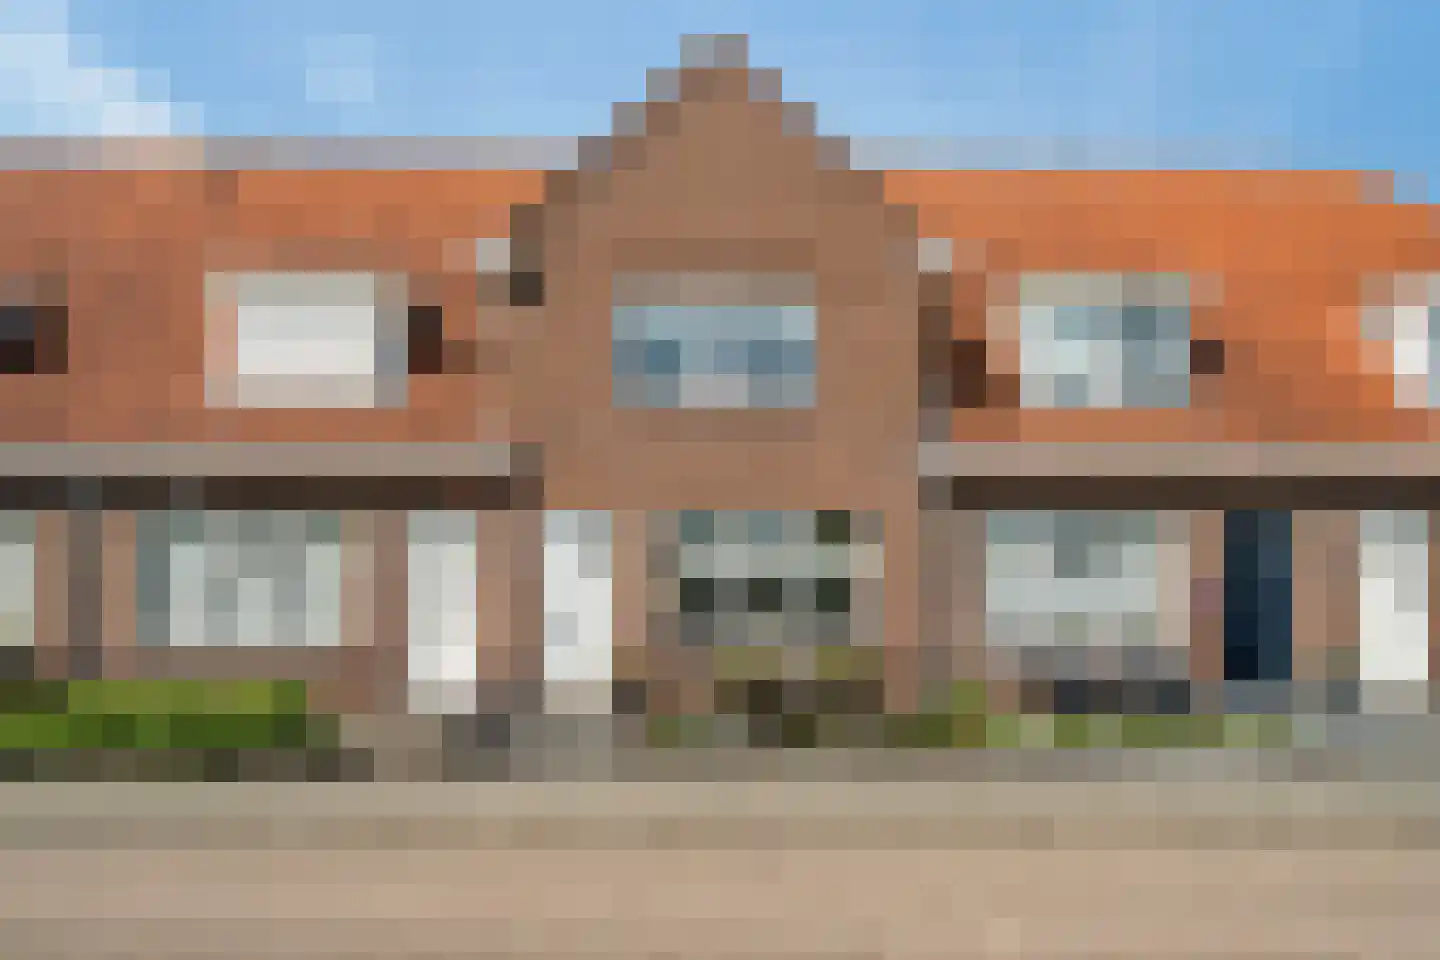
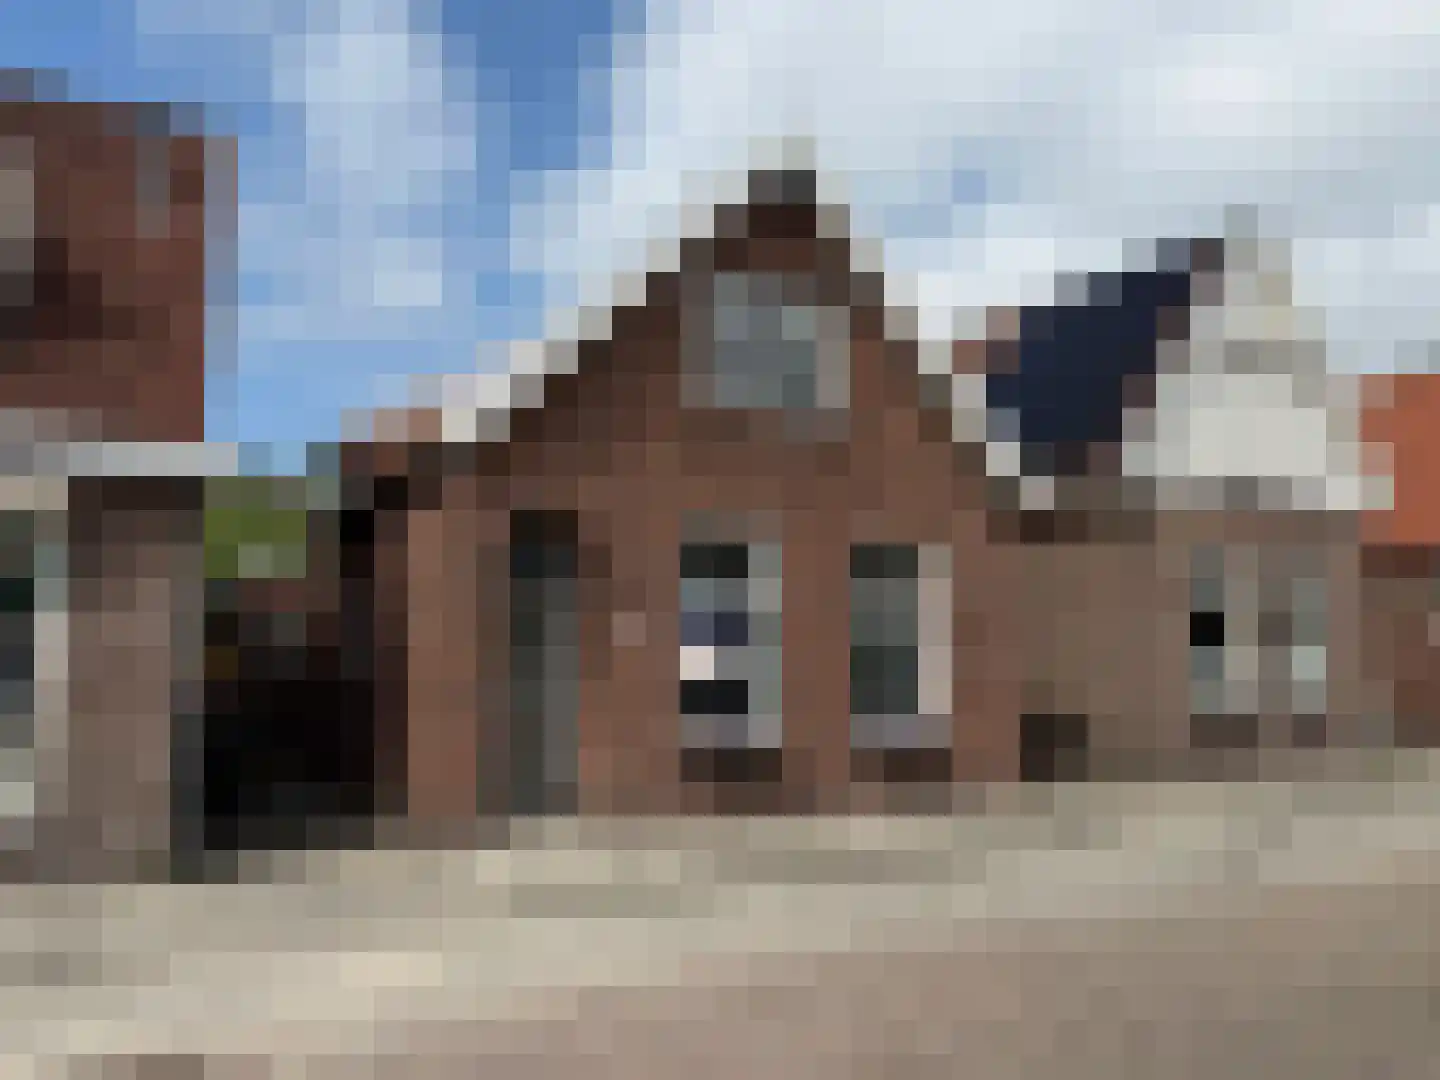
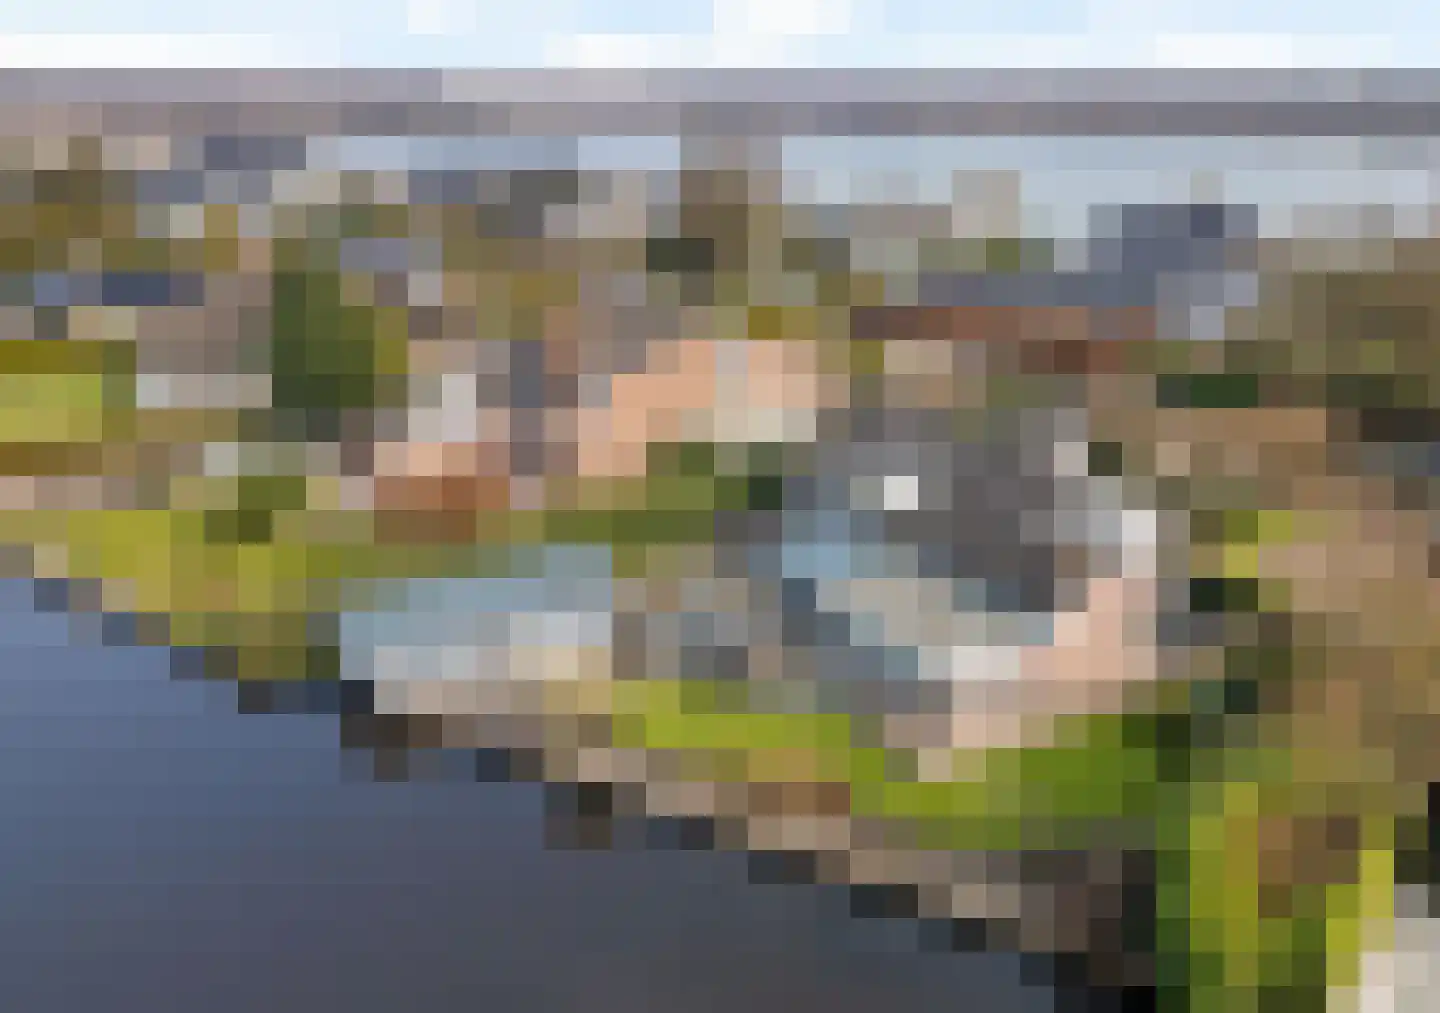
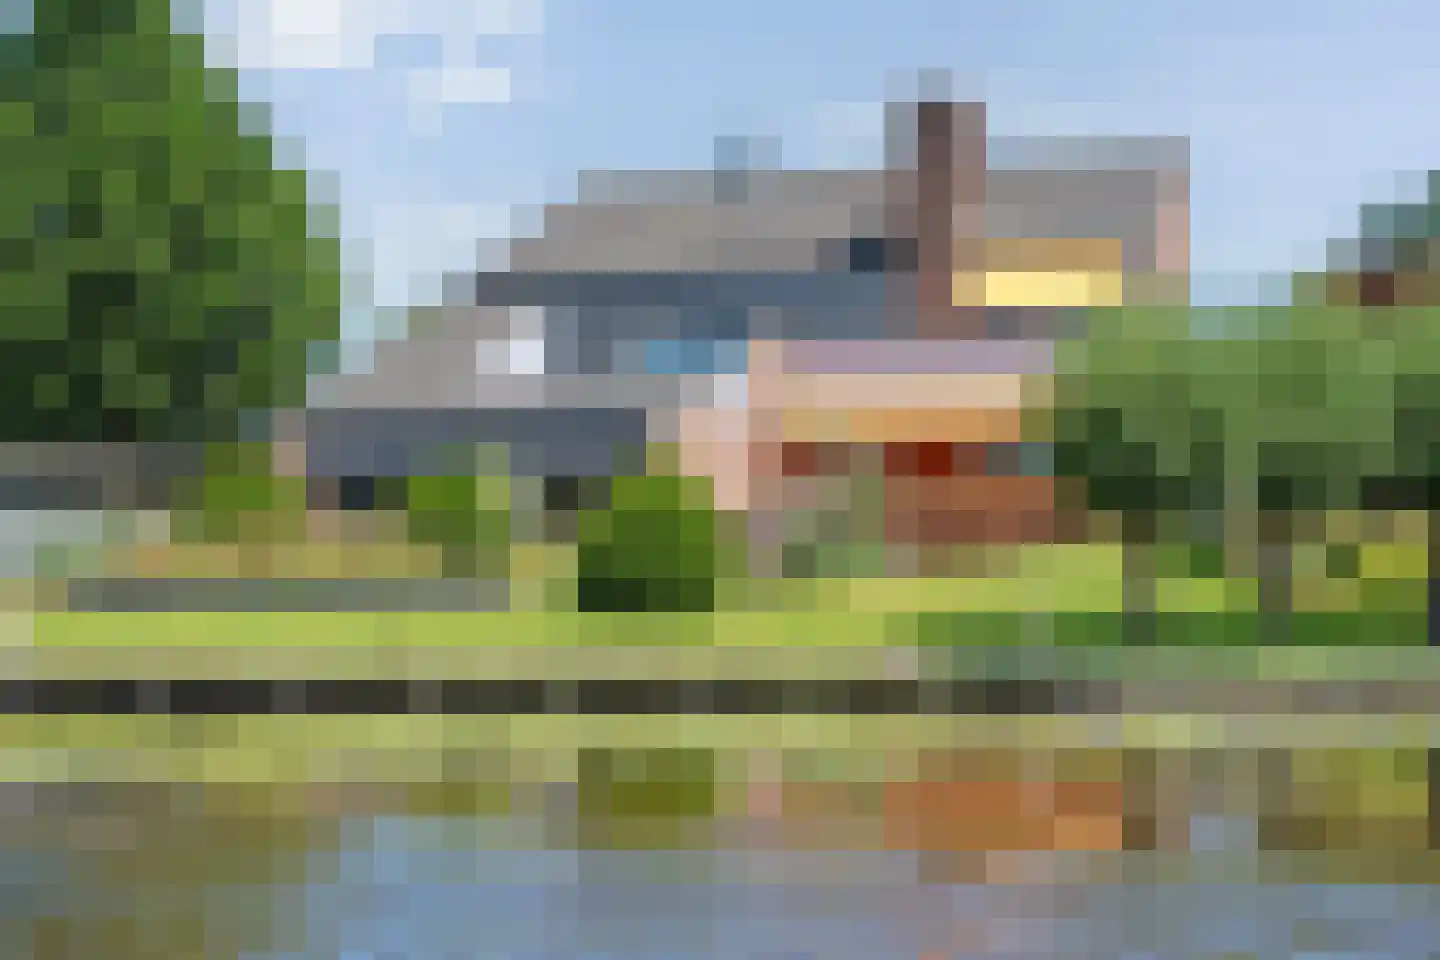
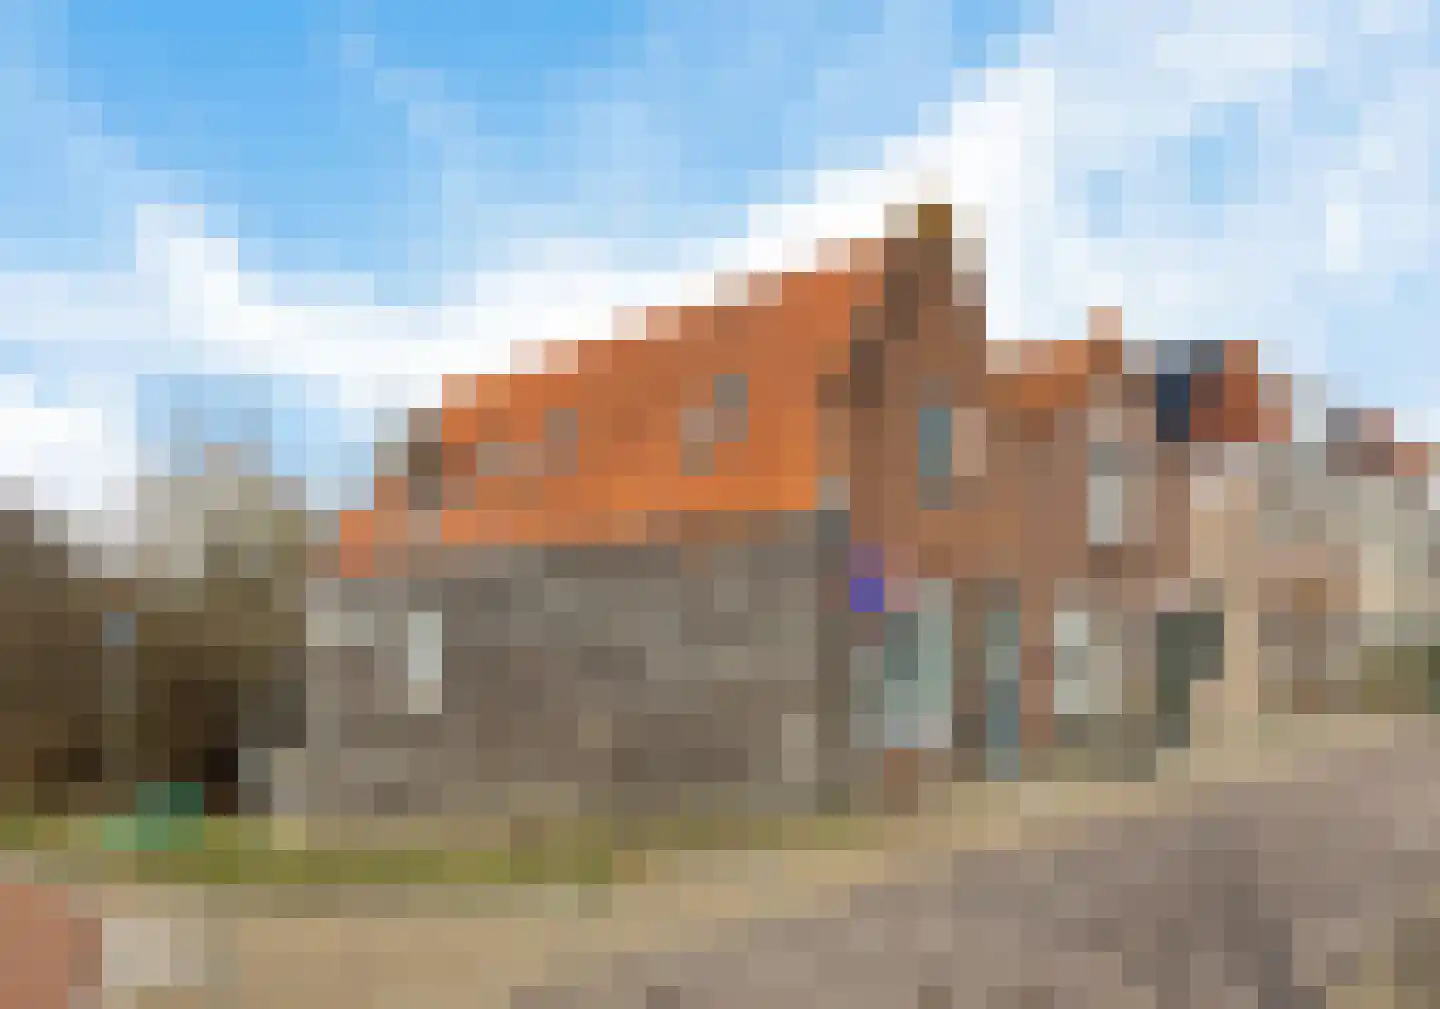
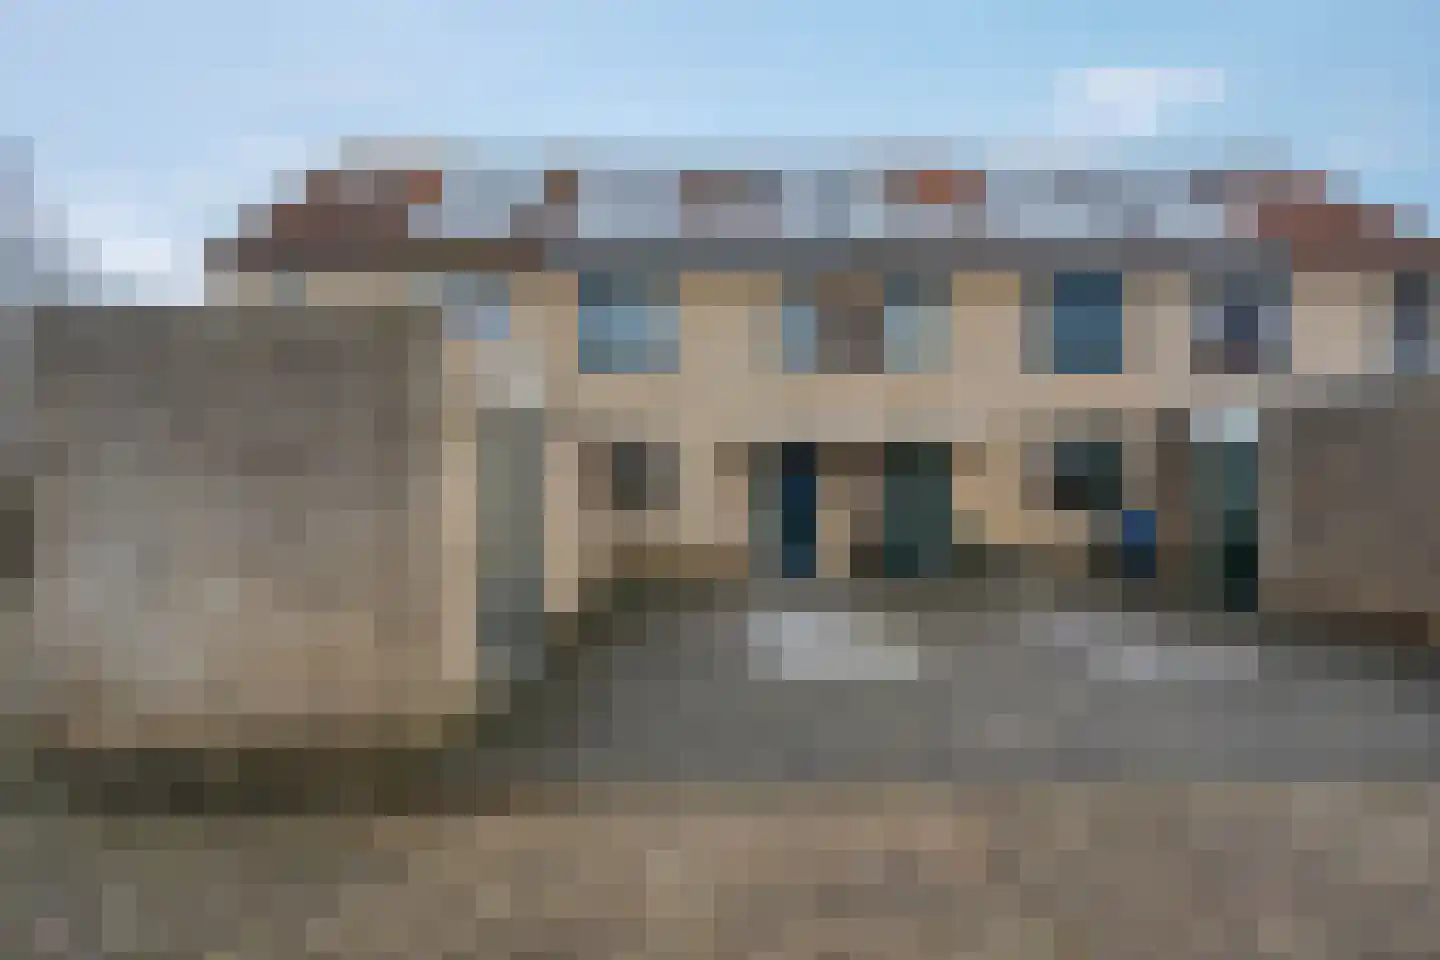
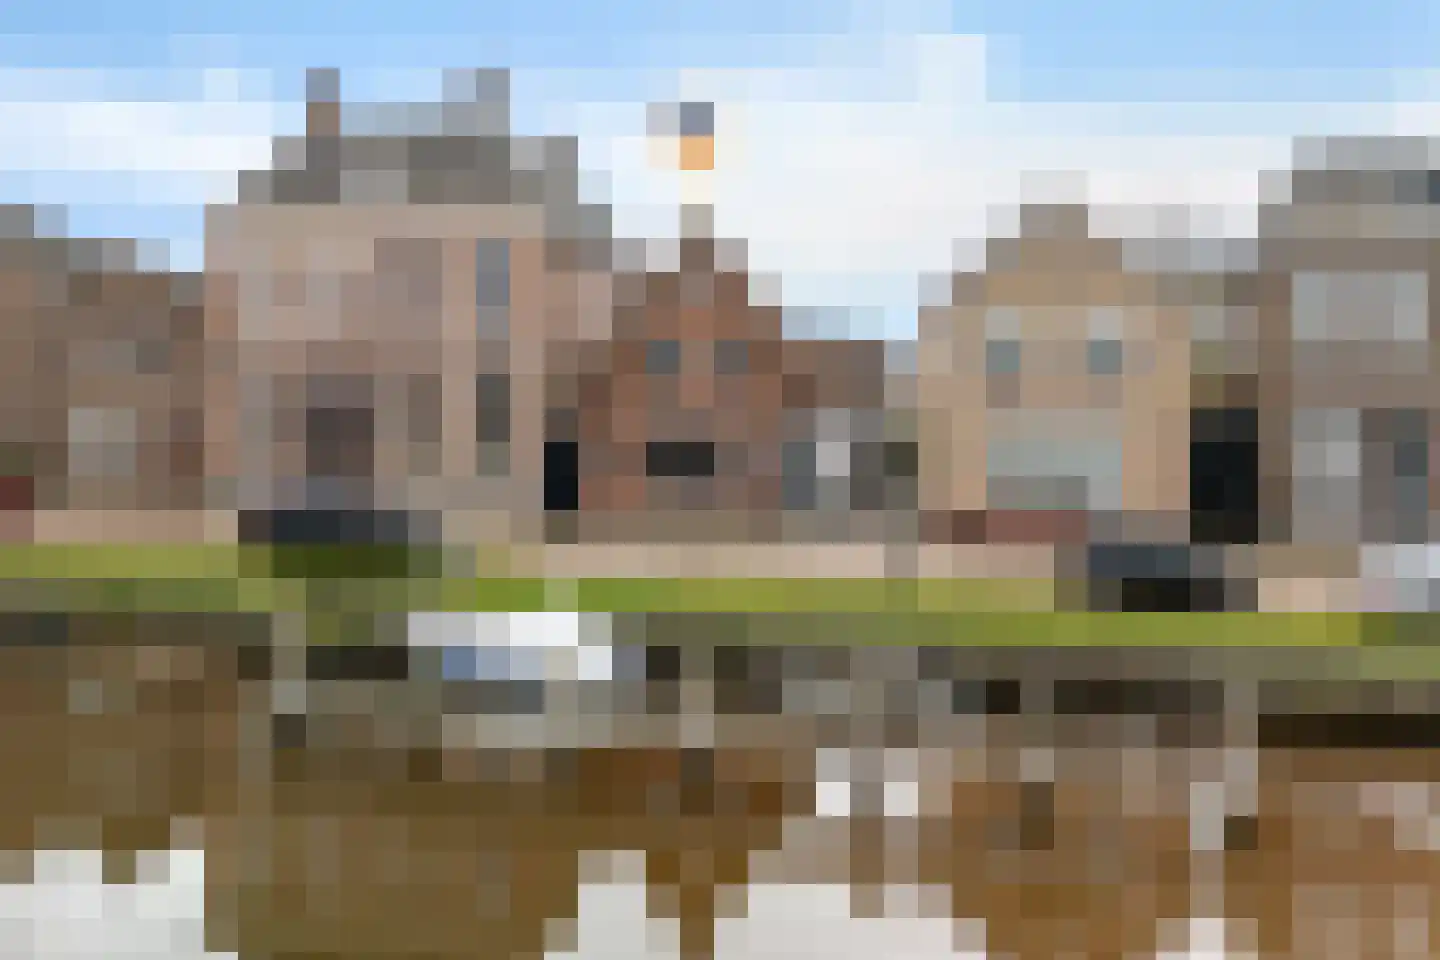
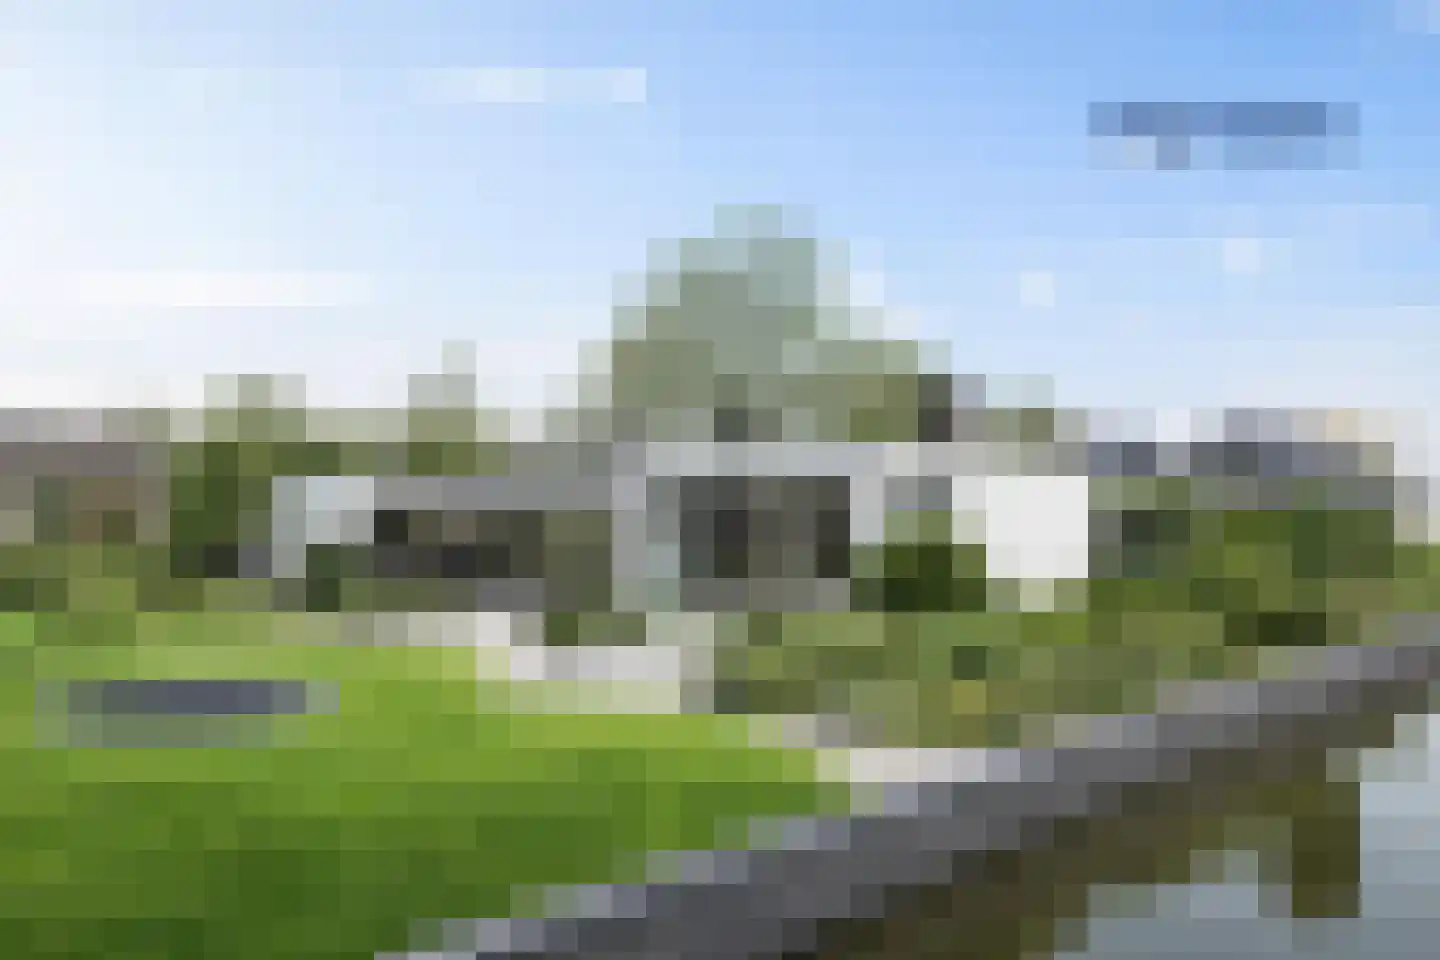
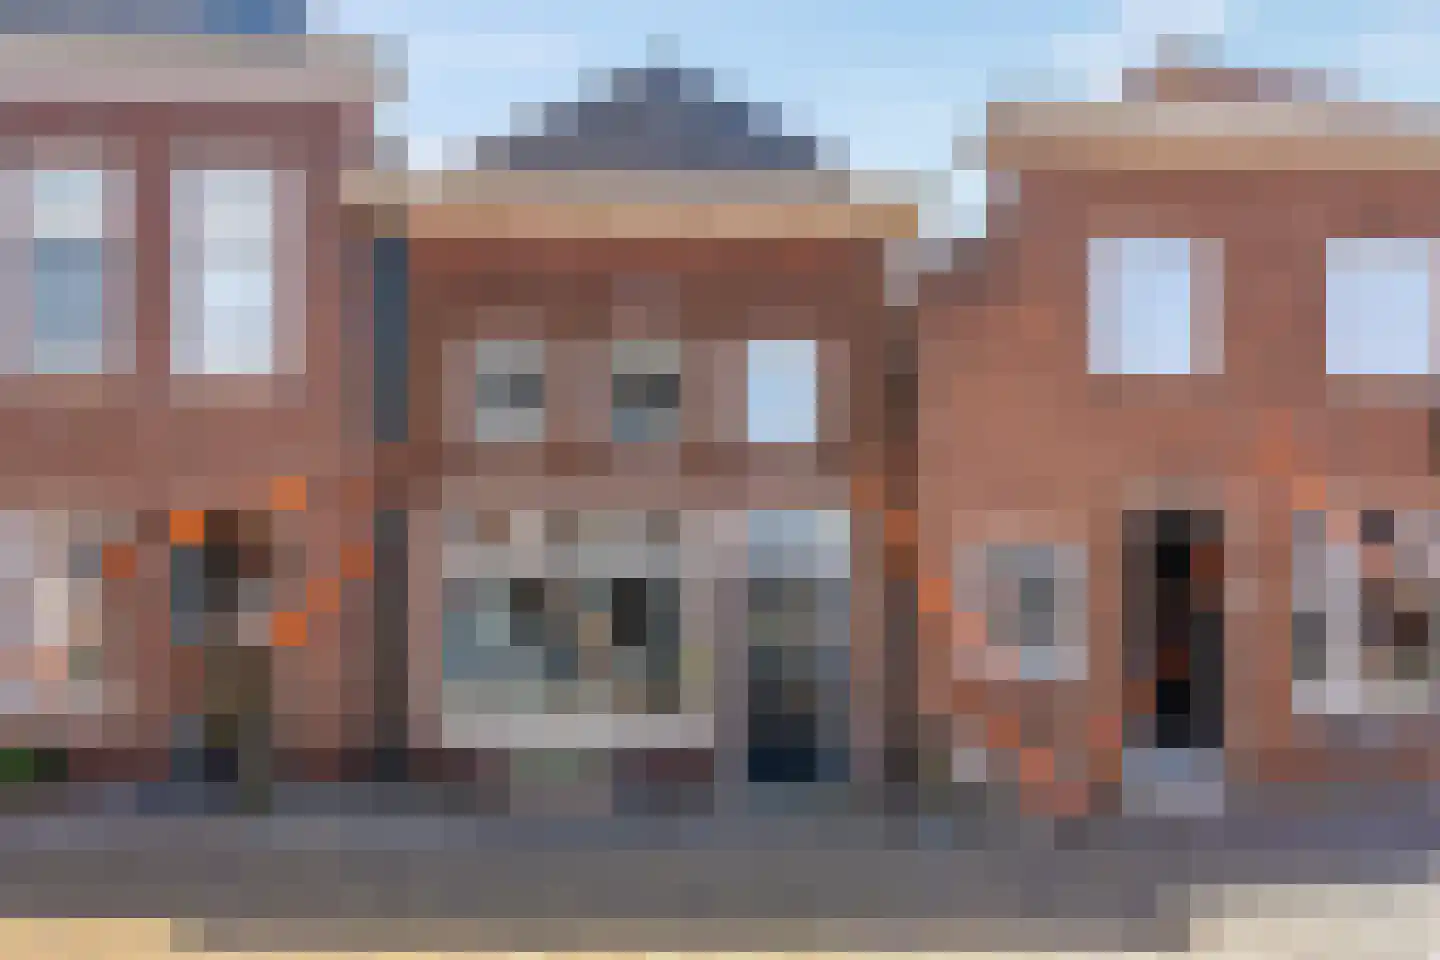
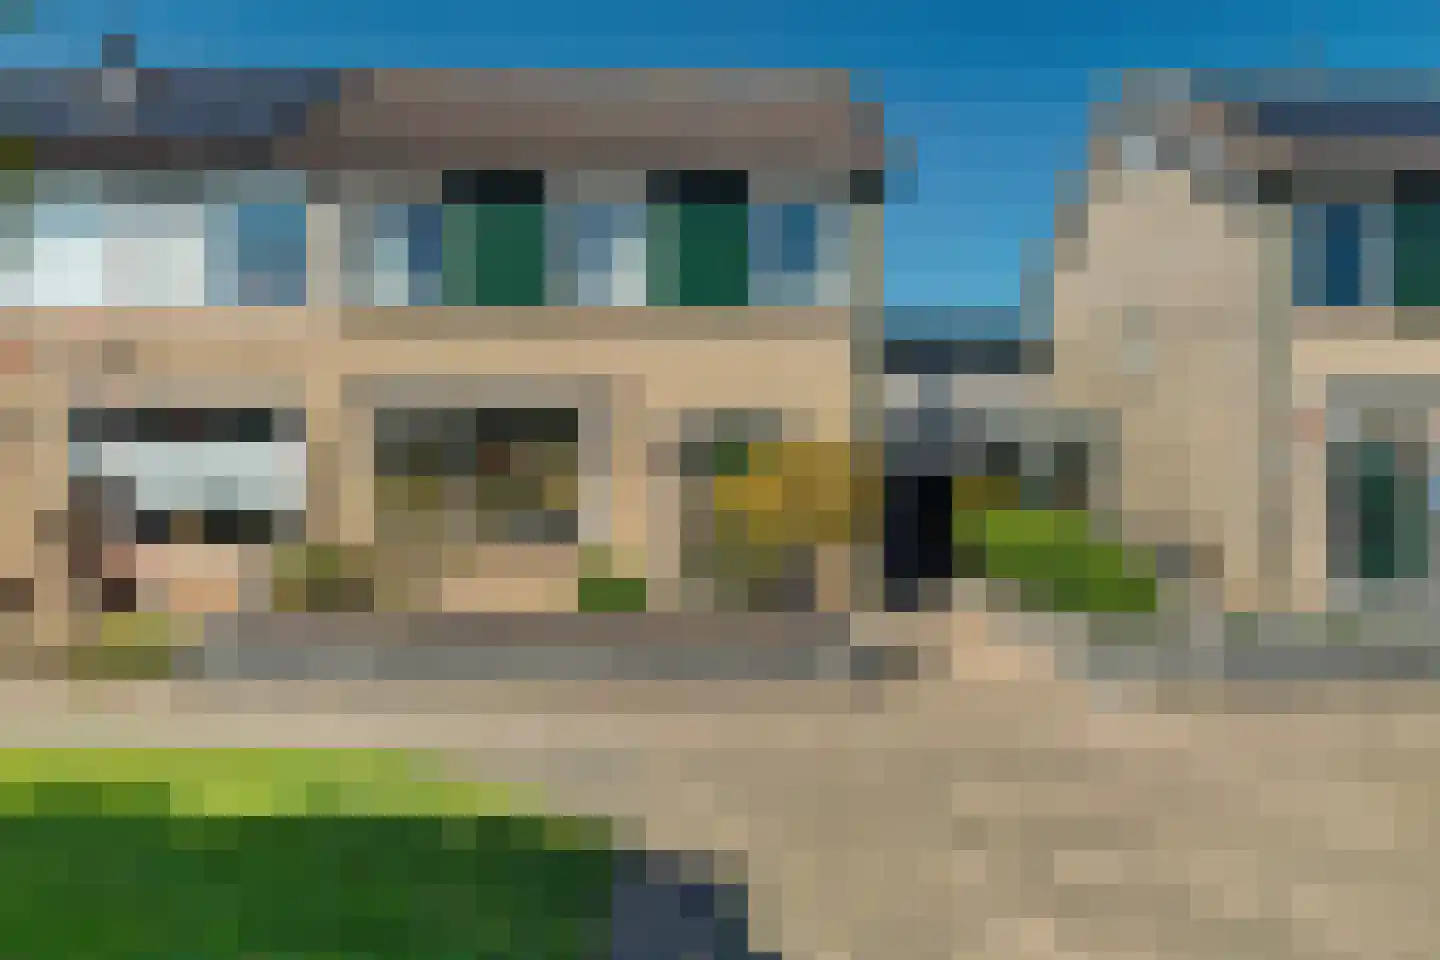
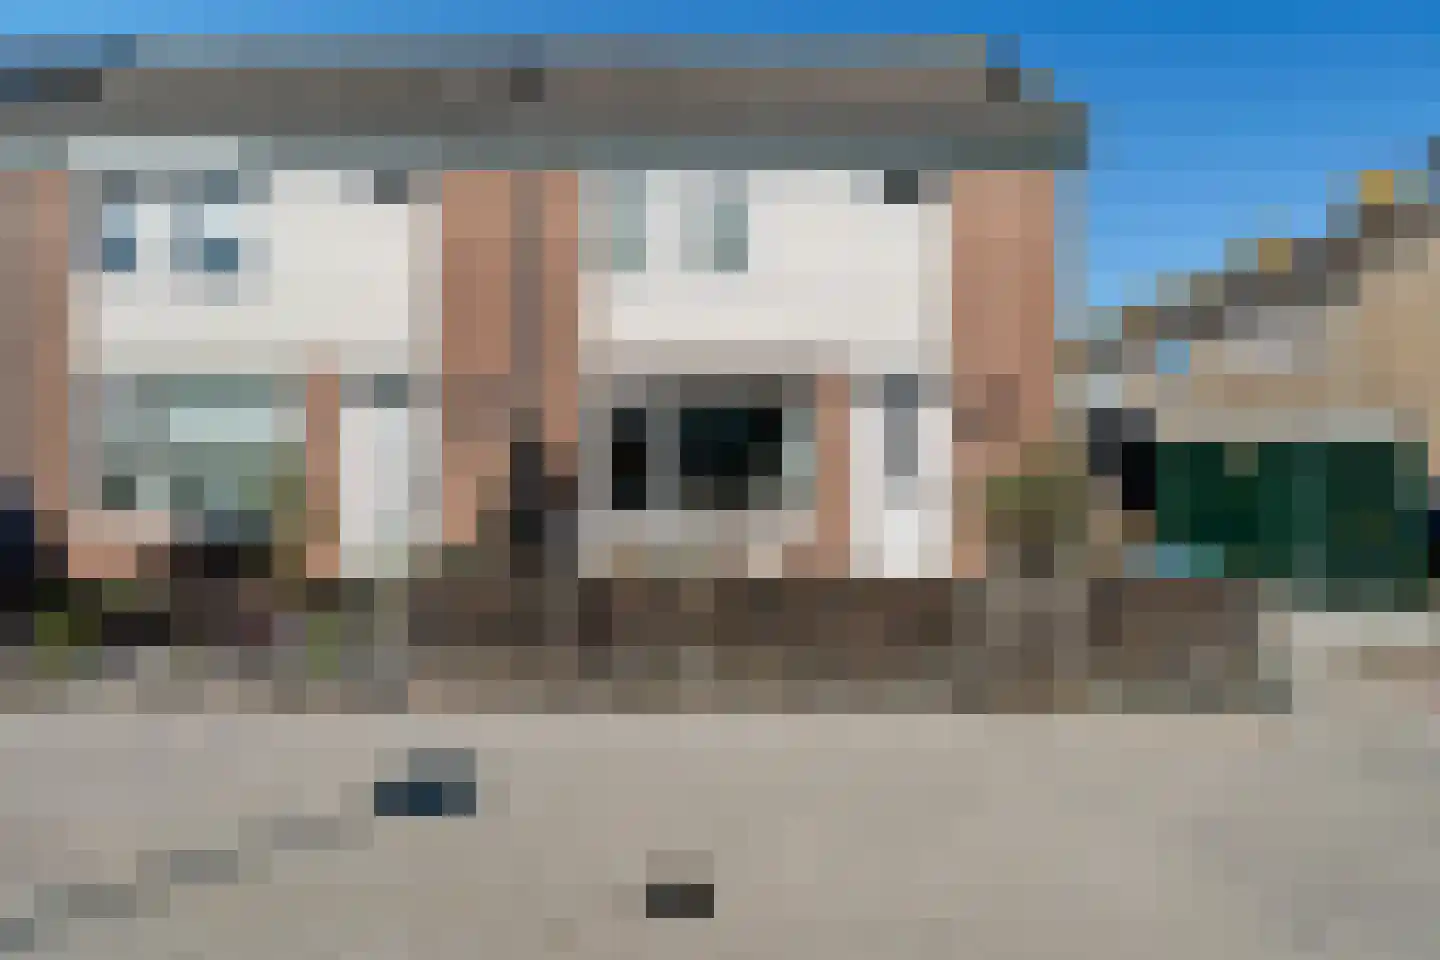
- Available
De Botter 13
8064GC Zwartsluis
€ 325.000 k.k.
€ 2.500/m²
- Living area
- 130 m²
- Land area
- 296 m²
- Bedrooms
- 3
Searching in 48 houses in Zwartsluis
Type to search. Use arrow down and arrow up to navigate through results and press Enter to open.
Hidden search suggestions.
View current properties in Zwartsluis or search targeted on street, postal code and property characteristics.
View the current housing stock in Zwartsluis and quickly filter by price, living area, rooms and more. There are currently 48 houses in this place within our selection. View also 28 sold houses in Zwartsluis for extra insight into the local housing market.
8064GC Zwartsluis
€ 325.000 k.k.
€ 2.500/m²
8064BH Zwartsluis
€ 260.000 k.k.
€ 4.000/m²
8064BP Zwartsluis
€ 340.000 k.k.
€ 4.857/m²
8064AL Zwartsluis
€ 775.000 k.k.
€ 3.507/m²
8064AB Zwartsluis
€ 300.000 k.k.
€ 2.804/m²
8064AC Zwartsluis
€ 385.000 k.k.
€ 3.080/m²
8064AW Zwartsluis
€ 1.025.000 k.k.
€ 5.511/m²
8064AL Zwartsluis
€ 525.000 k.k.
€ 2.612/m²
8064AP Zwartsluis
€ 897.000 k.k.
€ 4.271/m²
8064BD Zwartsluis
€ 900.000 k.k.
€ 5.921/m²
8064HA Zwartsluis
€ 585.000 k.k.
€ 4.680/m²
8064AE Zwartsluis
€ 750.000 k.k.
€ 2.679/m²
8064AB Zwartsluis
€ 285.000 k.k.
€ 3.393/m²
8064AG Zwartsluis
€ 795.000 k.k.
€ 4.877/m²
8064AR Zwartsluis
€ 375.000 k.k.
€ 3.538/m²
8064CW Zwartsluis
€ 400.000 k.k.
€ 3.101/m²
8064XK Zwartsluis
€ 315.000 k.k.
€ 4.145/m²
8064AV Zwartsluis
€ 995.000 k.k.
€ 5.497/m²
8064AV Zwartsluis
€ 1.195.000 k.k.
€ 3.414/m²
8064EH Zwartsluis
€ 300.000 k.k.
€ 2.362/m²
8064BV Zwartsluis
€ 305.000 k.k.
€ 4.420/m²
8064HB Zwartsluis
€ 695.000 k.k.
€ 4.264/m²
8064AK Zwartsluis
€ 285.000 k.k.
€ 2.938/m²
8064HV Zwartsluis
€ 575.000 k.k.
€ 3.422/m²
8064AW Zwartsluis
€ 920.000 k.k.
€ 5.476/m²
8064XR Zwartsluis
€ 375.000 k.k.
€ 3.505/m²
8064JC Zwartsluis
€ 435.000 k.k.
€ 4.065/m²
8064JH Zwartsluis
€ 800.000 k.k.
€ 4.278/m²
Get free quotes from real estate agents with local market knowledge. Compare more than 16 real estate agents in Zwartsluis.
Selling a home in Zwartsluis? Compare all real estate agents in Zwartsluis or view the top 10 real estate agents in Zwartsluis for extra context for your choice.
Real estate agents make sharper offers when they know you're comparing — ask for quotes for sale or purchase.
Practical answers about housing supply, sales and comparing real estate agents in Zwartsluis.
The costs of a real estate agent in Zwartsluis depend on commission, setup costs, property presentation and the chosen service. Compare the 16 real estate agents in Zwartsluis via the real estate agent page and request multiple quotes to compare rates and approach well.
Within our selection, we are currently showing 48 houses in Zwartsluis. View also the sold houses in Zwartsluis to compare the current offering with recent transactions.
Take into account not only price and living area but also maintenance, energy label, location, outdoor space and sales status. This way you compare houses in Zwartsluis on more than just the asking price.
A local real estate agent knows the neighborhoods, recent transactions and demand in Zwartsluis. By comparing 16 real estate agents in the region you get a better insight into prices, sales strategy and expected yield; the top 10 in Zwartsluis provides a useful starting point.
Yes, when making a sales plan, a valuation in Zwartsluis is wise. You gain insight into a realistic asking price and can then compare offers from real estate agents specifically.
View current location data on residents, WOZ development, housing stock, energy consumption, business activity and safety in Zwartsluis. In 2026 were there 4.995 residents. The average WOZ value in 2025 is EUR 306.000.
These figures help to better assess and compare the housing stock in Zwartsluis with recent sold homes. Orient yourself then on suitable top real estate agents in Zwartsluis for sales advice in this region.
Residents
4.995
Last year: 2026
Average WOZ
EUR 306.000
Last year: 2025
Average income per person.
EUR 31.000
Source: AllNumbers
Crimes (current year)
153
Total registered
| Year | Residents |
|---|---|
| 2021 | 4.885 |
| 2022 | 4.920 |
| 2023 | 4.955 |
| 2024 | 4.990 |
| 2025 | 4.960 |
| 2026 | 4.995 |
| Year | Average WOZ |
|---|---|
| 2021 | EUR 220.000 |
| 2022 | EUR 241.000 |
| 2023 | EUR 274.000 |
| 2024 | EUR 288.000 |
| 2025 | EUR 306.000 |
Hoger
710
Praktisch
1.200
Middelbaar
1.720
Europa
370
Nederland
4.305
Buiten Europa
290
Label C
638
Label A
492
Label B
403
Label D
228
Label G
203
Label F
114
Label E
65
Label A+++
37
Label A+
34
Label A++
25
Label A++++
4
Label A+++++
0
| Year | Gas (m3) | Electricity (kWh) |
|---|---|---|
| 2020 | 1.280 | 2.850 |
| 2021 | 1.430 | 2.910 |
| 2022 | 1.120 | 2.780 |
| 2023 | 940 | 2.680 |
| 2024 | 910 | 2.710 |
Hoekwoning
Gas: 960 • Electricity: 2.520
Huurwoning
Gas: 800 • Electricity: 2.100
Koopwoning
Gas: 1.030 • Electricity: 3.080
Appartement
Gas: 570 • Electricity: 1.890
Tussenwoning
Gas: 870 • Electricity: 2.420
Vrijstaande woning
Gas: 1.340 • Electricity: 3.750
Twee-onder-één-kap woning
Gas: 970 • Electricity: 2.990
Total number of company establishments: 620
| Period | Crimes |
|---|---|
| jan 2026 | 14 |
| jul 2025 | 11 |
| jun 2025 | 14 |
| mei 2025 | 15 |
| mrt 2025 | 20 |
| mrt 2026 | 2 |
| nov 2024 | 12 |
| nov 2025 | 12 |
| okt 2024 | 18 |
| okt 2025 | 9 |
| sep 2024 | 11 |
| sep 2025 | 18 |
These figures give an indicative picture of safety trends in the living environment of Zwartsluis.
Short answers based on current local statistics, handy for a quick comparison of the living environment.
Zwartsluis telt in 2026 ongeveer 4.995 inwoners.
De gemiddelde WOZ-waarde in Zwartsluis is in 2025 circa € 306.000.
Het gemiddelde inkomen per inwoner in Zwartsluis ligt rond € 31.000 per jaar.
Voor het huidige jaar gaat het om ongeveer 153 geregistreerde misdrijven. Gebruik deze cijfers als indicatie en vergelijk trends per periode.
In Zwartsluis komt vooral "Tussenwoningen" veel voor, met ongeveer 701 woningen.