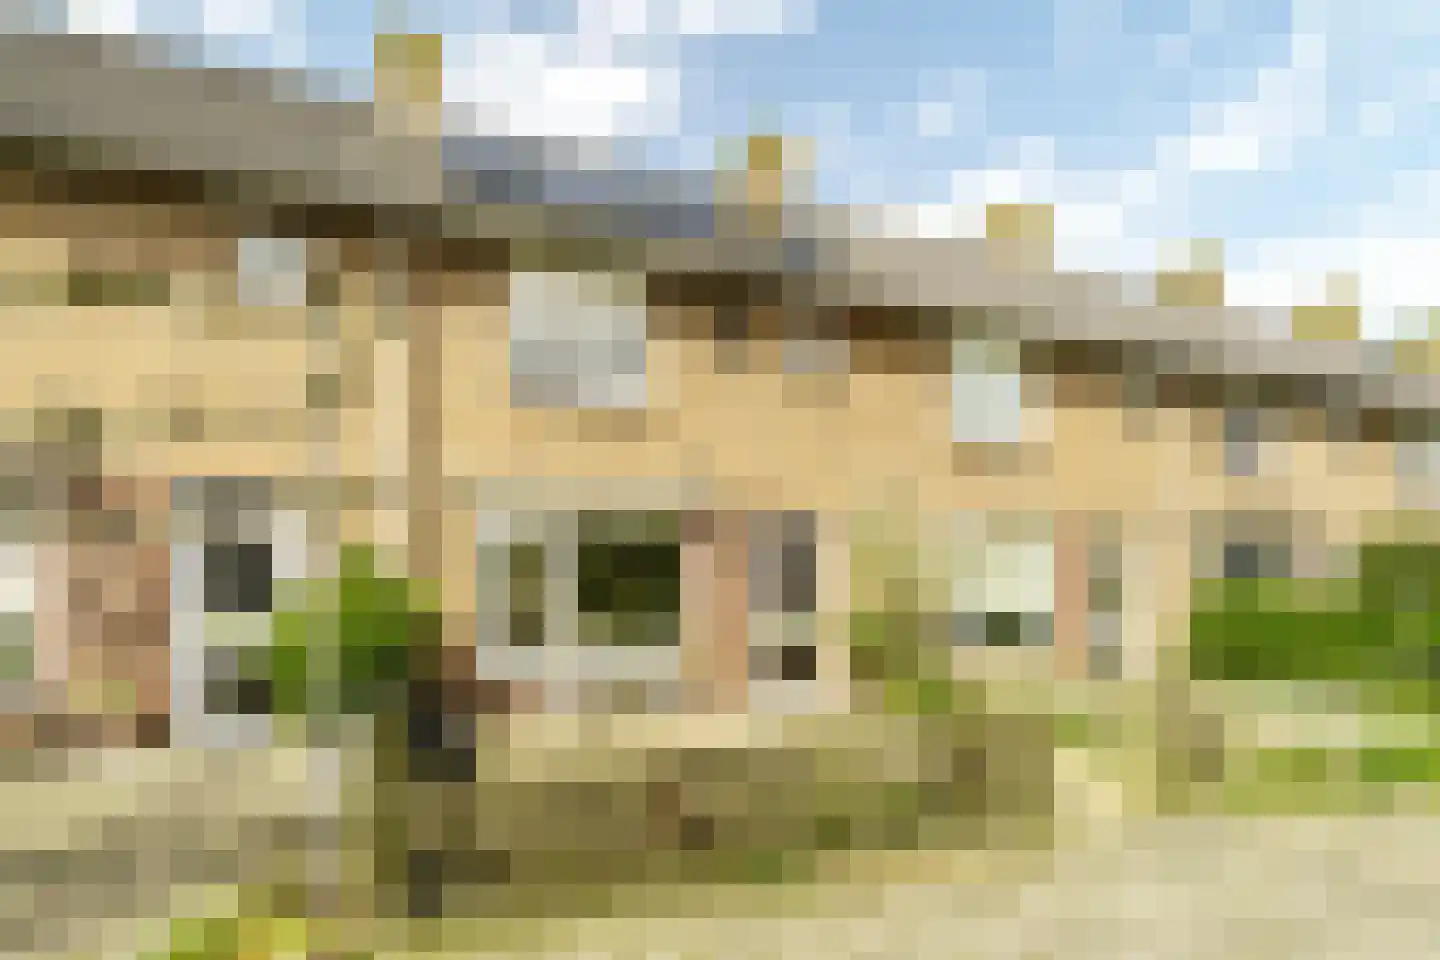

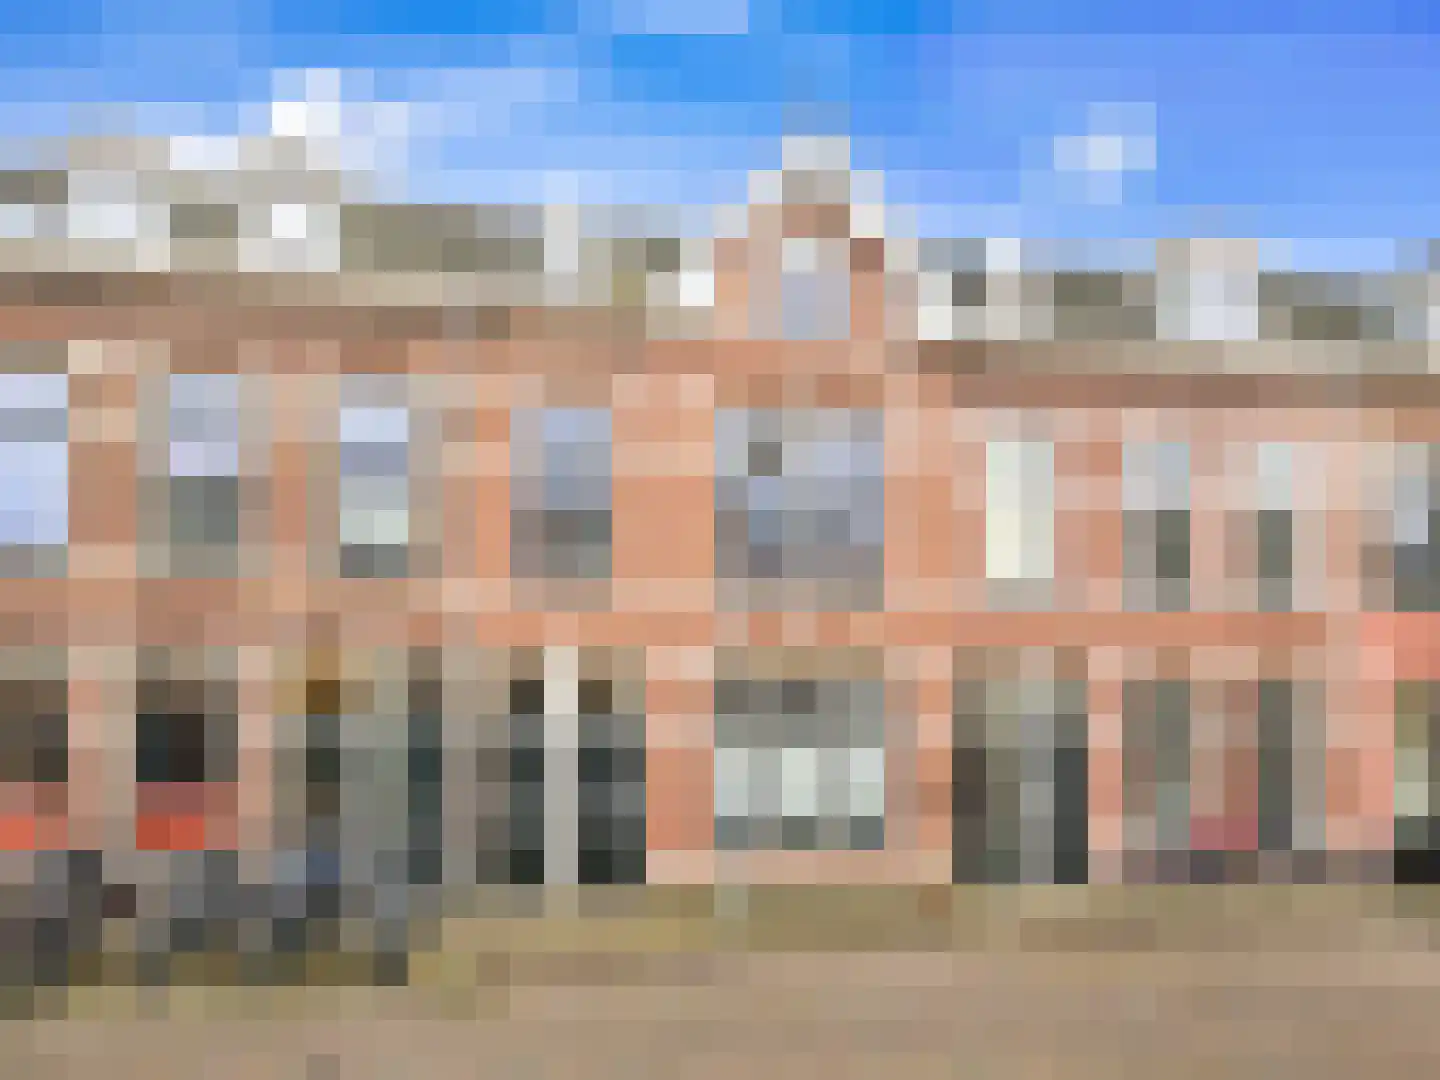
Haarlem and the surrounding area offers an attractive living and working environment, in which the housing market is active. A lot happens in this region, both within and around the city. Wouter Makelaardij is ready to advise, accompany and support you at every step of the purchase, sale or valuation of a property. Whether you are looking for a new home, want to sell or need an appraisal, we are here for you. Buying a house means a new...
Current housing stock
-

- Available
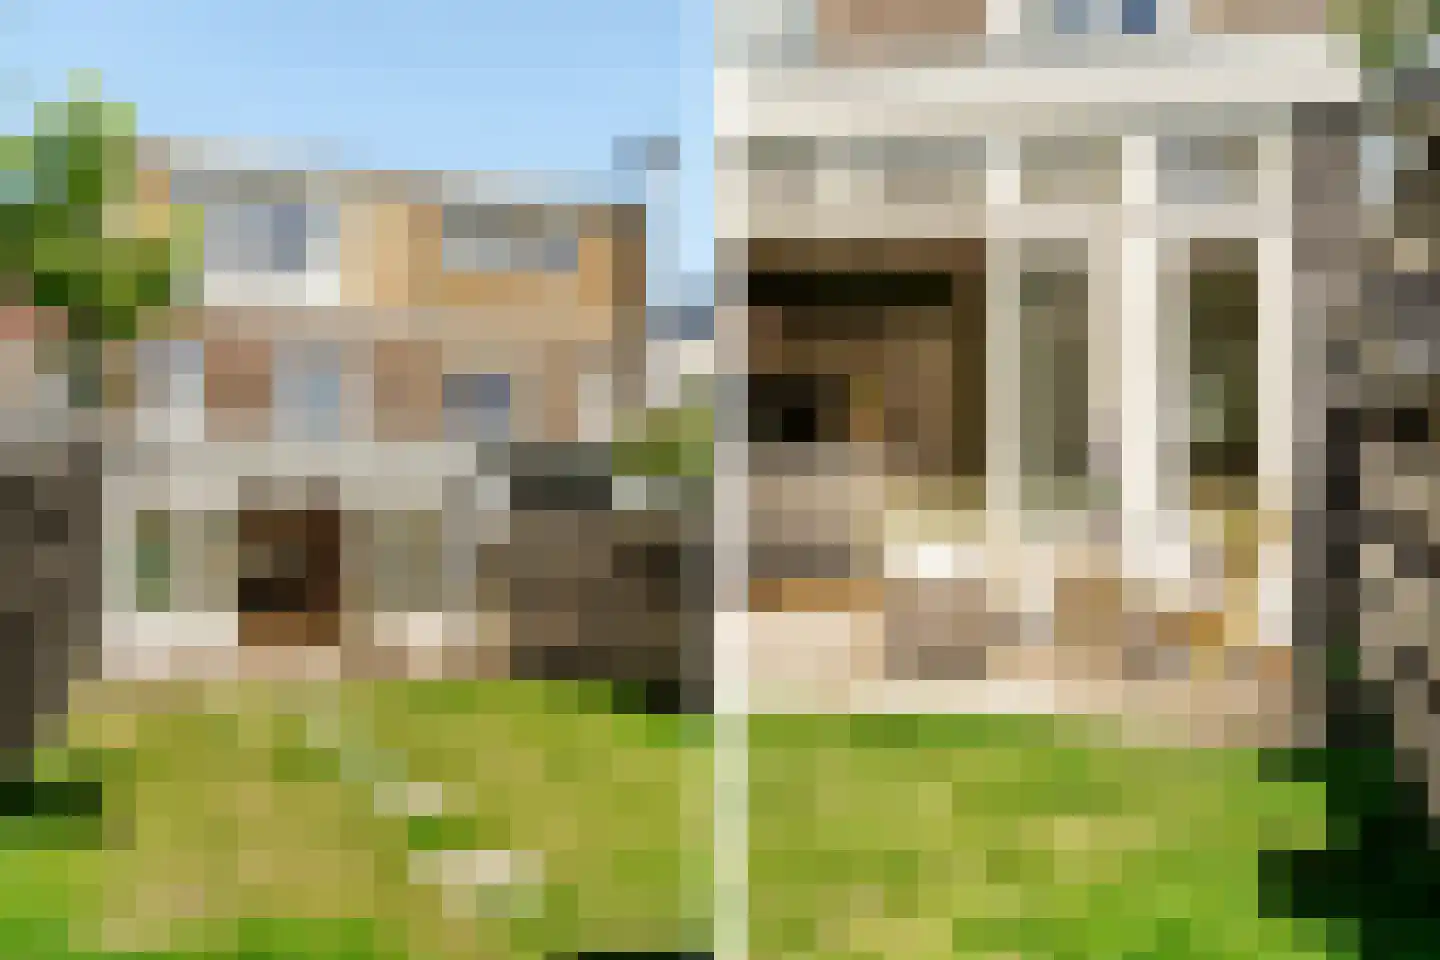
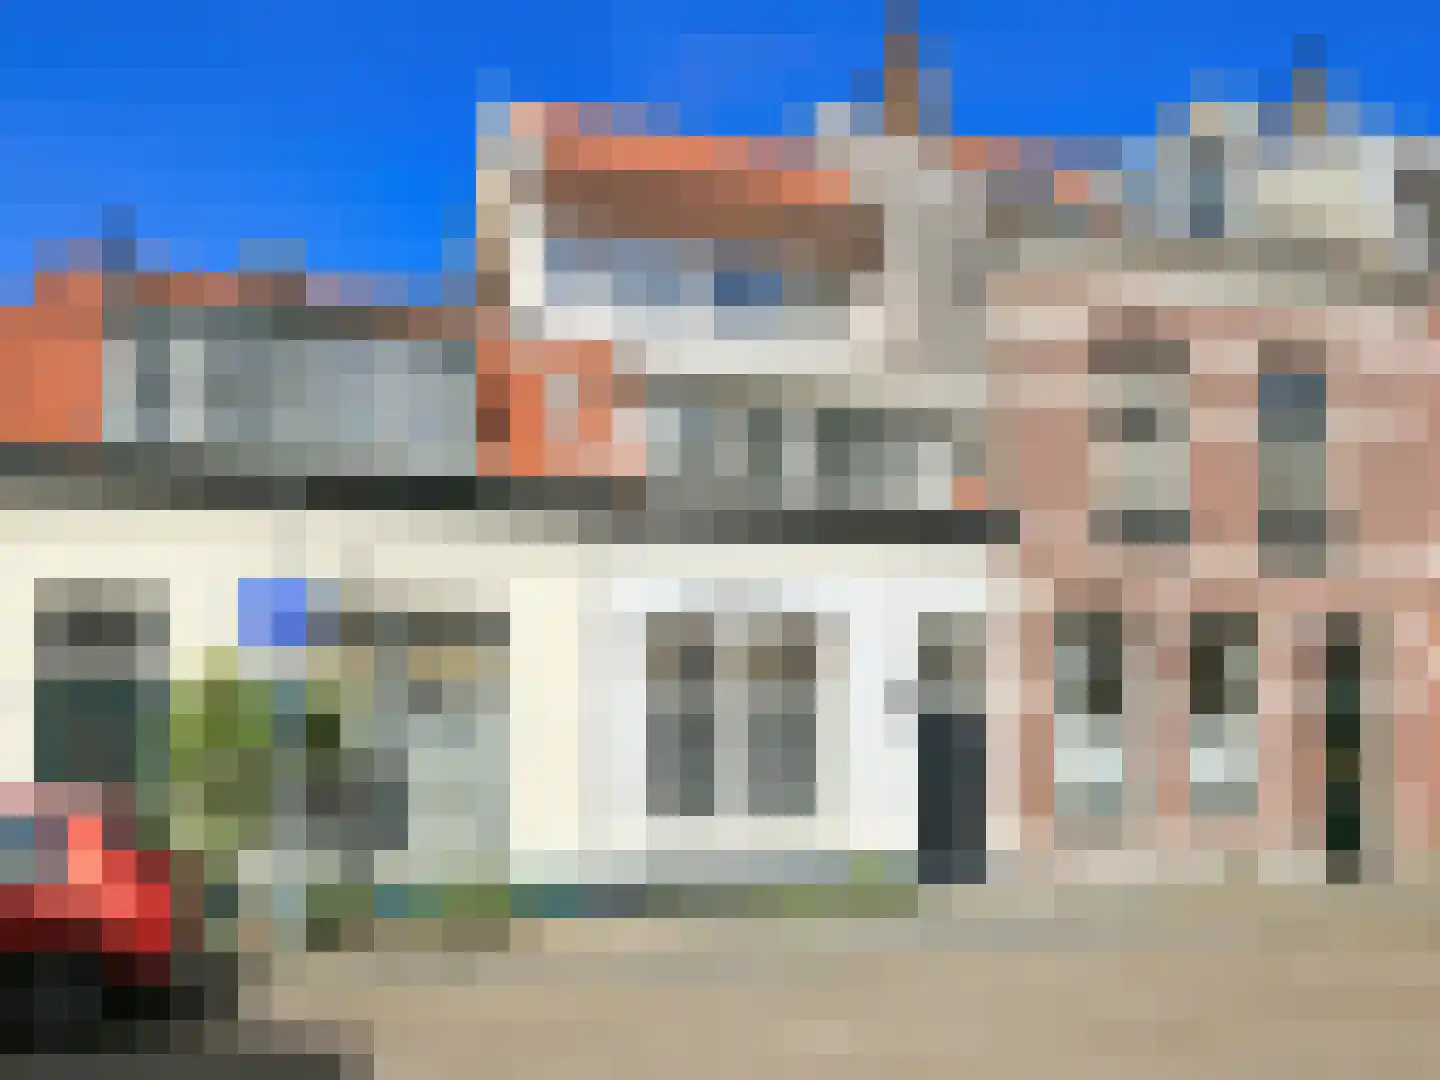
Potgieterstraat 48
2032VR Haarlem
€ 750.000 k.k.
€ 6.098/m²
ASave as favorite- Living area
- 123 m²
- Land area
- 149 m²
- Bedrooms
- 4
-
- Available
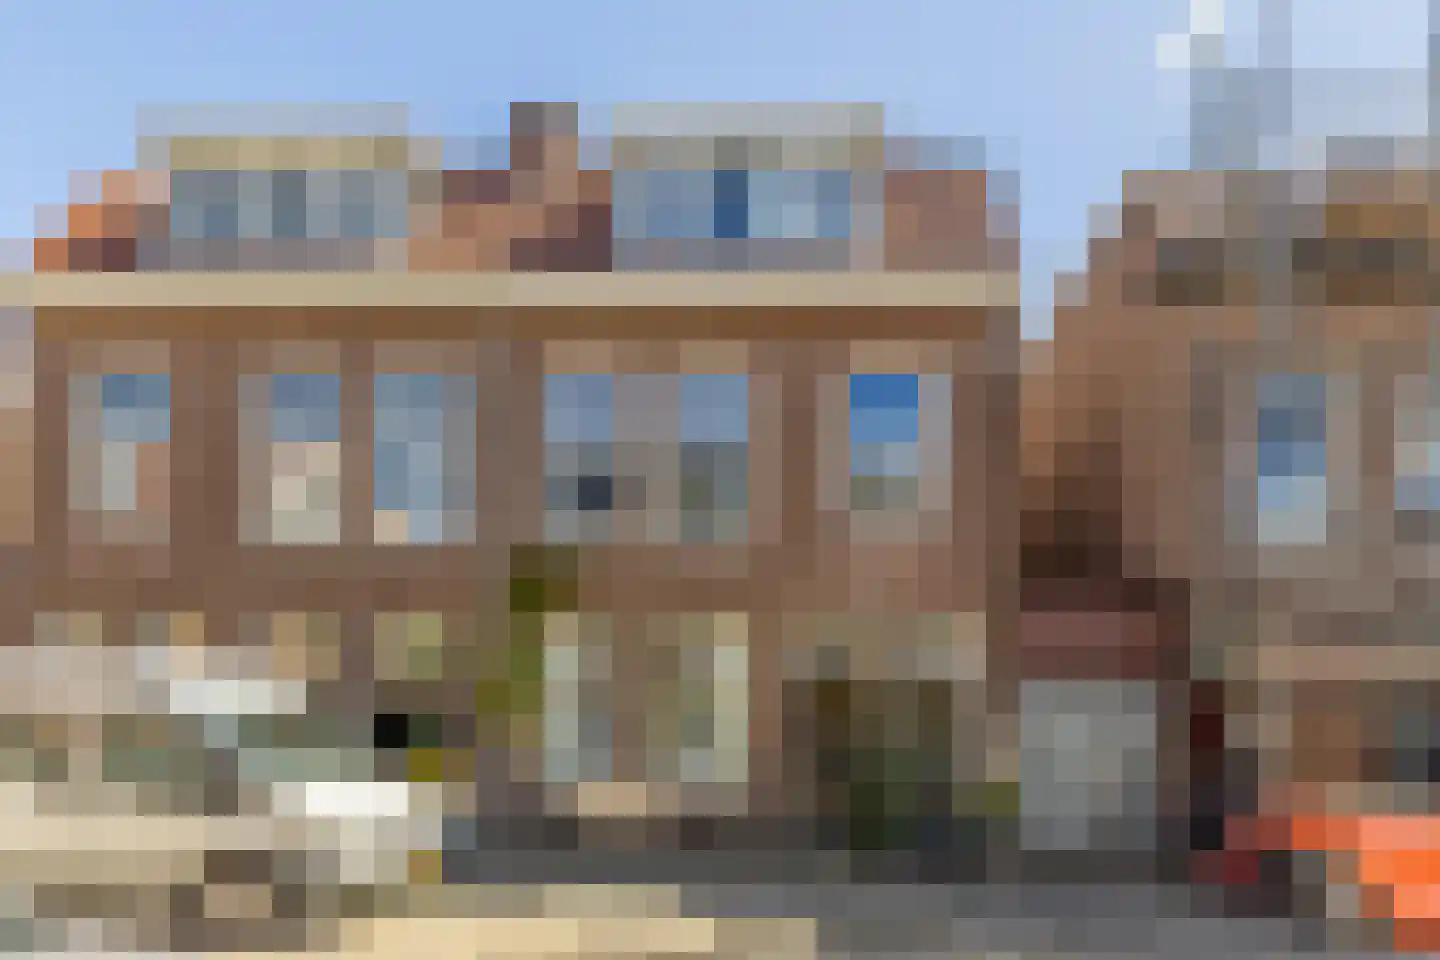
Bilderdijkstraat 14
2013EJ Haarlem
€ 850.000 k.k.
BSave as favorite- Living area
- 116 m²
- Land area
- 93 m²
- Bedrooms
- 4
-
- Available
Jan Nieuwenhuijzenstraat 25 RD
2013ZB Haarlem
€ 495.000 k.k.
DSave as favorite- Living area
- 93 m²
- Land area
- —
- Bedrooms
- 2
-

- Available
Berkenstraat 2 A
2023SZ Haarlem
€ 850.000 k.k.
€ 5.944/m²
ASave as favorite- Living area
- 143 m²
- Land area
- 91 m²
- Bedrooms
- 5
-

- Sold subject to confirmation
Gasthuisvest 15 C
2011ET Haarlem
€ 335.000 k.k.
€ 8.171/m²
CSave as favorite- Living area
- 41 m²
- Land area
- —
- Bedrooms
- 2
-
- Sold
Tetterodestraat 42 RD
2023XP Haarlem
€ 825.000 k.k.
€ 6.445/m²
CSave as favorite- Living area
- 128 m²
- Land area
- —
- Bedrooms
- 3
Reviews (75)
Review platforms
BronscoresTotal score
75 total reviews

Funda
54 reviews on Funda

21 reviews on Google
-
Vondelweg 146
10Contact met de makelaar en zijn team verliep zeer prettig. Wij werden in alle facetten van de verkoop van onze woning duidelijk geïnformeerd en geholpen. Nu de derde keer dat wij met Wouter een aan en/of verkoop doen, en wederom stelt het niet teleur.
-
Cremerplein 17
10Top makelaar! Wij hebben bij Wouter Makelaardij ons huis verkocht en een nieuw huis gekocht. Alles verliep soepel, professioneel en persoonlijk. Altijd bereikbaar en denkt goed mee. Zeker een aanrader!
-
Ceramstraat 11
10Wouter makelaar heeft ons perfect geholpen ,zeer goede kennis van de markt,met alles behulpzaam,en ons heel goed op de hoogte gehouden tijdens het verkoopproces. Een dikke 10 plus+ Fam Bohm
-
Zwanebloembocht 221
9Makelaar met geduld en zeer goede kennis van de markt. Weet je woonwensen goed te vertalen om aanbod te filteren.
-
Zoë B
10Top makelaar! Wij hebben bij Wouter Makelaardij ons huis verkocht en een nieuw huis gekocht. Alles verliep soepel, professioneel en persoonlijk. Altijd bereikbaar en denkt goed mee. Zeker een aanrader!
-
Dickmansstraat 46
9Wouter is een fijn mens en bovendien een uitstekende makelaar. Hij verstaat zijn vak, geeft deskundig advies en staat open voor feedback. Zeer positief om mee samen te werken. Wil jij je huis verkopen in Haarlem? Bel Wouter
-
Pieter Kiesstraat 79 ZW
9Prima samenwerking, afspraken werden nagekomen. Vantevoren was helder hoe de aanpak ging worden en de bereikbaarheid was altijd op orde.
-
Stefanie Basten
10Wij zijn ontzettend tevreden over Wouter Makelaardij! Vanaf het eerste contact zijn we supergoed begeleid bij de verkoop van onze woning. Alles werd duidelijk uitgelegd, afspraken werden nagekomen en we wisten steeds precies waar we aan toe waren. Wouter heeft zeer veel kennis van de markt. Vragen werden altijd snel en helder beantwoord, wat ons veel vertrouwen gaf tijdens het hele proces. Dankzij zijn professionele aanpak verliep de verkoop soepel en zonder stress. Wij kunnen Wouter Makelaardij dan ook van harte aanbevelen aan iedereen die zijn woning wil verkopen!
-
Herenlaan 2
10Translated by AIWe had a pleasant experience purchasing with Wouter. We gained useful insights during the negotiations and were ultimately able to purchase the property.
-
Bloemveldlaan 2
8Translated by AIThe introductory meeting showed that he knew what he was talking about and he knew how to win our trust. The quotation for the service to be offered was short, concise and to the point. He has a good network for supporting services such as, photographer (excellent work), structural report and energy label, with smooth delivery of results. Letting the client take the lead, without pressure and/or formalities, he clearly expressed his opinion and is just very pleasant to work with...
-
Leonardo da Vinciplein 59
10I reached out to Wouter Makelaardij based on a colleague's recommendation, and I am very glad I did. Communication was always clear, accurate, and helpful. Wouter arranged viewings very quickly, and thanks to his support, we successfully closed a deal after just the second viewing! I highly recommend his services.
-
Croesenstraat 36
8Translated by AIWouter prepared the sale well and the sales result was great. All appointments were kept.
-
Rijksstraatweg 72
9Translated by AIOnce again, the best service and expertise after previous cooperation. Knowledge, skill, honest and transparent. What you can expect from a real estate agent.
-
Potgieterstraat 19
10Translated by AIWouter fully meets the expectations. He is knowledgeable and friendly. Would certainly use him again at the next opportunity.
-
Van Oosten de Bruijnstraat 159
10Translated by AIVery fine and pleasant contact and well assisted. The appointments with the photographer, stylist, the meter were quickly arranged. Completely top!
-
Bellevuelaan 25
10Translated by AIBoth with purchase and sale very happy with Wouter! The whole process was super nice. After the viewings I always got a detailed explanation of how it had gone, which created a lot of trust during the process. Wouter was on top of it and within two weeks it was sold.
-
Niels en Maite
10Translated by AIWouter has super nicely helped us with our first house purchase. He is very reliable, involved, switches quickly and communicates very pleasently. Again thanks Wouter and Erwin! :)
-
Romeinenstraat 17
10Translated by AIGreat real estate agent! The initial meeting was open and especially aimed at getting to know us and what we are looking for. Not a sales pitch, but rather what we are seeking and why. We also visited several houses with Wouter shortly after this initial meeting, and we quickly came across our dream house. Thanks to Wouter's good guidance throughout the entire process, we look back on a very successful purchase and period.
-
Schoterbosstraat 2
10Translated by AIWe have experienced contact with Wouter as very pleasant. He has a lot of business knowledge, he is very customer-friendly and has advised us wonderfully.
-
Veermolenweg 10
10Translated by AIFantastic realtor with good advice and very flexible! Thank you so much for your help, really great!