In Dalfsen en de omgeving staat Passie Makelaardij voor betrouwbare en persoonlijke makelaarsdienst. Met een duidelijke focus op klantgerichtheid en transparantie, help ik je graag bij het kopen of verkopen van jouw woning. Mijn ervaring en passie voor de woonmarkt zorgen voor een rustige, ontzorgende samenwerking. Ik bied dienstverlening in aankoop en verkoop, met een werkwijze die gericht is op jouw wensen. Met het SCVM-certificaat en...
Current housing stock
-
- Available
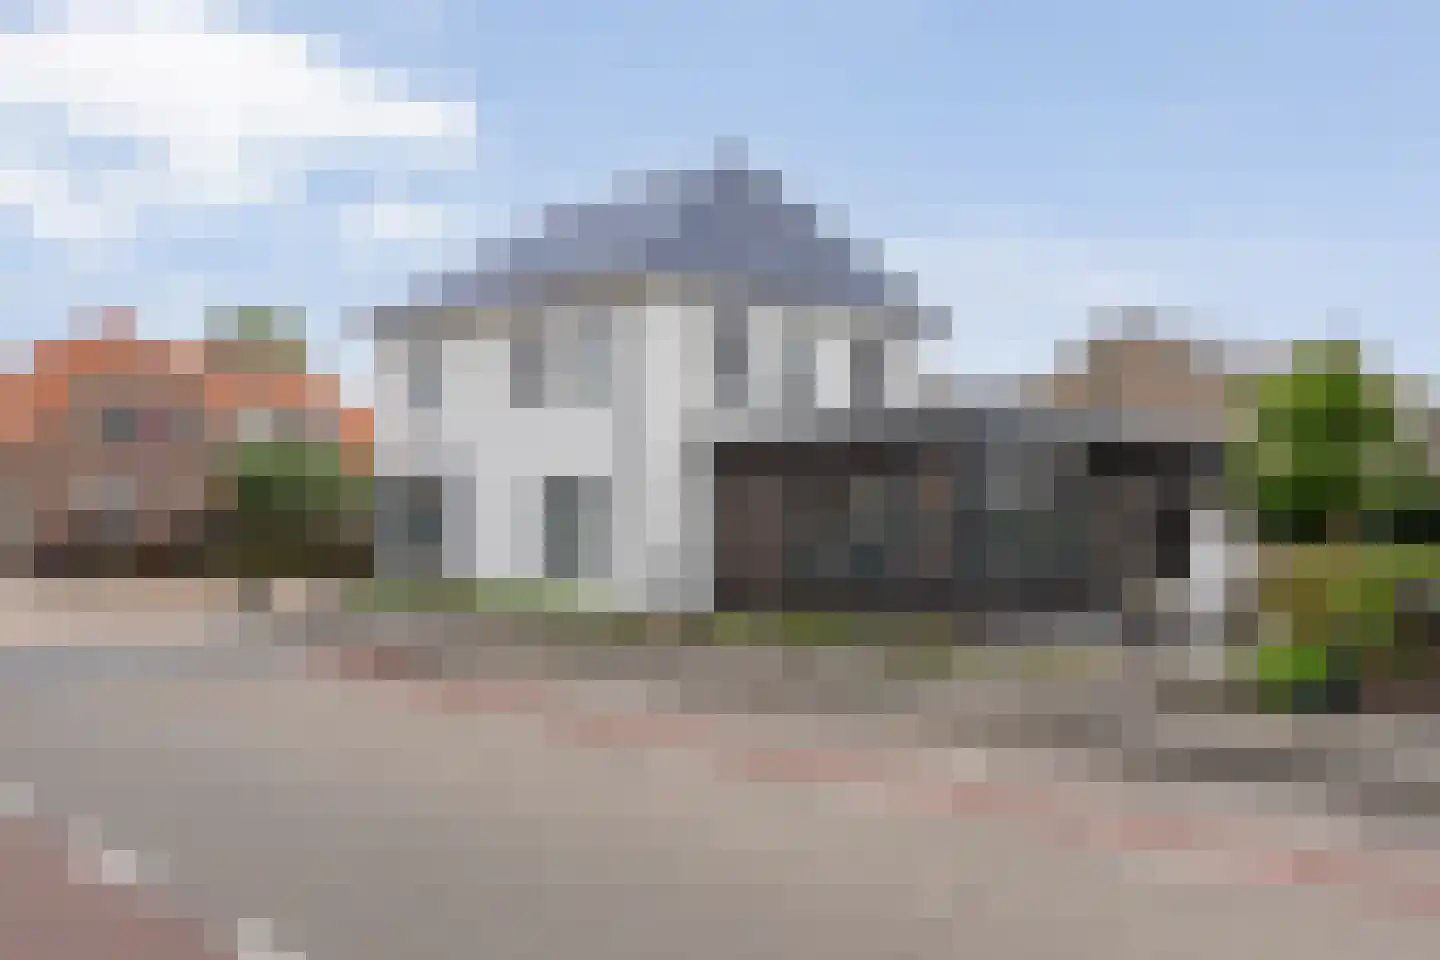
Eschstraat 25
7721ZN Dalfsen
€ 385.000 k.k.
€ 4.375/m²
CSave as favorite- Living area
- 88 m²
- Land area
- 155 m²
- Bedrooms
- 3
-

- Available
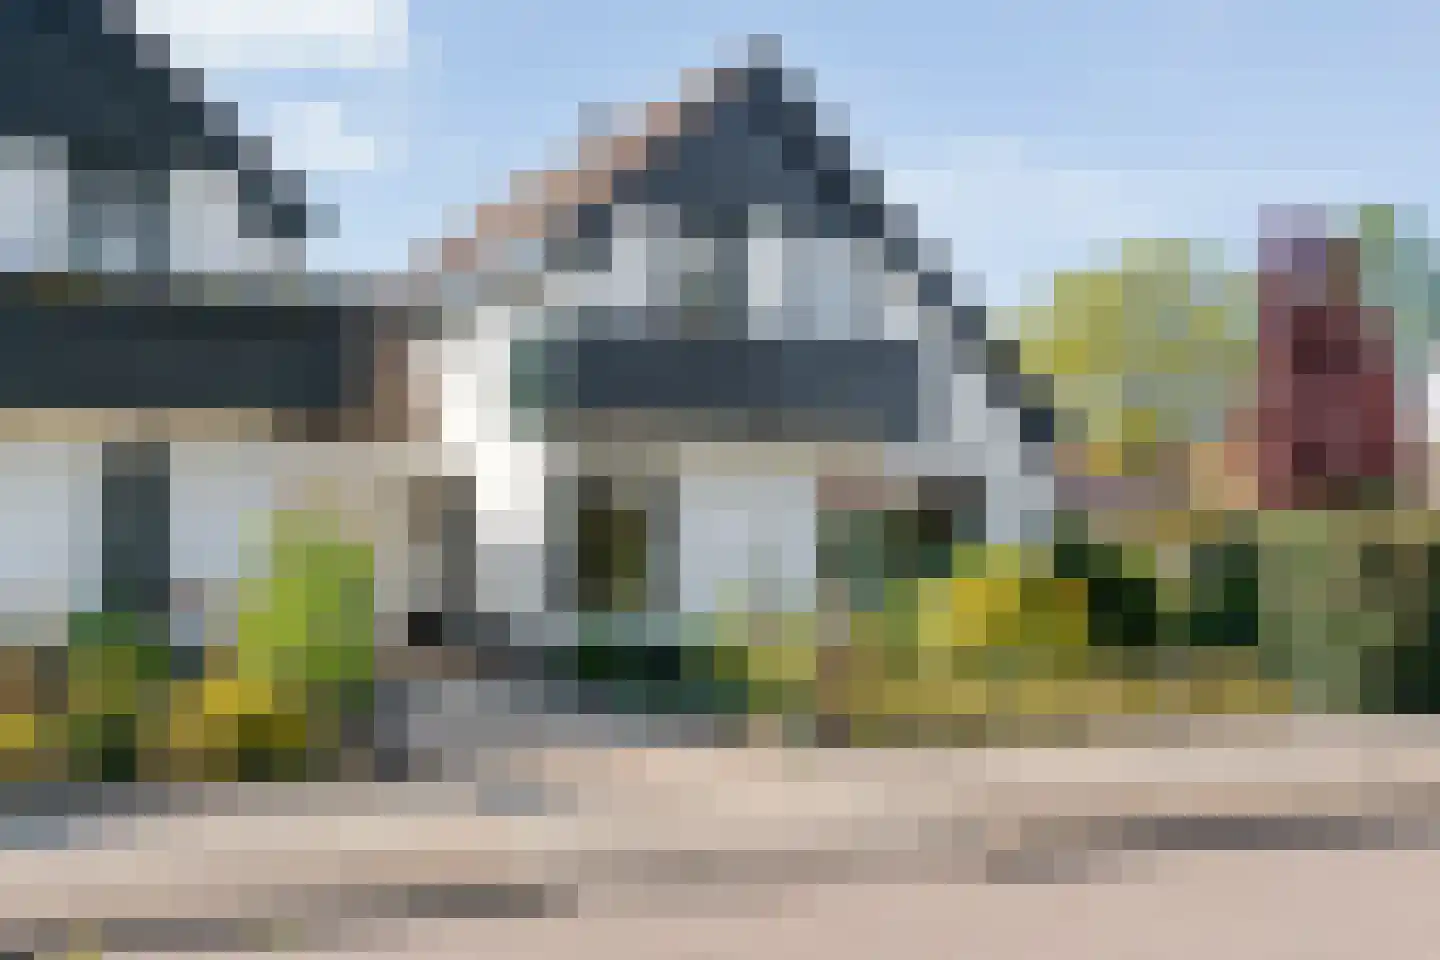
Van Ankumspad 10
7721AK Dalfsen
€ 450.000 k.k.
€ 6.429/m²
BSave as favorite- Living area
- 70 m²
- Land area
- —
- Bedrooms
- 2
-

- Available
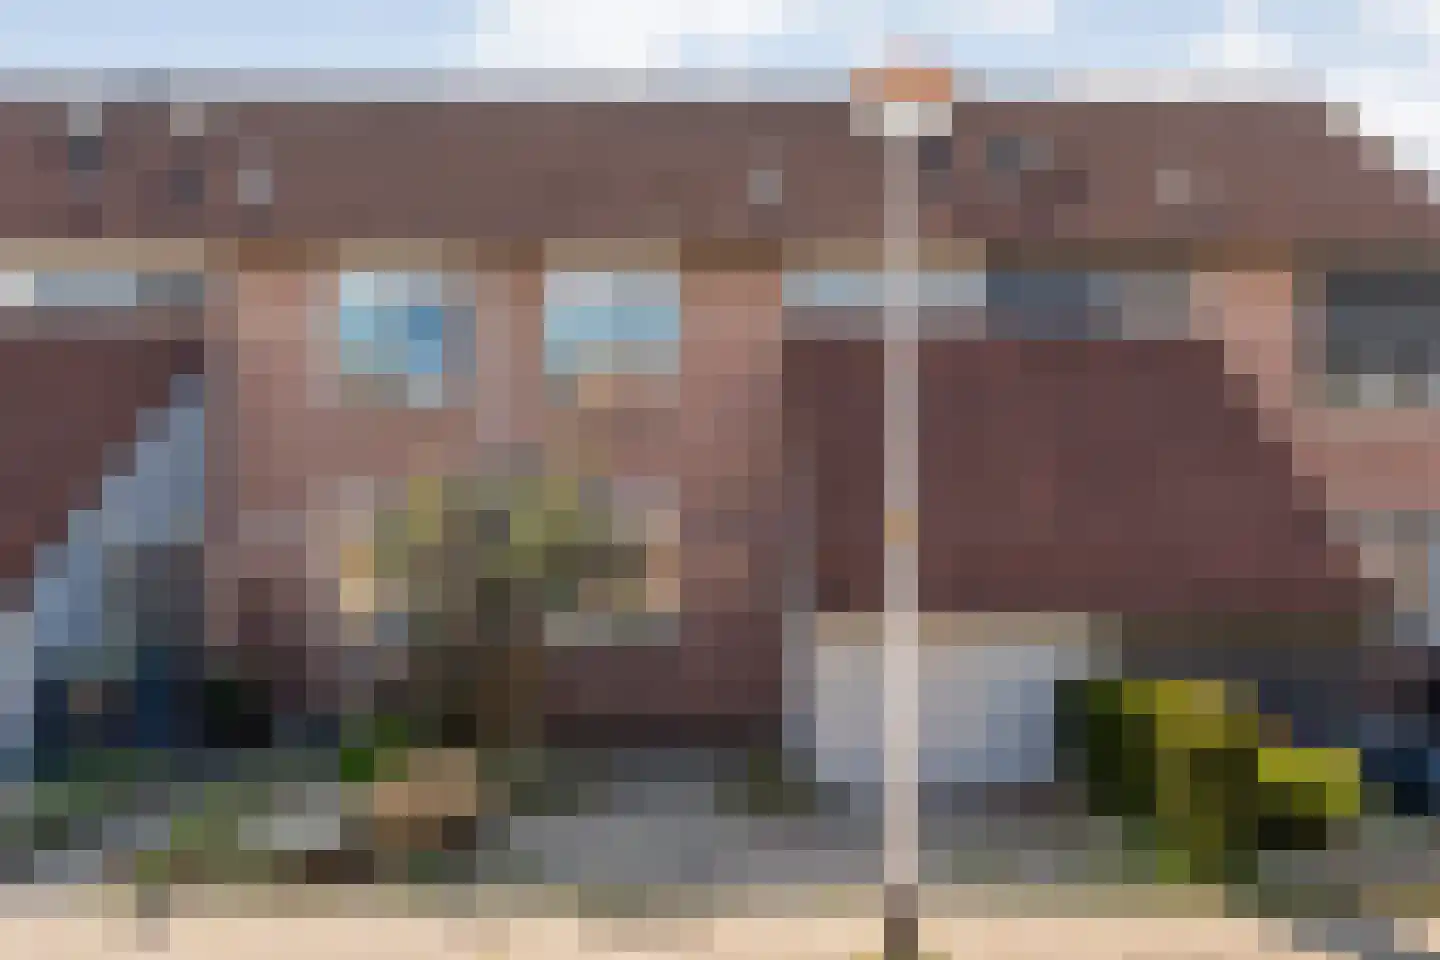
Bierbrouwerweg 18
7721KP Dalfsen
€ 630.000 k.k.
€ 4.091/m²
ASave as favorite- Living area
- 154 m²
- Land area
- 253 m²
- Bedrooms
- 5
-

- Under consideration
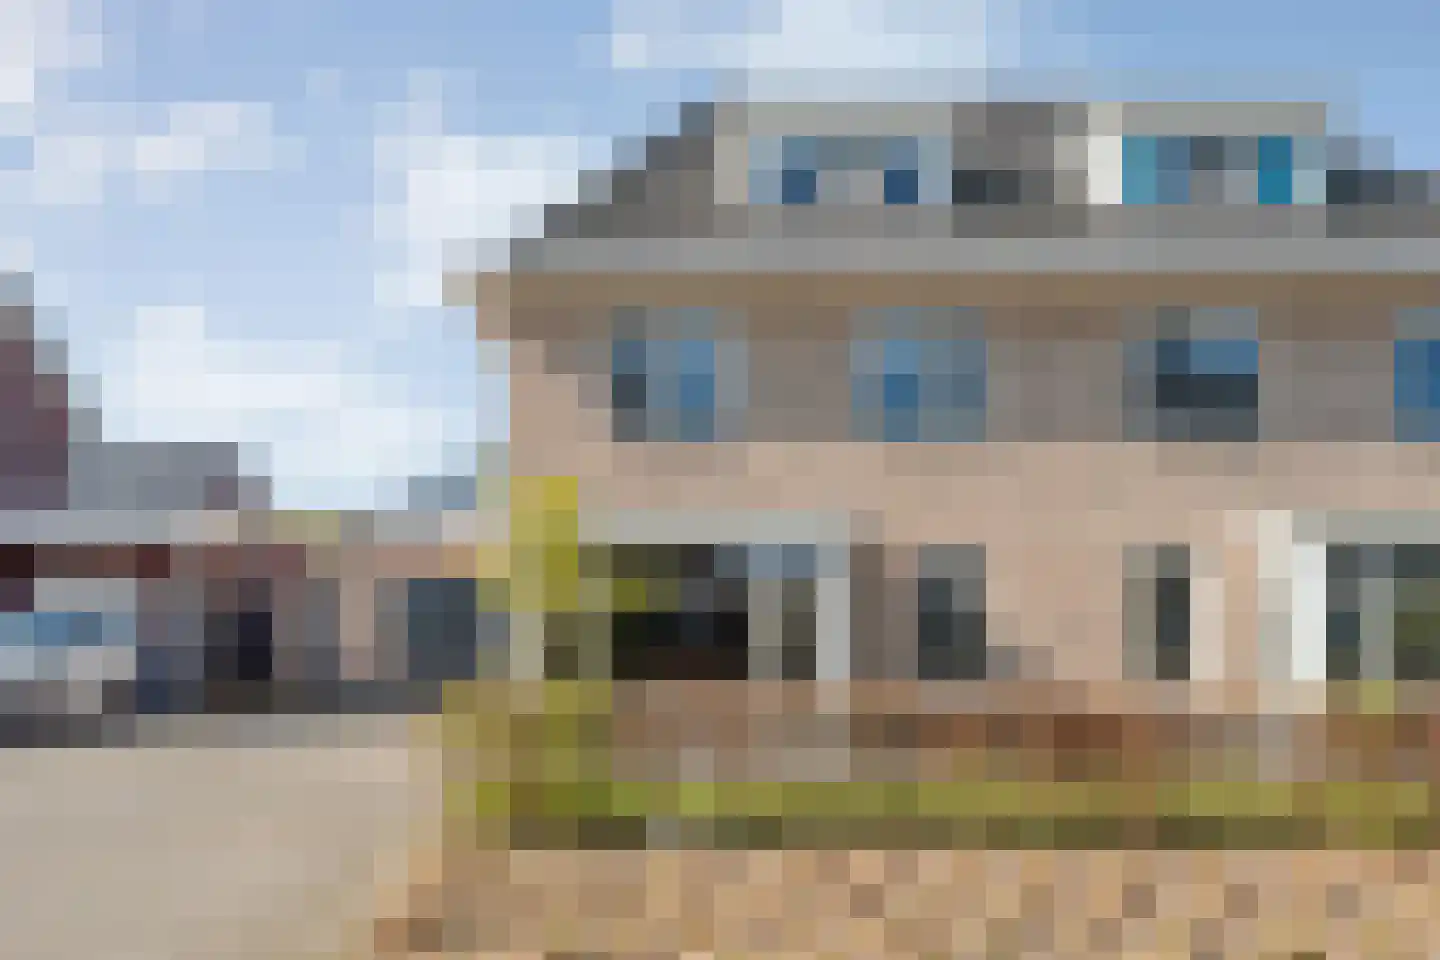
Hogenkampsweg 183
8022DE Zwolle
€ 285.000 k.k.
€ 4.254/m²
ESave as favorite- Living area
- 67 m²
- Land area
- —
- Bedrooms
- 2
-
- Sold subject to confirmation
Koezenkamp 3
7721VD Dalfsen
€ 607.500 k.k.
€ 3.231/m²
ASave as favorite- Living area
- 188 m²
- Land area
- 337 m²
- Bedrooms
- 6
-

- Purchased
Munterkamp 45
8014DM Zwolle
€ 375.000 k.k.
€ 4.464/m²
BSave as favorite- Living area
- 84 m²
- Land area
- 100 m²
- Bedrooms
- 3
Reviews (23)
Review platforms
BronscoresTotal score
23 total reviews

Funda
16 reviews on Funda

7 reviews on Google
-
Teeuwserf 42
10Wij gunnen een ieder Passie Makelaardij. Zij doet haar bedrijfsnaam echt eer aan. Duidelijke afspraken die ze meer dan nakomt. Niks is haar teveel. We zijn zeer tevreden!!!
-
Mantelspeld 14
8Passie makelaardij is professioneel, vriendelijk en denkt goed mee in het proces. Geduldig en kundig.
-
Teunisbloem 20
10Translated by AIWe got to know Annelies as a very friendly and knowledgeable real estate agent. She has super helped us with both the sale of the current home but also with the purchase of the new home. A real estate agent with Passion!
-
Kloosterhof 18
10Translated by AIAnnelies is a very involved real estate agent, who takes all the time to guide the sales process properly. Attentive, responds quickly, expert, helpful and excellent guidance. In addition, the quality/price ratio is top. We are super happy that we made this choice and we have sold our house definitely within a few weeks. Really a recommendation! Thank you Annelies for your dedication!
-
Rosengaardeweg 38
9Translated by AIProvided good advice and helpful in finding the necessary information. Photos and information package, decorating the house correctly. We had a good connection. Pleasant way of working together and skilled also with the pre-sale appraisal.
-
Van Lentestraat 8
10Translated by AIThe real estate agent is very involved, professional and client-oriented. Excellent and fast communication.
-
Rik Boersma
10Translated by AIWe are incredibly happy that Annelies from Passie Makelaardij guided us from a to z during the entire purchase and sales process. Even though I was skeptical about real estate agents, she really proved her added value. She genuinely helped us with every step of viewing properties (even in the evenings and on weekends!) to giving honest advice, even if that meant we shouldn't bid. Ultimately, we unexpectedly ended up at my childhood home. A special step where Annelies guided us with great care and involvement, also taking into account the interests of all those involved. And as if that wasn't enough, she even arranged everything during her vacation from France for the sale of our own house. In short: a real estate agent who really thinks along with you, is clear in her communication and makes you feel like you are not alone. We can wholeheartedly recommend her!
-
Agnietenhof 1
9Translated by AIDirect, clear and engaged communication and guidance from the real estate agent. Short lines of communication. Collaborative and helpful. Realistic assessment and knowledge of the local market. In short, happy and satisfied that we have entered into an agreement with this real estate agent.
-
ilona zondag
10Translated by AIThanks to the fantastic help of Annelies, we dared to take the step towards our dream house. She knew the ideal buyers for our house and that's why it was already sold before it came onto the market. Very handy that there is a fixed (low) rate and that her husband comes by for the energy label. In short, a big recommendation if you are looking for a real estate agent in the Dalfsen area!
-
Ruigedoornstraat 6
10Translated by AIIt has been a very warm and valuable experience to have had Annelies as a real estate agent! So nice and personal in the contact. Very expert. Even outside office hours willing to make contact or take action. We are very grateful to her and wholeheartedly recommend her to everyone!
-
Kievitsbloem 93
10Translated by AINice personal contact. Easily accessible if you have questions, and quick response. We experienced it as very pleasant.
-
Agnietenhof 26
10Translated by AIAnnelies is very involved, keeps appointments, and won't shy away from helping out. Whether it was still some cleaning or something to carry. . . . she has been an enormous support and confidante throughout the entire process. You would almost believe you are the only client, so involved, but that’s how she is with all her clients. We engaged her because she did the purchase of a home for free when you sold your home. She knew it. The purchase was a very ing…
-
Rosengaardeweg 60
10Translated by AIAnnelies Nijboer from Passie Makelaardij was our buyer's and seller's agent. Our search for a new home involved many houses, and Annelies almost always went along, advised us, and kept us sharp regarding our starting points. We could easily consult with her; she is easy to reach. When we made an offer on a house, it was done through her and the procedure proceeded according to agreements. The sale of our house went smoothly, which also meant many viewings for Annelies…
-
Generaal Eisenhowerlaan 37 A
9Translated by AIFrom the first conversation to the actual sale, Annelies kept us informed of developments! Very happy with our choice. No fuss and saying things as they are.
-
Wicherserf 2
10Translated by AIDalfsen is a beautiful place to live and enjoy nature. The reason my father lived here until his death, despite the minimal travel distance of 1.5 hours to one of his children. After his death, our father's house had to be sold. Passie Makelaardij is a real estate agent with up-to-date knowledge of the local housing market. After an initial contact and an appraisal of the property by both Passie Makelaardij and another local real estate agent...
-
Westenbergmate 107
10Translated by AIThe name of her real estate agency says it all; Passion! Annelies does her work with enormous passion. She is - even outside office hours/during vacations - very accessible and answers questions in the short term. She maps out your wishes and needs and doesn't lose sight of them. Where we - as starters in this overheated market - viewed houses through rose-colored glasses and sometimes swept aside earlier objections just to acquire a house, Annelies kept us with both feet on the g…
-
Koningsvaren 7
10Translated by AIAnnelies is a dedicated real estate agent who thinks along well with her clients, both in the purchase and sales process. The short communication line makes it pleasant to work with her. Riëtte & Bert
-
Molenstraat 13
10Translated by AIAfter a pleasant introductory meeting, we decided to move forward with Annelies. Annelies indicates that she wants to provide support, and she does so. She is skilled, honest, reliable, and clear. She outlines the process for us and is easily accessible. The group app created for us also worked well. We also found it pleasant that there was 1 person who handles everything (brochure, photos, styling, viewings etc.) and is aware of all matters surrounding the house and sale. We are very e...
-
M Ge
10Translated by AIAfter a less positive experience with another real estate agency, we came into contact with Annelies. We were pleasantly surprised by the introductory meeting and without a doubt, we switched. We have not regretted that for a moment. Annelies is clear and straightforward in her communication and realistic about any expectations. A promise is a promise with her. She commits herself fully 100% to her client (and potential buyers). Annelies always goes the extra mile for her client. Even in the evenings and even on weekends, we were able to consult with her. Annelies has knowledge of her profession but above all, she is truly people-oriented. Annelies is a real estate agent who really takes care of you. Her pricing is clear and does not lead to unrealistic price assessments with the aim of higher commissions. If we were to recommend a real estate agent in the region, we would wholeheartedly recommend Annelies, because with her passion she lives up to her name.
-
Ronald van den Brink
10Translated by AIWe have sold our first home. This real estate agent is expert and guided us very pleasantly throughout the entire process. In addition, she is easily accessible and has a fresh, modern way of presenting homes. This resulted in a large number of interested parties and a quick, good sale. For any next time, we will not hesitate to use her services again.