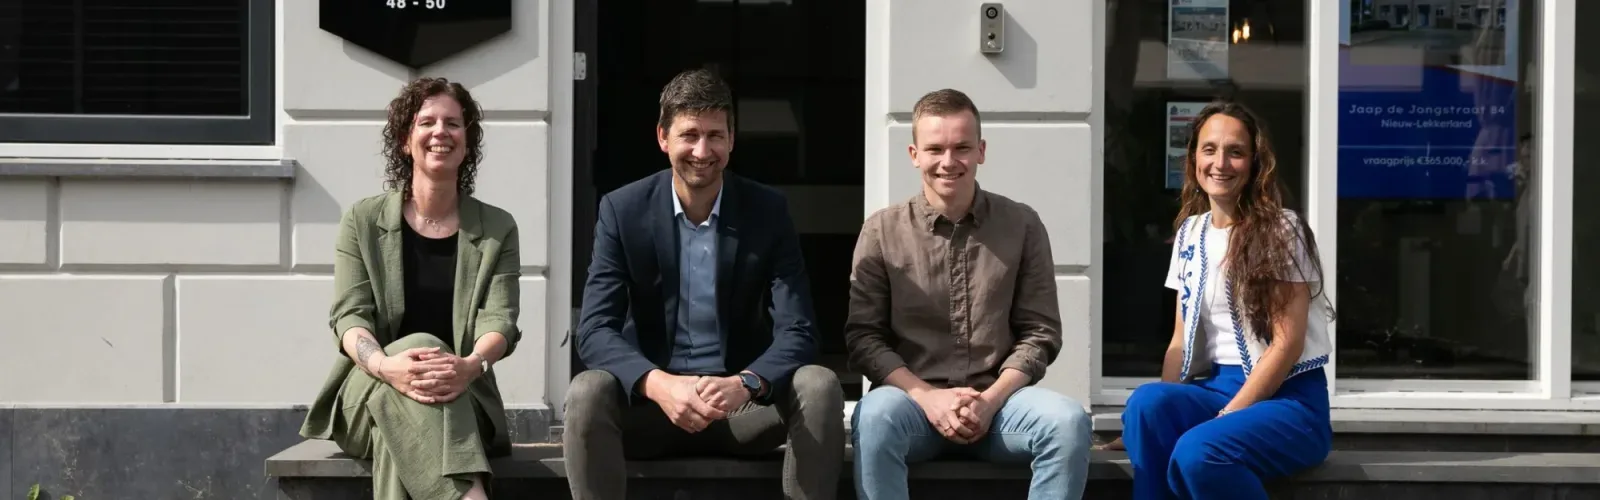
Makelaardij Stuij & Van Dijk
In Hardinxveld-Giessendam, Makelaardij Stuij & Van Dijk is known as a reliable partner for the sale, purchase and rental of real estate. We combine personal attention with professional expertise to realize your wishes. Our customer-oriented approach ensures that you always feel comfortable, from start to finish. We offer a wide range of services, including sales, purchases, rentals, valuations and financial advice. Our employees are acc...
Current housing stock
-
- Available
Admiraal de Ruyterstraat 55
3361VB Sliedrecht
€ 370.000 k.k.
FSave as favorite- Living area
- 99 m²
- Land area
- 120 m²
- Bedrooms
- 3
-
- Available
Burgemeester de Raadtsingel 193
3311JH Dordrecht
€ 260.000 k.k.
CSave as favorite- Living area
- 65 m²
- Land area
- —
- Bedrooms
- 1
-
- Available
Kerkbuurt 132 b
3361BL Sliedrecht
€ 335.000 k.k.
BSave as favorite- Living area
- 78 m²
- Land area
- —
- Bedrooms
- 2
-
- Available
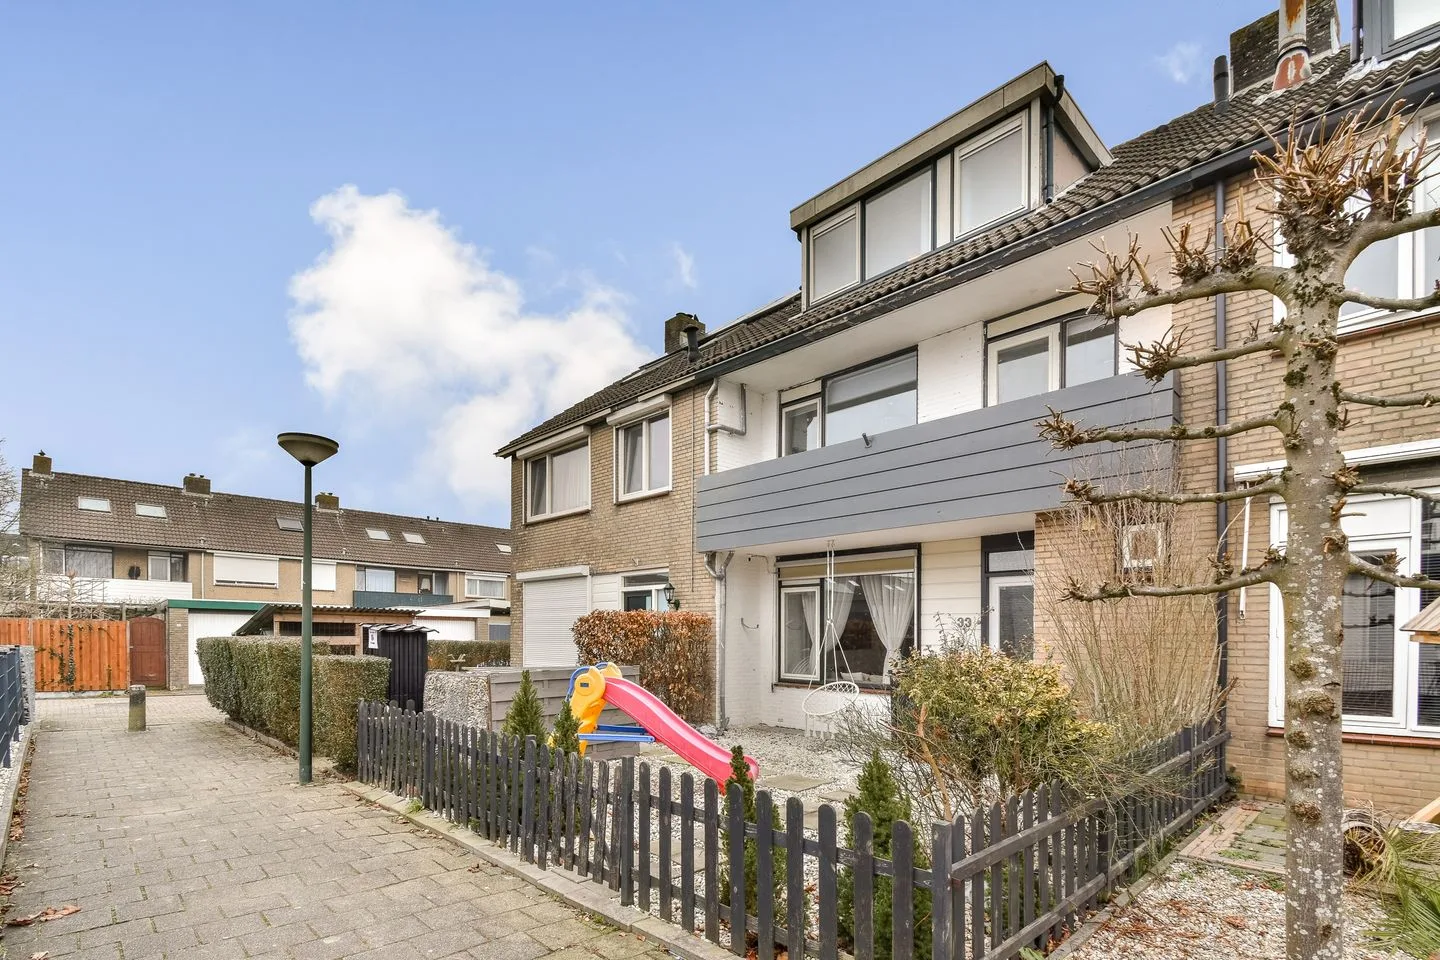
Gieser Wildeman 37
3371NG Hardinxveld-Giessendam
€ 515.000 k.k.
€ 4.087/m²
ASave as favorite- Living area
- 126 m²
- Land area
- 142 m²
- Bedrooms
- 4
-
- Available
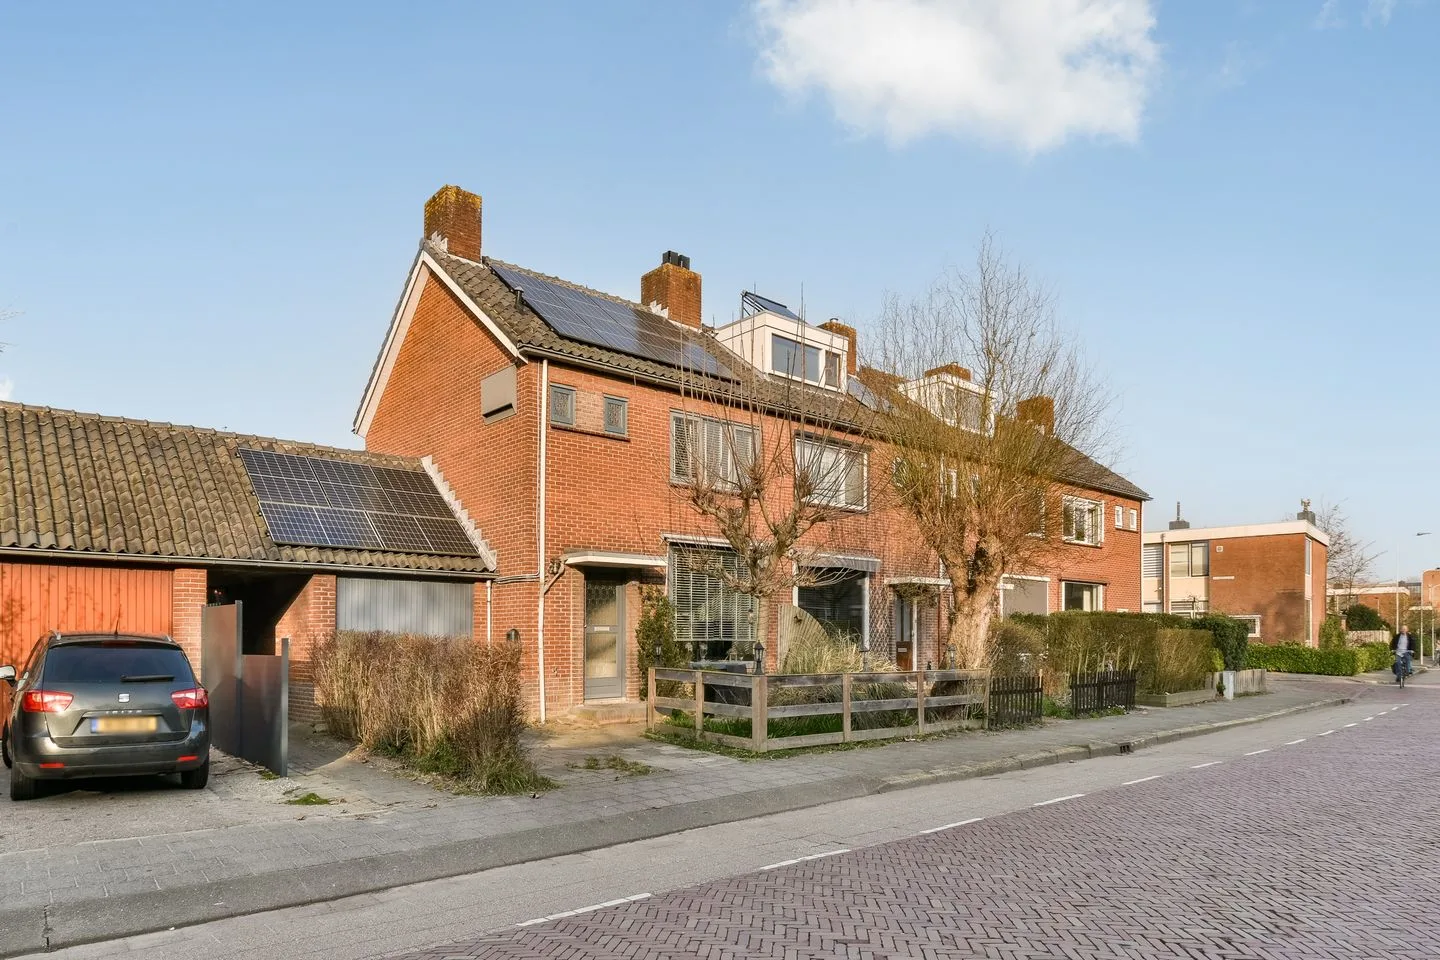
Gildenweg 60
4204GJ Gorinchem
€ 425.000 k.k.
€ 4.293/m²
CSave as favorite- Living area
- 99 m²
- Land area
- 213 m²
- Bedrooms
- 4
-
- Available
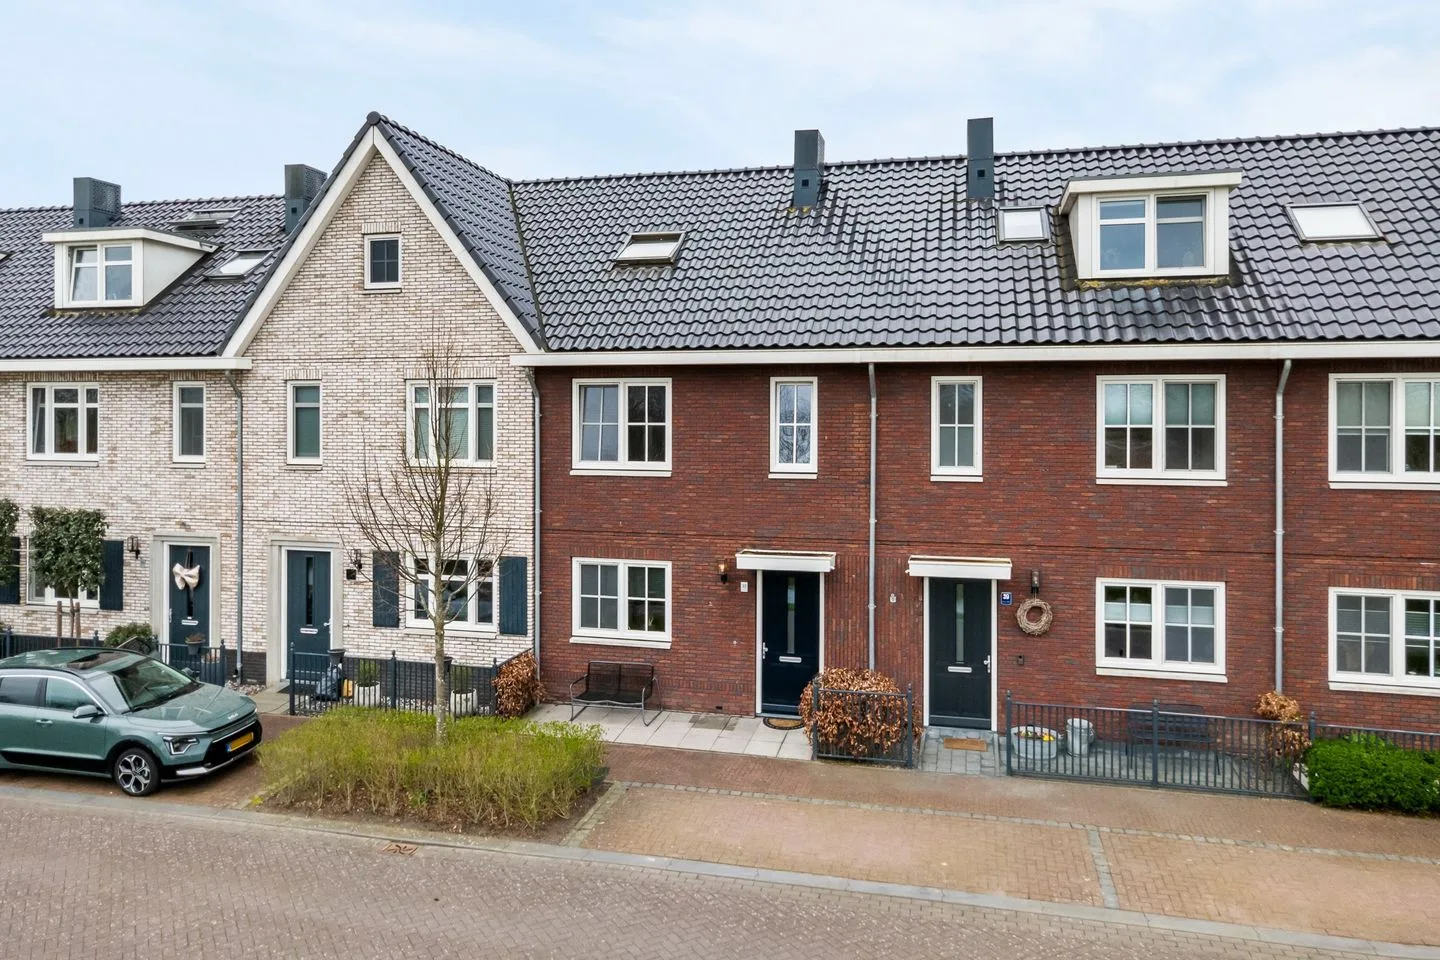
Baijensweer 33
3371PA Hardinxveld-Giessendam
€ 439.995 k.k.
€ 3.235/m²
CSave as favorite- Living area
- 136 m²
- Land area
- 157 m²
- Bedrooms
- 6
Reviews (41)
Review platforms
BronscoresTotal score
41 total reviews

Funda
21 reviews on Funda

20 reviews on Google
-
Parallelweg 115
9De communicatie verliep heel soepel en snel. We zijn goed geïnformeerd over belastingtechnische vragen en voorwaarden. We hebben een kundig advies ontvangen over de financiële afwikkeling. Onze makelaar heeft het hele traject binnen een maand afgerond. Van het maken van foto's en filmpjes, het plaatsen op funda tot aan het informeren van de koper en het opstellen van het koopcontract. Top!
-
Groenenweer 31
10Translated by AIHad a great and very clear intake in advance and was also well supported during the process. The real estate agent was always reachable, so quick responses back.
-
Piet Bernhard
10Translated by AIMaking top presentation and is great supported and relieved
-
Jac. P. Thijssesingel 52
10Translated by AIPleasant cooperation and know exactly how the market looked at that moment. Presentation was excellent and particularly professional set up. Everything clear and top organized
-
Marco Advokaat
10Translated by AIStuij and van Dijk have helped me very well with the sale of my house. The communication was clear and pleasant from the beginning. They were always friendly and thought well with me. The photos and presentation of my house looked nice. I am very satisfied with their work and definitely recommend this real estate agent.
-
Kievitlaan 36
10Translated by AIPersonal, involved, driven and expert with market knowledge. A real estate agent who is meaningful to his clients. I can recommend this real estate agent to everyone.
-
Thorbeckelaan 21 A
10Translated by AII was well assisted by Stuij en van Dijk real estate agents. All staff were friendly and easy to reach when I had questions. Time is taken for you and there is personal contact. The staff came across as knowledgeable and gave me good advice. Also, the customer is considered by for example planning the possessions as much as possible one after the other. I also found it a big advantage that Stuij en van Dijk has everything under one roof (real estate agent & mortgage advisor) this …
-
De Wiel 184
7Translated by AIWell helped with the sale of our house, but responding to questions via email a bit faster is a point for improvement.
-
Rivierdijk 574
8Translated by AIThe contact was smooth and transparent. Competent staff which caused my house to sell quickly.
-
Boorstraat 29
10Translated by AIThe sale has gone very well. Friendly people who kept you constantly informed. Passed on the viewers in time when they came. Called when the viewers were gone. Short version: A very good real estate agent.
-
Helling 12
10Translated by AII think they did super well. Really a recommendation. House sold in 2 weeks top. Very happy with it👍
-
Willem van Arkellaan 27
10Translated by AIVery happy with the good service of this real estate agent! If you want to achieve a good result in a pleasant way, go to Stuij & van Dijk.
-
Het Bos 9
10Translated by AIThe sale went smoothly, quickly and well. It's nice to be taken care of by this realtor. Very happy with it! So a recommendation.
-
Ds. Poortstraat 10
9Translated by AIThe contact was very pleasant. Short lines of communication! Clear explanations to questions. Relax, selling your house through this realtor! Top
-
Zakdragerstraat 19
9Translated by AIA broker with a good understanding of the business who responds quickly! Very satisfied with the entire process and I definitely recommend Stuij and Van Dijk, call them if you are looking for a good and reliable real estate agent.
-
maurice de bruin
10 -
Bjorn Lagendijk
10 -
danica kraaijeveld
10 -
Paul Bondam
10 -
Marloes De Bruin
10Translated by AIFantastic real estate agent! Thinking with you! A must-recommend when you want to sell your house quickly!