
Mart Makelaars staat voor betrouwbare en persoonlijke woningverkoop in Gorinchem. Met jaren ervaring op de markt en een sterke focus op klantgerichtheid, helpen we u zorgvuldig en transparant door ieder verkoopproces. Ons team biedt dienstverlening in aankoop, verkoop en taxaties. Wij werken met een duidelijke en professionele werkwijze, gesteund door certificaten als VastgoedCert, NWWI en NRVT. Onze kennis is actueel dankzij jaarlijkse...
Current housing stock
-

- Available
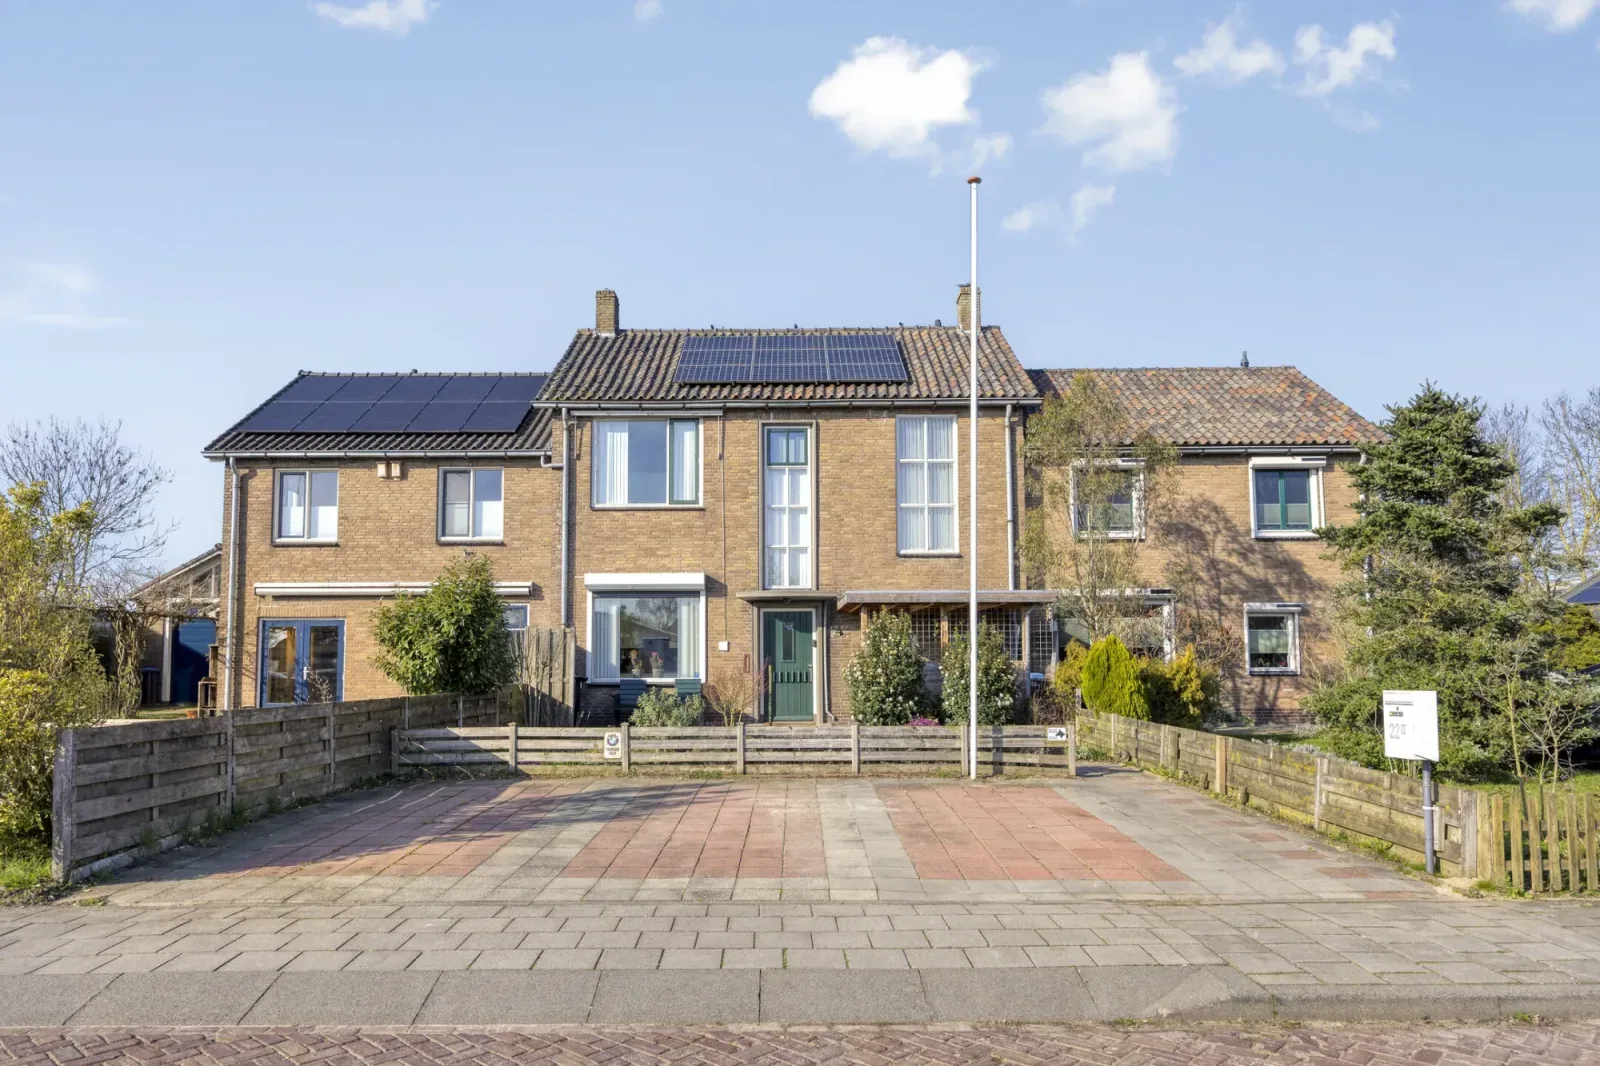
Burgstraat 53
4201AB Gorinchem
€ 650.000 k.k.
€ 2.754/m²
BSave as favorite- Living area
- 236 m²
- Land area
- 155 m²
- Bedrooms
- 3
-
- Available
Hagemuntstraat 21
4205GA Gorinchem
€ 289.000 k.k.
€ 2.833/m²
ASave as favorite- Living area
- 102 m²
- Land area
- —
- Bedrooms
- 3
-

- Sold
Spion 2
4208AM Gorinchem
€ 850.000 k.k.
€ 4.857/m²
ASave as favorite- Living area
- 175 m²
- Land area
- 239 m²
- Bedrooms
- 5
-

- Sold subject to confirmation
Annie M.G. Schmidtlaan 48
4207VD Gorinchem
€ 475.000 k.k.
€ 4.025/m²
BSave as favorite- Living area
- 118 m²
- Land area
- 200 m²
- Bedrooms
- 4
-

- Sold
St. Hubertuslaan 16
4205ZB Gorinchem
€ 415.000 k.k.
€ 4.234/m²
CSave as favorite- Living area
- 98 m²
- Land area
- 215 m²
- Bedrooms
- 4
-

- Sold
Prinses Margrietstraat 13
4241BA Arkel
€ 495.000 k.k.
€ 3.991/m²
ASave as favorite- Living area
- 124 m²
- Land area
- 191 m²
- Bedrooms
- 3
Reviews (23)
Review platforms
BronscoresTotal score
23 total reviews

Funda
11 reviews on Funda

12 reviews on Google
-
Spion 2
10Wij zijn erg tevreden over de begeleiding van Martin tijdens de verkoop van onze woning. De communicatie verliep altijd prettig en duidelijk. Martin was betrokken, dacht goed mee en was altijd bereikbaar om vragen te beantwoorden of even te overleggen. Dat gaf ons veel vertrouwen tijdens het verkoopproces. Ook van de kopers en andere kijkers kregen wij terug dat zij de bezichtigingen als erg prettig hebben ervaren. Martin nam de tijd, was vriendelijk en professioneel en wist ied…
-
St. Hubertuslaan 16
9Deskundig advies en prettige begeleiding door dit makelaarskantoor. Snelle opvolging van afspraken en helder en transparant in contact. Maakt gebruik van diverse socials en andere kanalen.
-
S.G.J.
10Snel, vakkundig en geen onnodige praatjes. Zeer duidelijk en volledig taxatierapport opgeleverd binnen een korte termijn. Aan te bevelen!
-
Bertus van den heuvel
8Deskundig advies en prettige begeleiding door dit makelaarskantoor. Bespreekt duidelijk plan van aanpak van de verkoop en de mogelijkheden van presenttie van de aan te bieden woning. Snelle opvolging van afspraken, helder en transparant in contact. Maakt gebruik van diverse socials en andere kanalen. Bertus van den Heuvel, St. Hubertuslaan 16, Gorinchem
-
Arpi Lomteva
10 -
robert verweij
8Translated by AIAn appraisal can always raise questions...not with Mart. Fast and accurate, and a report that perfectly aligns with the wishes and expectations, and also arranged very quickly. Isn't that what you want??
-
Hoornwerk 8
10Translated by AIMartin knows what he's talking about for sure, due to his years of experience. And pleasant to deal with, always easy to reach and ready for all your worries or questions.
-
Gerrit Jan van der Grijn
10 -
Kiri Vroon
10Translated by AIMartin helped us with the sale of our house, gave us tips and supported us in the purchase of our new home. Martin is really a very pleasant real estate agent, has a lot of knowledge, can explain everything in a nice way and is super enthusiastic. Martin is easily accessible and responds quickly to questions. I would recommend Martin to everyone in my area if they need a real estate agent!
-
St. Hubertuslaan 26
10Translated by AIMartin is very pleasant to deal with, is patient, gives good advice and works together with local and expert colleagues.
-
Elisabeth Kuyperstraat 63
9Translated by AIThe broker is friendly, expert and honors made appointments. The entire process is well explained by him.
-
Marja Ploeg
10Translated by AIFriendly realtor with a lot of knowledge of this region. Martin guided us in a very pleasant way during the sales process of our house (which has now been sold quickly). We are happy that we went into business with him.
-
Dé online keukenadviseur
10Translated by AIToday I had the pleasure of getting to know Martin. Someone with clearly a lot of knowledge and experience. You won't find it more personal in Gorinchem. And that’s what we are looking for. Knowledge, quality and personal attention with good advice!
-
Jennifer Van Vuuren
10Translated by AIMartin was the selling broker of our new house. Where some brokers are slippery and want to earn as much money as quickly as possible, this broker is a very pleasant exception. The communication was personal, involved, and clear. Everything was also arranged perfectly for us as buyers. Not only a nice experience for the sellers, but definitely also for us as buyers. Highly recommended!
-
Dikkertje Dap 52
10Translated by AIProfessionally supported. Good and thorough workmanship. Helped in a friendly manner with the sale. Mart guided us through the process in a special way.
-
Henriette Roland-Holststraat 3
10Translated by AIA fine real estate agent, easily accessible, helpful and our house was sold quickly and well. Highly recommended!
-
Schuitenvoerderstraat 43
10Translated by AIMart Realtors is honest, has good communication, and is always there for you. A pleasant, accessible realtor to work with.
-
Notendreef 2
10Translated by AIWe have had very good experiences with Martin as a buyer's agent. He gave us expert advice during the viewings of the properties we were interested in and advised well in the negotiations (both for the property that we ultimately did not buy and the property that we did buy), clearly prioritizing our interests and preventing us from bidding higher than necessary. With this, he has more than earned his fee. Martin knows…
-
Catharina van Rennesstraat 24
10Translated by AIMartin helped us tremendously with the sale of our house and the purchase of our new home. He guided us through the process in a calm manner, where we could always approach him with questions. Because he has been in the profession for a long time, he has extensive knowledge, many connections in the area, and knows how the market works. This allowed him to advise us well, and then take everything out of our hands when arranging photographers, viewings, negotiations...
-
Koningin Julianastraat 15
10Translated by AIMartin knows a lot about the local market and guided us through the entire process in a pleasant and friendly manner. We were always kept well informed.