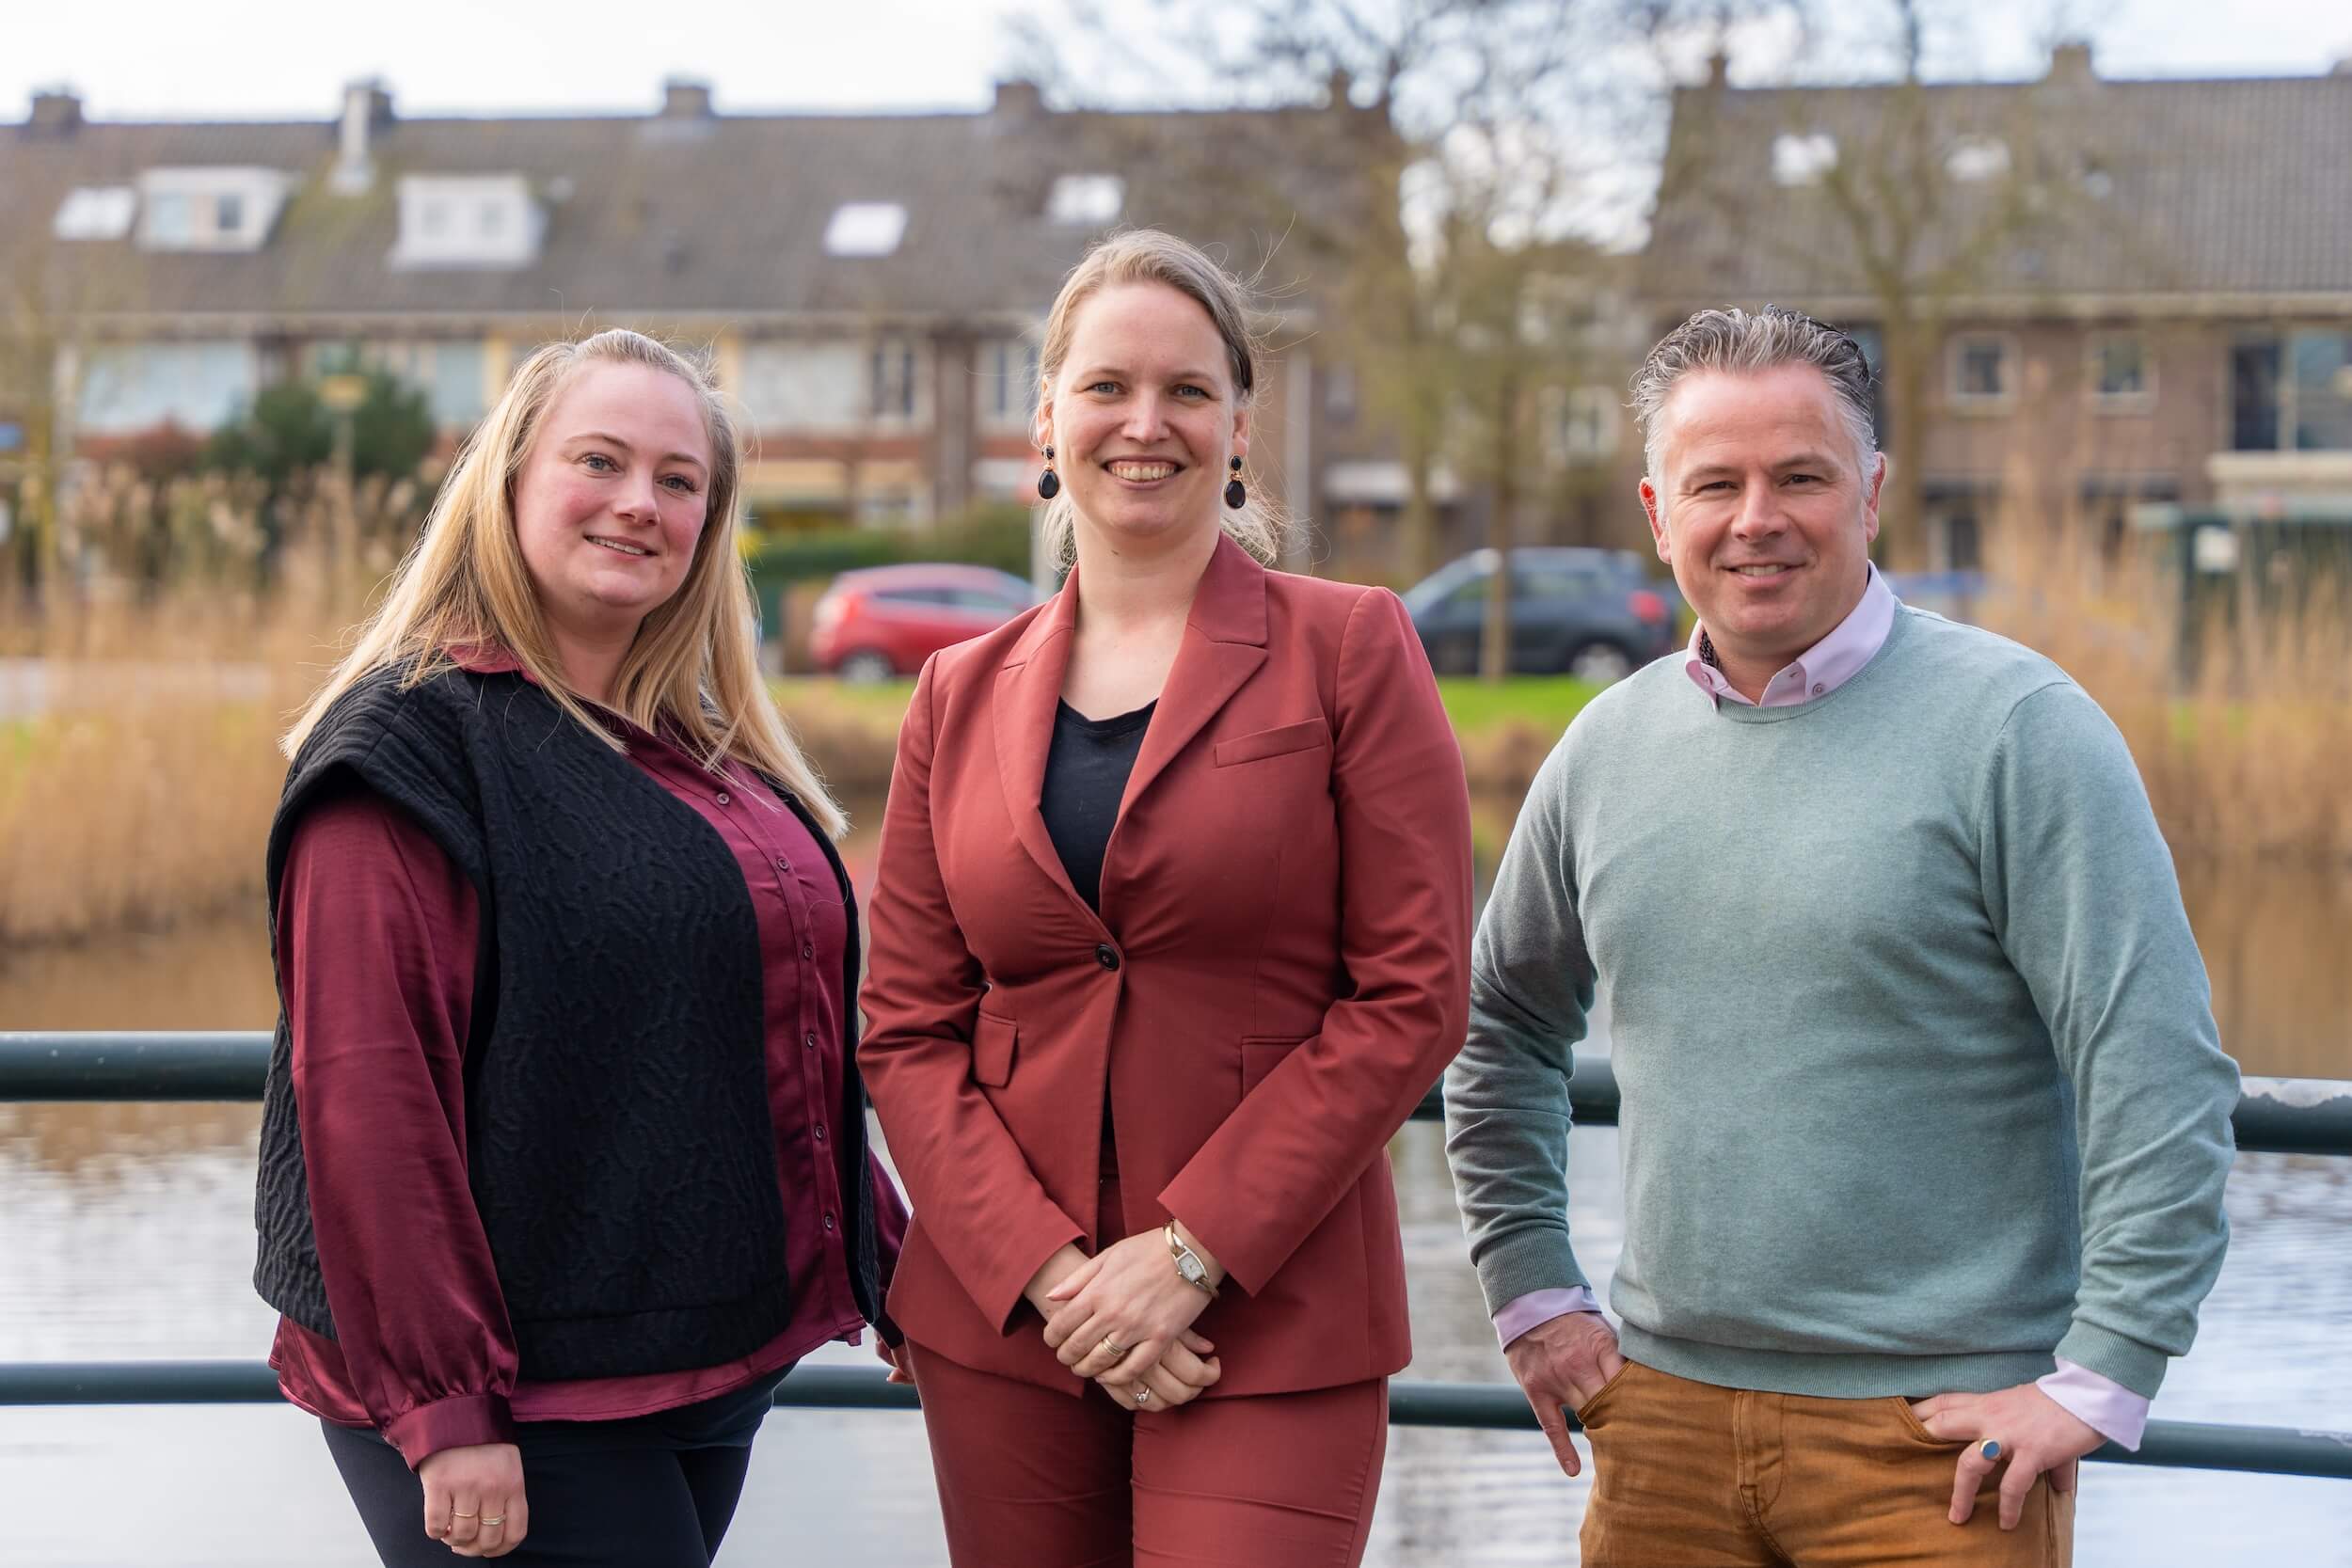
Cas Makelaardij B.V.
At Cas Makelaardij, you are in good hands for all your real estate needs. With years of experience as a realtor, I specialize in sales, purchases and appraisals. My approach is personal and focused on the wishes of my clients, with the aim of a smooth and successful transaction. Whether you are looking for a new home or want to sell your current property, I will guide you through every step of the process. My knowledge of the local mark...
Current housing stock
-
- Available
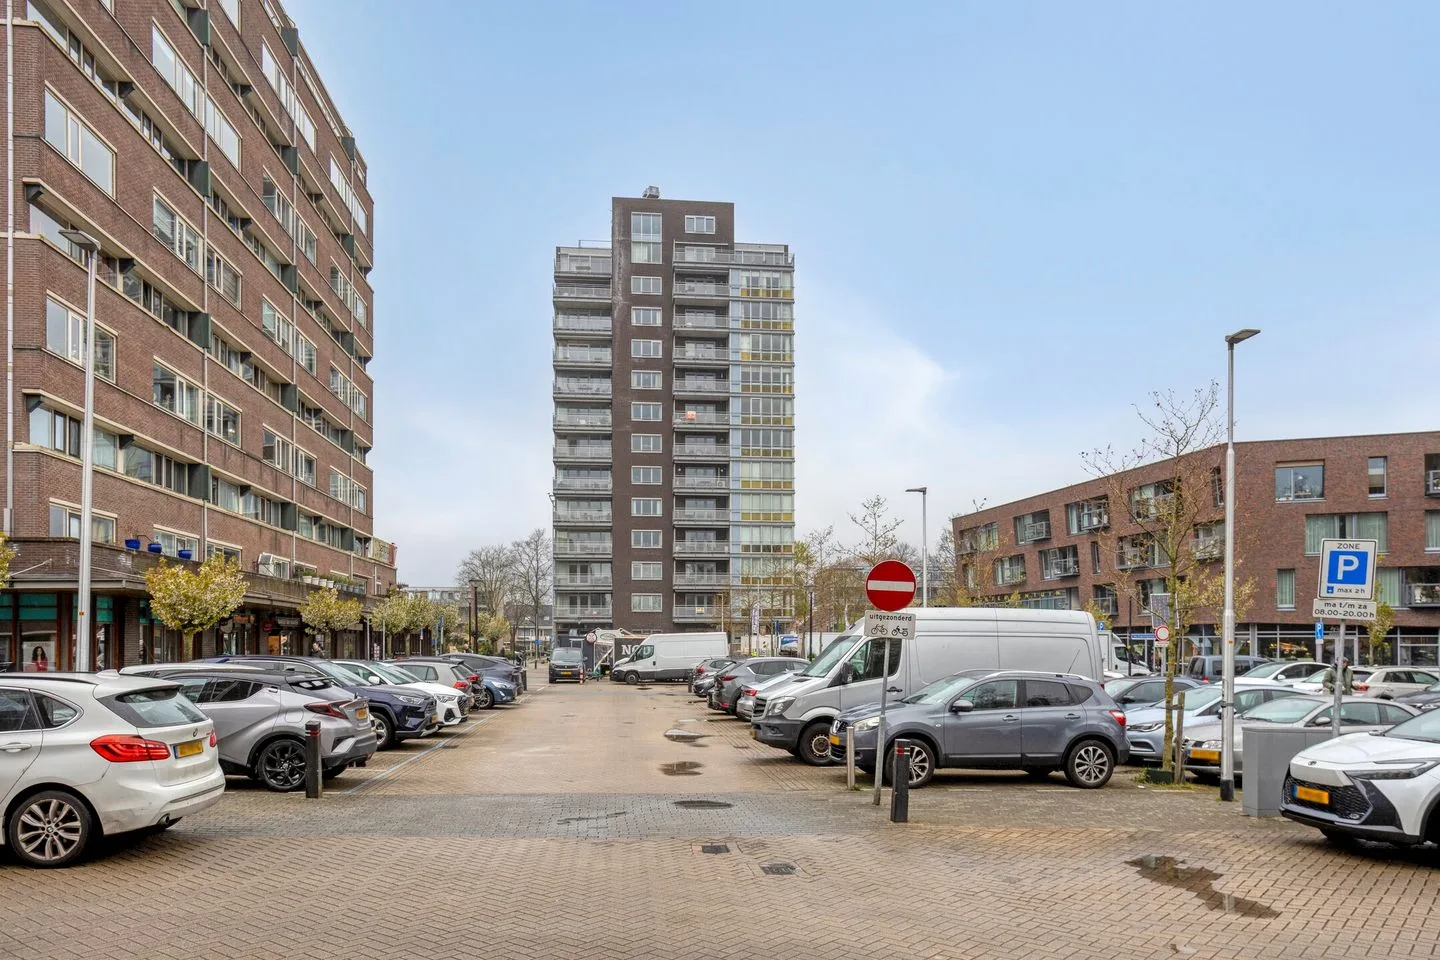
Hoge Rijndijk 272 D 1
2314AL Leiden
€ 325.000 k.k.
BSave as favorite- Living area
- 63 m²
- Land area
- —
- Bedrooms
- 2
-
- Available
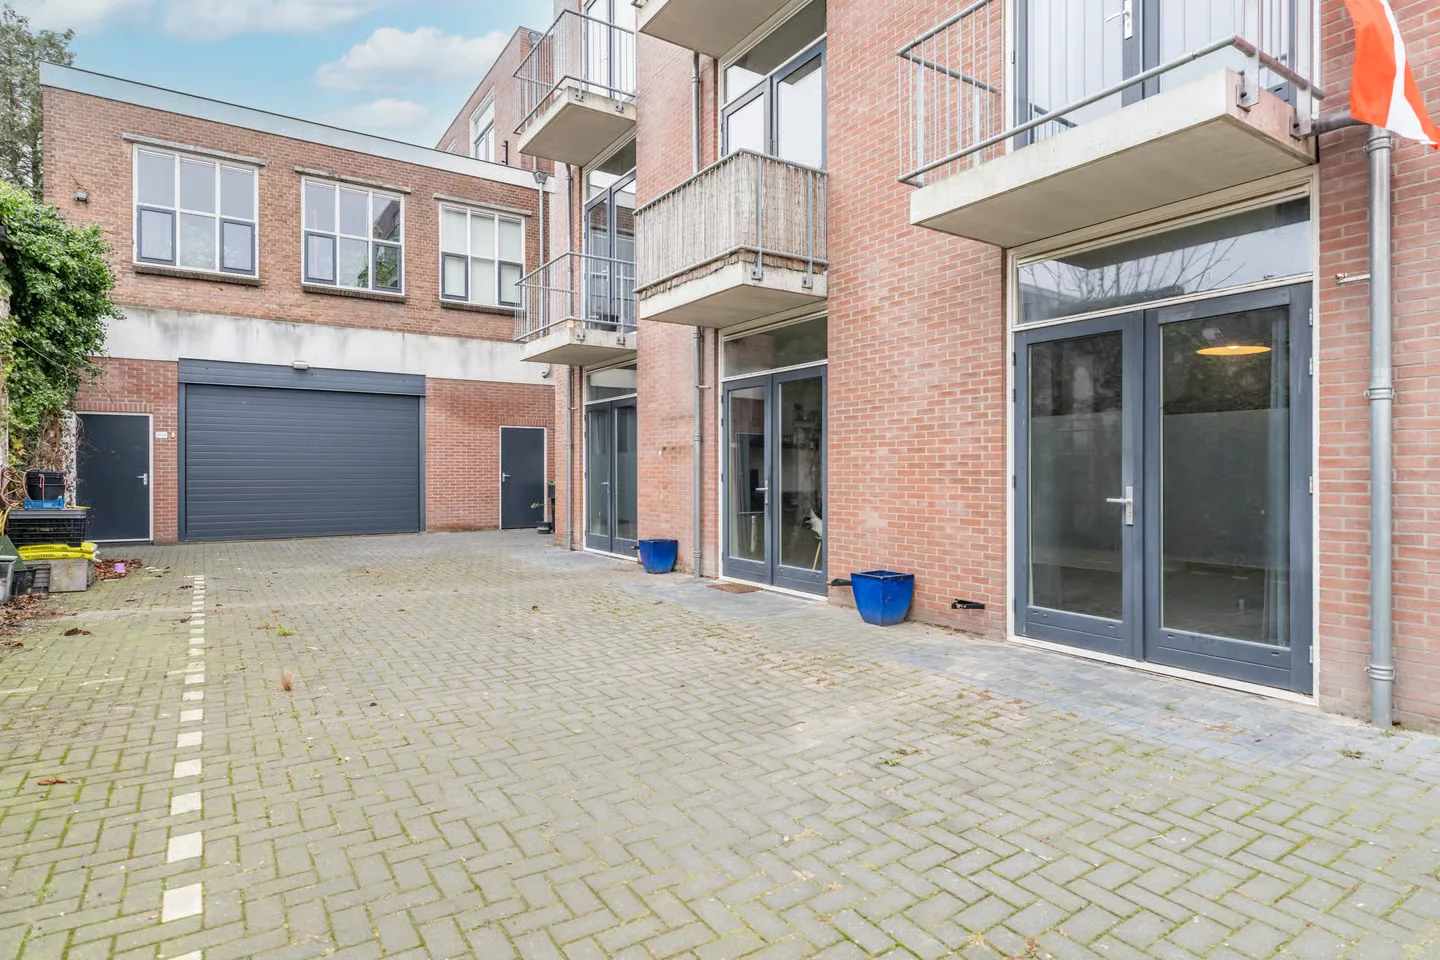
Hollandse Tuin 20
2342BG Oegstgeest
€ 1.250.000 k.k.
€ 7.396/m²
ASave as favorite- Living area
- 169 m²
- Land area
- 319 m²
- Bedrooms
- 5
-
- Available
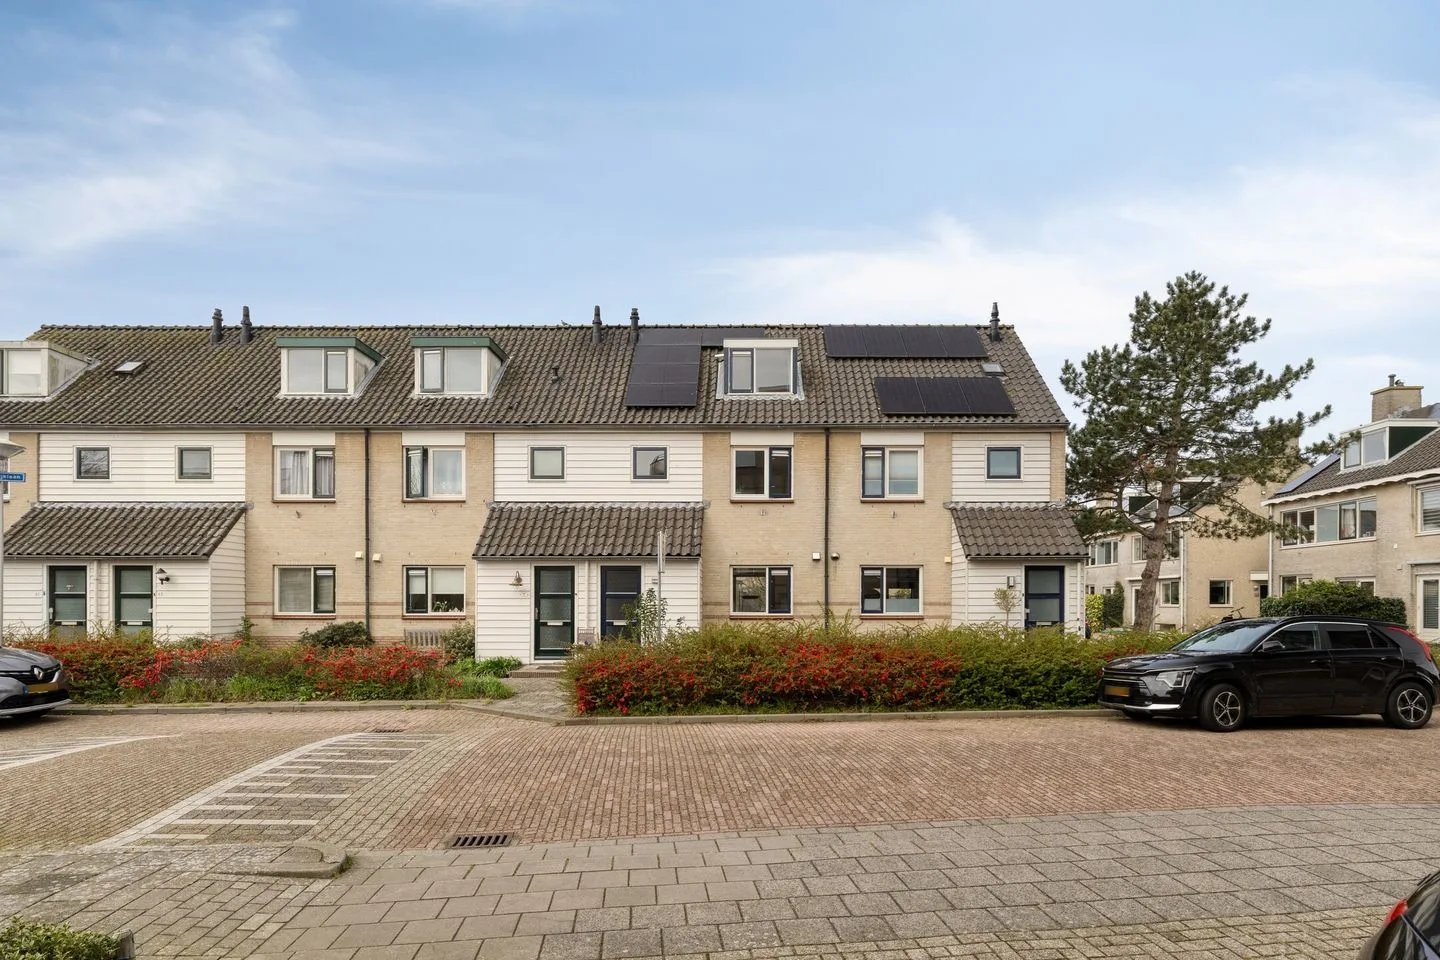
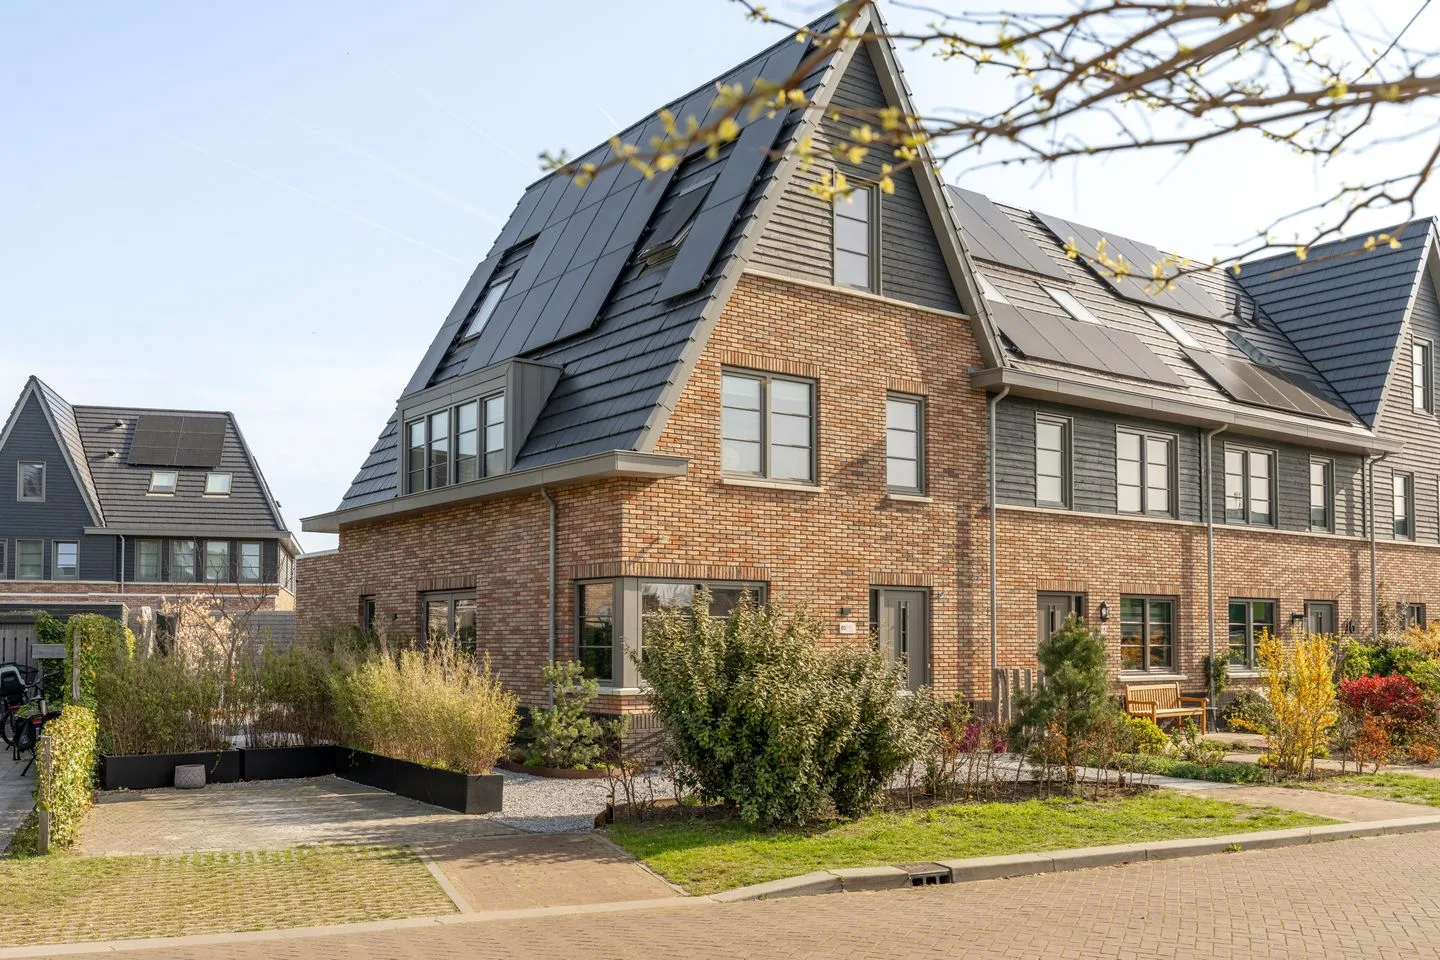
Mangoweg 271
2321HZ Leiden
€ 815.000 k.k.
€ 6.037/m²
A+++Save as favorite- Living area
- 135 m²
- Land area
- —
- Bedrooms
- 3
-
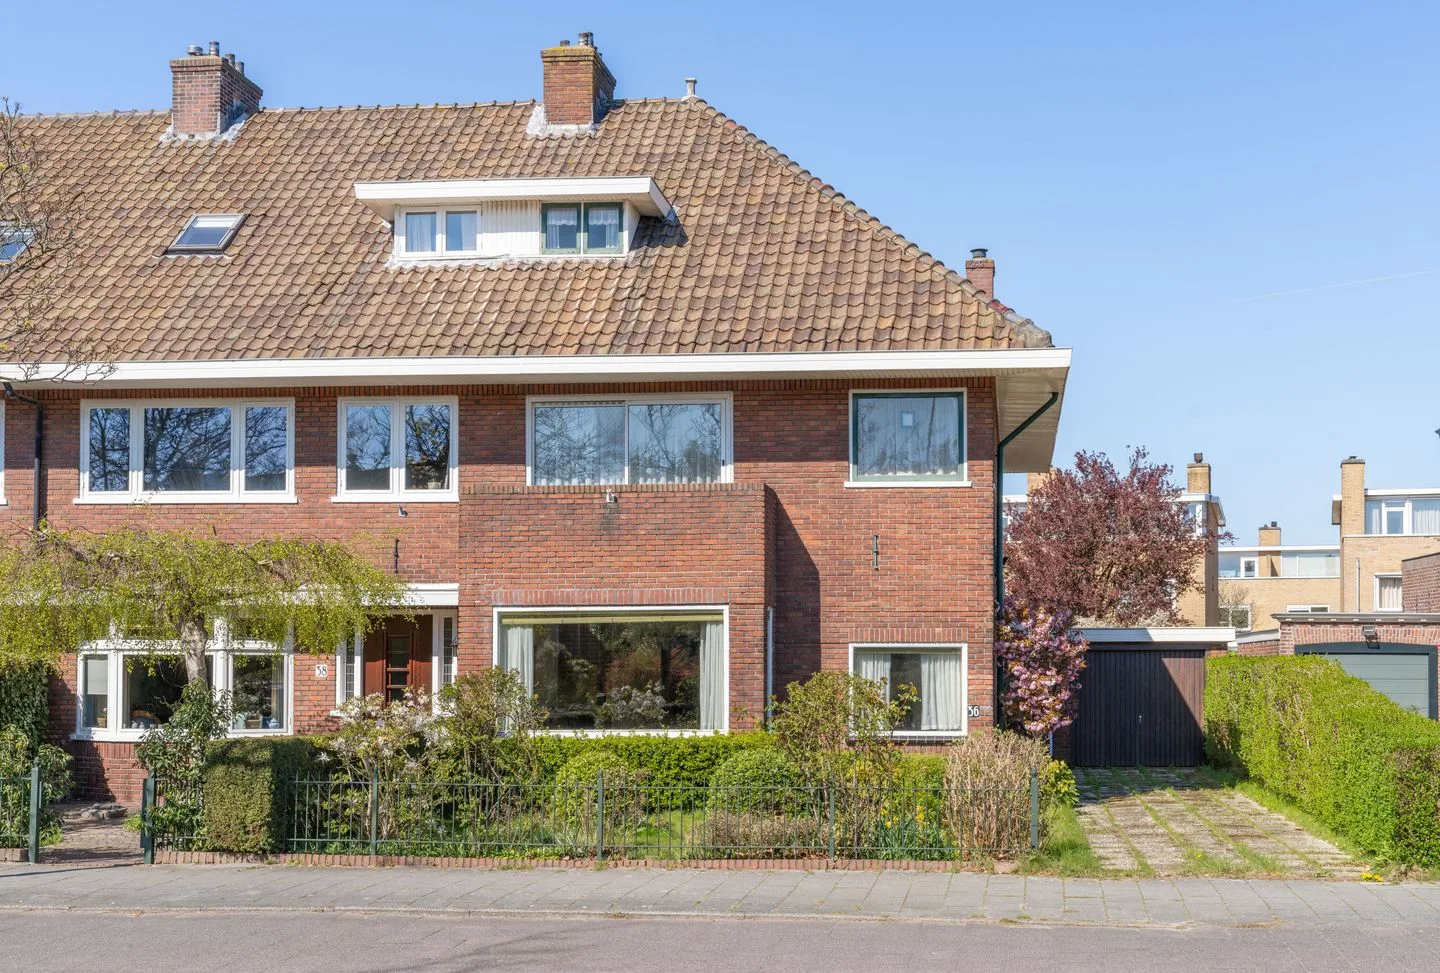
- Under consideration
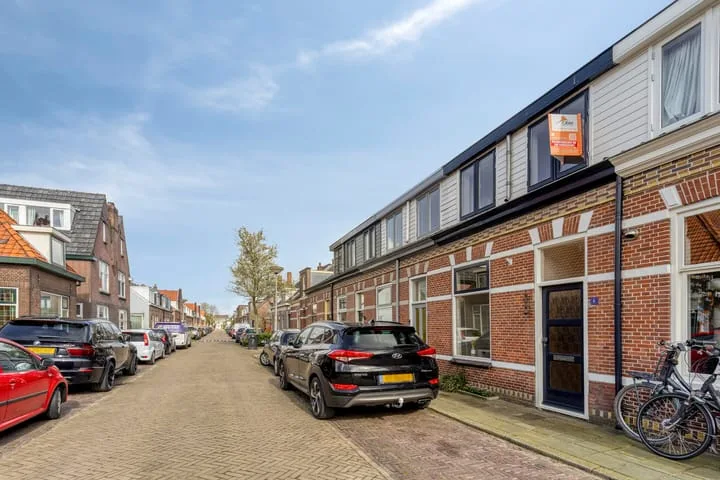
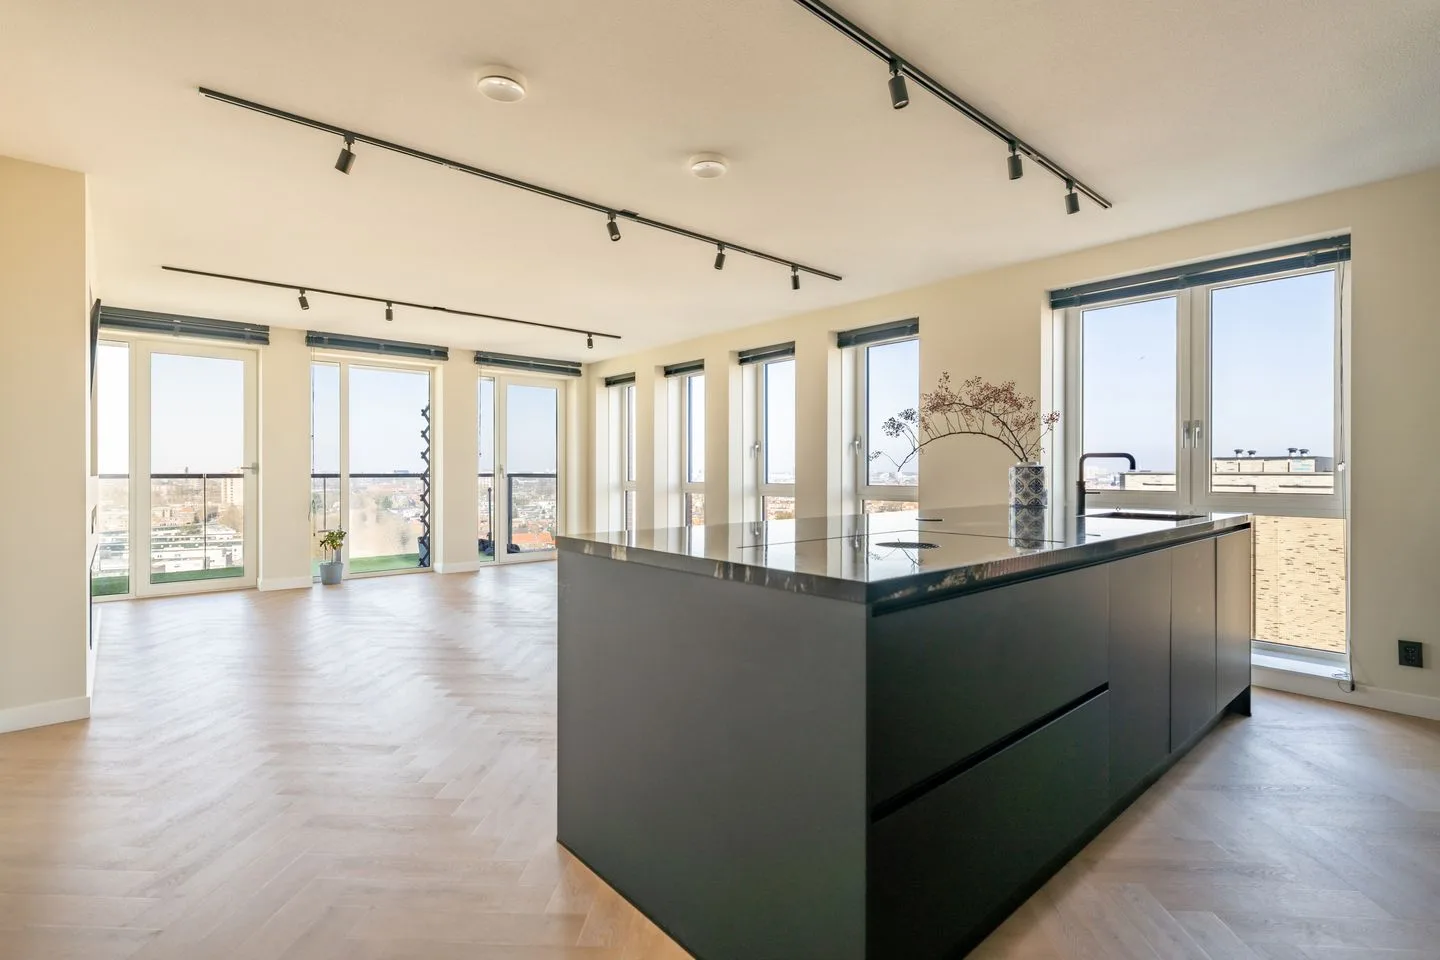
Rijnzichtweg 36
2341AC Oegstgeest
€ 695.000 k.k.
€ 4.728/m²
FSave as favorite- Living area
- 147 m²
- Land area
- 401 m²
- Bedrooms
- 5
-

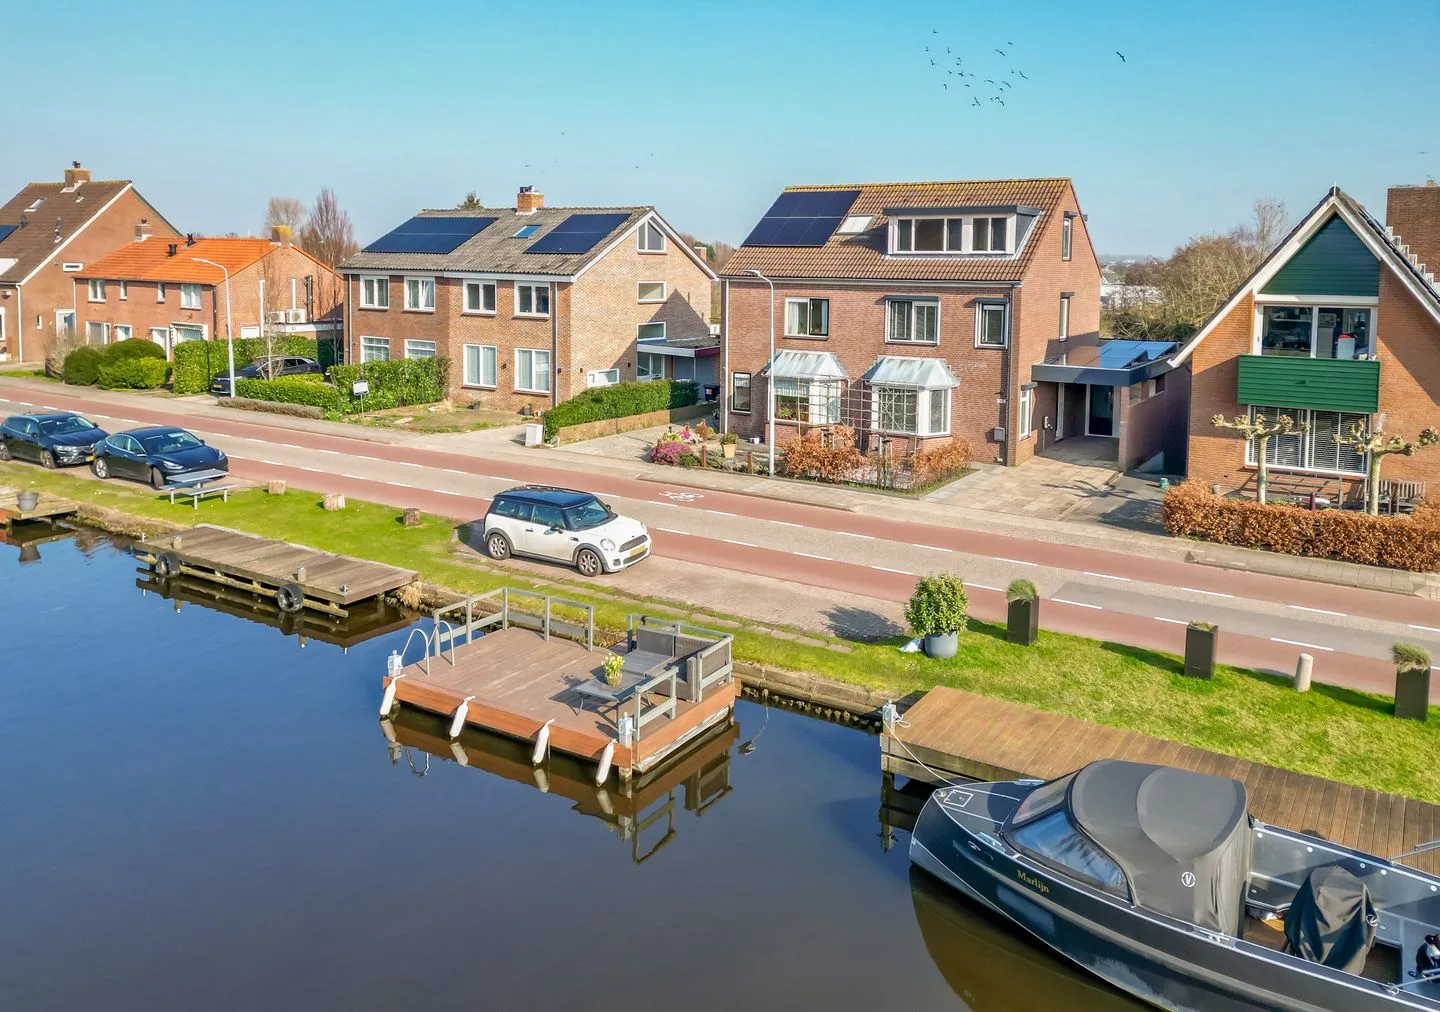
- Purchased
Karel Doormanlaan 1
2341SW Oegstgeest
€ 795.000 k.k.
€ 5.559/m²
CSave as favorite- Living area
- 143 m²
- Land area
- 293 m²
- Bedrooms
- 4
-
- Sold subject to confirmation
Lisserdijk 325
2165AB Lisserbroek
€ 825.000 k.k.
€ 4.797/m²
A+Save as favorite- Living area
- 172 m²
- Land area
- 355 m²
- Bedrooms
- 6
Reviews (105)
Review platforms
BronscoresTotal score
105 total reviews

Funda
29 reviews on Funda

76 reviews on Google
-
Ruben D.
10 -
Karel Doormanlaan 1
10Translated by AICas advised us well. We had been searching for a long time ourselves but it didn't work out. In the end, it was with Cas in 1x hit and even offered lower than we would have done ourselves!
-
Agnieszka Krygowska
10 -
Rafal Jonatowski
10 -
Vuurland 31
10Translated by AISuper professional real estate agent, flexible, always available when I call, a good sales plan made, really top
-
M Pavan
10 -
Danique Heshof
10 -
G Beek
10Translated by AICas was very pragmatic and clear in communication for our appraisal. Moreover, it is a neat and friendly person, and our report was delivered quickly. Recommended if you are looking for a quick & reliable appraiser.
-
D v B
10Hartstikke prettige ervaring en samenwerking. Zeker een aanrader!
-
J Bosman
10Cas is werkt prettig en snel en denkt mee met zijn klanten, zeker een aanrader!
-
Sander Schaaff
10Snel, meedenkend en vriendelijk!
-
Gerard van Zutphen
10Translated by AIThe appraiser kindly helped us and the report was quickly made and sent.
-
Elies Potters
10Cas Makelaardij is echt een aanrader! Op aanraden van onze hypotheekadviseur heeft Cas ons huis getaxeerd, dit heeft hij zeer vriendelijk en professioneel gedaan. Binnen een korte tijd was het rapport compleet. Bedankt Cas!
-
Berkelseweg 35
10Zijn waardebepaling was tot op de euro nauwkwurig met onze uiteindelijke verkoopprijs. Deskundig. Rustig. Netjes. Durft het met ons oneens te zijn wanneer dat nodig is en weet ons dan met goede argumenten te overtuigen.
-
J
10Cas is een erg fijne makelaar, korte lijnen en is er als je hem nodig hebt. Hij geeft goed advies en denkt met je mee.
-
Smileoftree
10Zeer professioneel! Echt een aanrader :)
-
Joppe Duindam
10De afspraak voor de taxatie kon snel plaatsvinden. Binnen enkele dagen was het rapport in ons bezit. Prima service en heldere afspraken.
-
vanessa schouten
10Cas is zeer vriendelijk. Duidelijk in de communicatie en deskundig.
-
Evelien Grootveld
10De taxatie was van tevoren goed uitgelegd zodat ik wist waar ik aan toe was. Taxatie zelf snel, deskundig en correct uitgevoerd. Mocht ik ooit weer een taxatie nodig hebben of voor iemand uit mijn omgeving, dan raad ik CAS Makelaardij zeker aan!
-
Nassaulaan 11
10Als je Cas nodig hebt is hij er voor je. Cas is een goede makelaar die probeert met je mee te denken. Goede adviezen geeft en doortastend is. Zeker een aanrader!