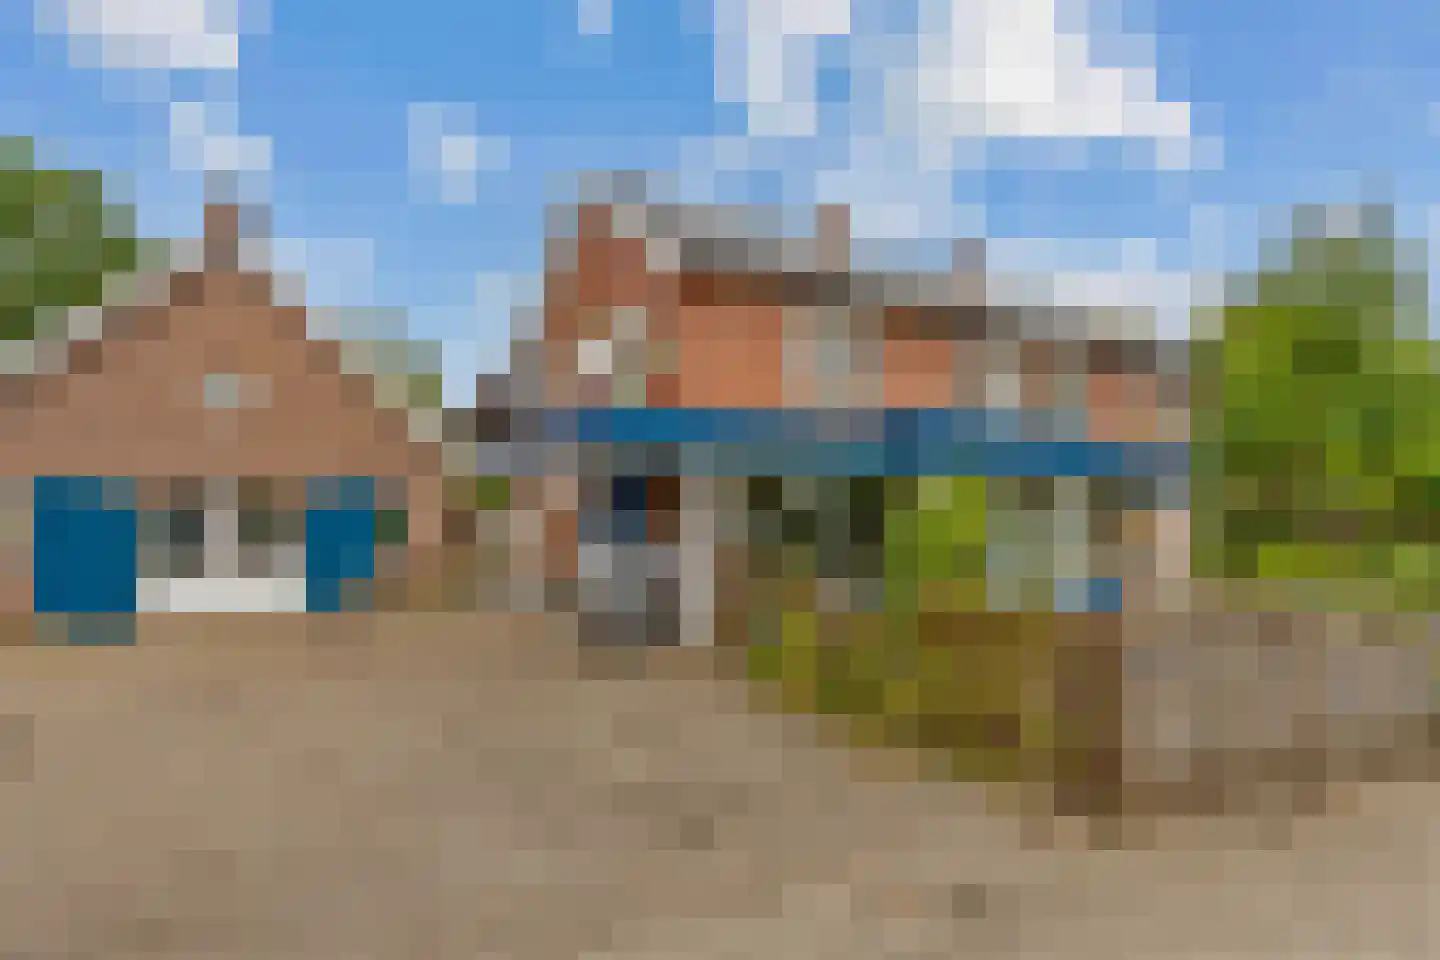
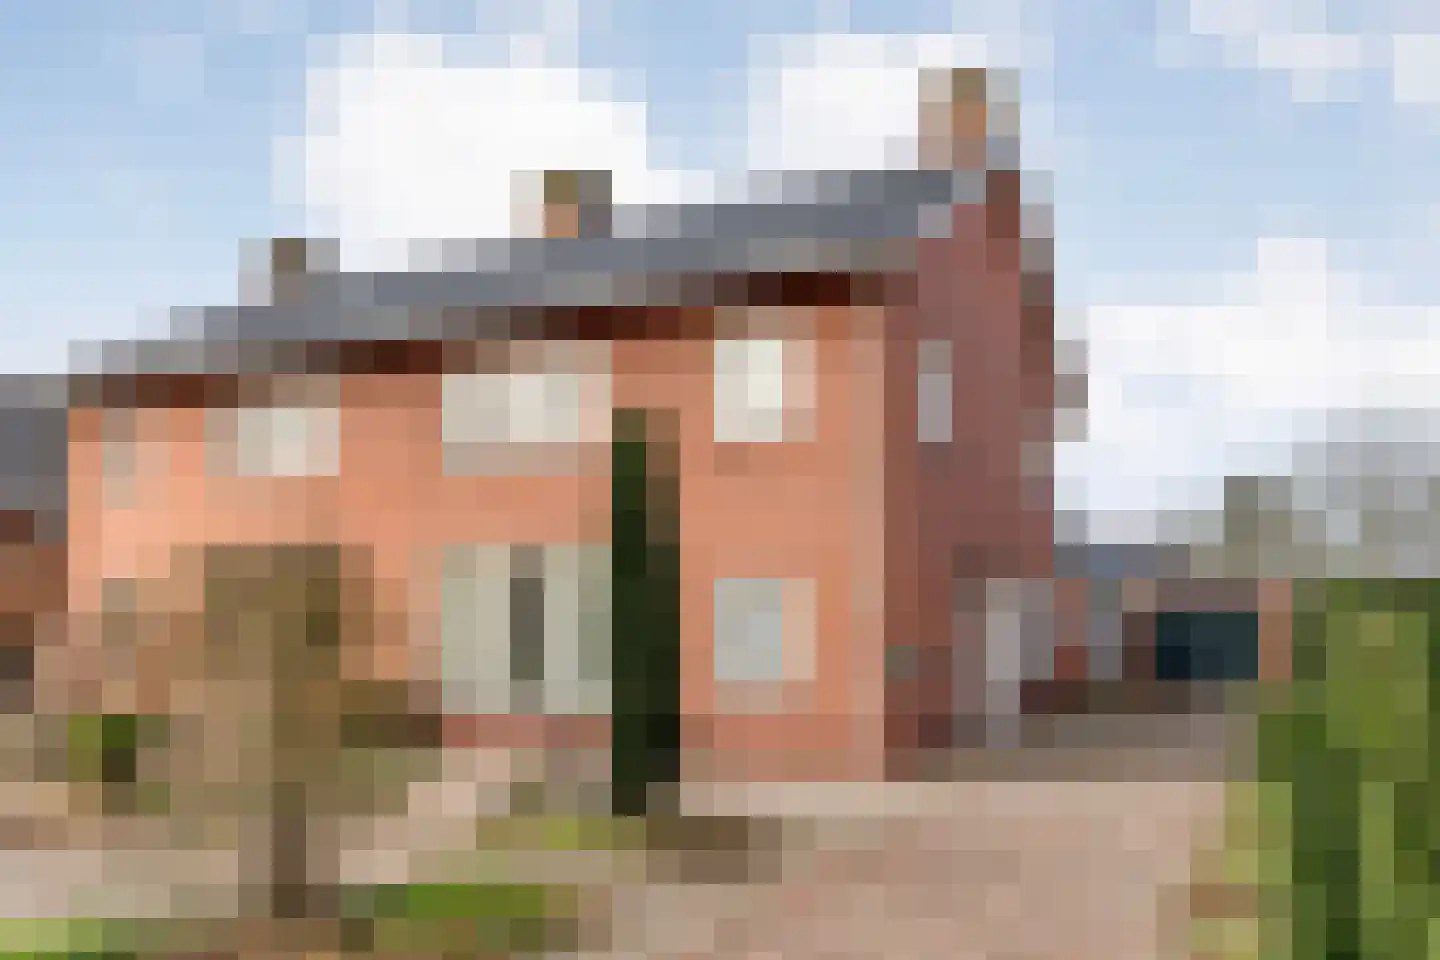
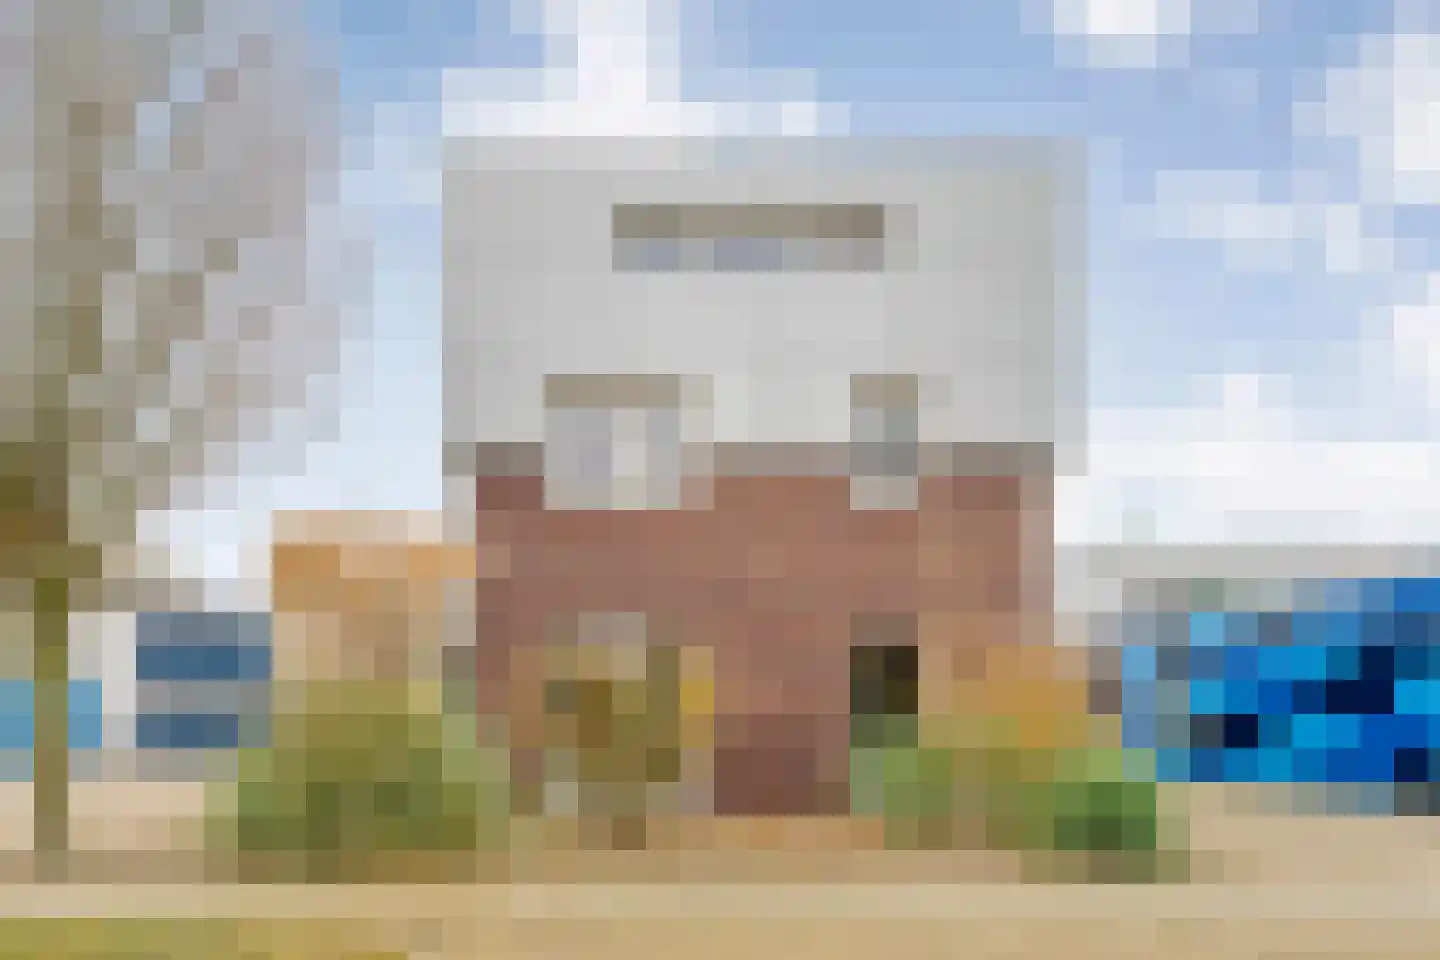
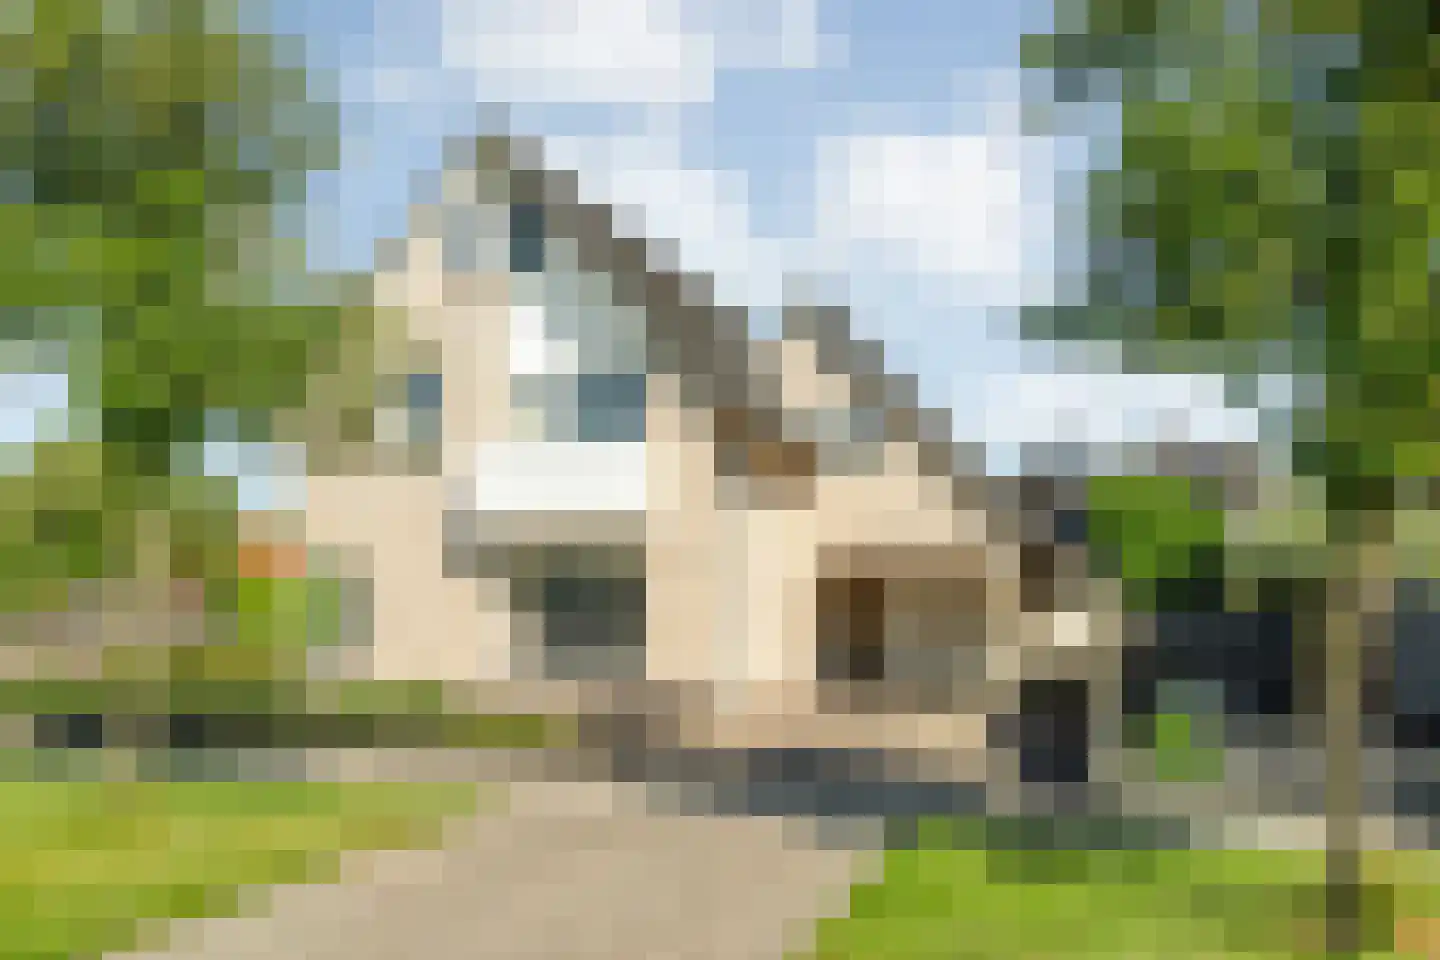
- Available
De Dijnsel 49
7665DM Albergen
€ 669.000 k.k.
€ 3.362/m²
- Living area
- 199 m²
- Land area
- 516 m²
- Bedrooms
- 5
Searching in 18 houses in Albergen
Type to search. Use arrow down and arrow up to navigate through results and press Enter to open.
Hidden search suggestions.
View current properties in Albergen or search targeted on street, postal code and property characteristics.
View the current housing stock in Albergen and quickly filter by price, living area, rooms and more. There are currently 18 houses in this place within our selection. View also 13 sold houses in Albergen for extra insight into the local housing market.
7665DM Albergen
€ 669.000 k.k.
€ 3.362/m²
7665SJ Albergen
€ 925.000 k.k.
€ 4.263/m²
7665RE Albergen
€ 939.000 k.k.
€ 3.880/m²
7665SC Albergen
€ 1.095.000 k.k.
€ 4.294/m²
7665RX Albergen
€ 690.000 k.k.
€ 2.760/m²
7665AV Albergen
€ 395.000 k.k.
€ 3.434/m²
7665TM Albergen
€ 349.000 k.k.
€ 3.116/m²
7665TM Albergen
€ 850.000 k.k.
€ 3.571/m²
7665BC Albergen
€ 449.000 k.k.
€ 2.771/m²
7665TK Albergen
€ 895.000 k.k.
€ 3.653/m²
7665AG Albergen
€ 435.000 k.k.
€ 2.861/m²
7665EH Albergen
€ 789.000 k.k.
€ 3.156/m²
7665CE Albergen
Price upon request
7665BC Albergen
€ 489.000 k.k.
€ 3.912/m²
7665AX Albergen
€ 459.000 k.k.
€ 2.923/m²
7665VD Albergen
€ 610.000 k.k.
€ 0/m²
7665VD Albergen
€ 569.000 k.k.
€ 4.153/m²
7665TC Albergen
€ 650.000 k.k.
€ 3.939/m²
Get free quotes from real estate agents with local market knowledge. Compare more than 28 real estate agents in Albergen.
Selling a home in Albergen? Compare all real estate agents in Albergen or view the top 10 real estate agents in Albergen for extra context for your choice.
Real estate agents make sharper offers when they know you're comparing — ask for quotes for sale or purchase.
Practical answers about housing supply, sales and comparing real estate agents in Albergen.
The costs of a real estate agent in Albergen depend on commission, setup costs, property presentation and the chosen service. Compare the 28 real estate agents in Albergen via the real estate agent page and request multiple quotes to compare rates and approach well.
Within our selection, we are currently showing 18 houses in Albergen. View also the sold houses in Albergen to compare the current offering with recent transactions.
Take into account not only price and living area but also maintenance, energy label, location, outdoor space and sales status. This way you compare houses in Albergen on more than just the asking price.
A local real estate agent knows the neighborhoods, recent transactions and demand in Albergen. By comparing 28 real estate agents in the region you get a better insight into prices, sales strategy and expected yield; the top 10 in Albergen provides a useful starting point.
Yes, when making a sales plan, a valuation in Albergen is wise. You gain insight into a realistic asking price and can then compare offers from real estate agents specifically.
View current location data on residents, WOZ development, housing stock, energy consumption, business activity and safety in Albergen. In 2026 were there 3.669 residents. The average WOZ value in 2025 is EUR 450.000.
These figures help to better assess and compare the housing stock in Albergen with recent sold homes. Orient yourself then on suitable top real estate agents in Albergen for sales advice in this region.
Residents
3.669
Last year: 2026
Average WOZ
EUR 450.000
Last year: 2025
Average income per person.
EUR 34.700
Source: AllNumbers
Crimes (current year)
42
Total registered
| Year | Residents |
|---|---|
| 2021 | 3.600 |
| 2022 | 3.610 |
| 2023 | 3.595 |
| 2024 | 3.555 |
| 2025 | 3.590 |
| 2026 | 3.669 |
| Year | Average WOZ |
|---|---|
| 2021 | EUR 328.000 |
| 2022 | EUR 376.000 |
| 2023 | EUR 419.000 |
| 2024 | EUR 442.000 |
| 2025 | EUR 450.000 |
Hoger
810
Praktisch
600
Middelbaar
1.320
Europa
65
Nederland
3.385
Buiten Europa
135
Label C
333
Label A
325
Label B
264
Label G
92
Label D
82
Label F
81
Label E
43
Label A+++
29
Label A+
20
Label A++
18
Label A++++
0
Label A+++++
0
| Year | Gas (m3) | Electricity (kWh) |
|---|---|---|
| 2020 | 1.570 | 3.590 |
| 2021 | 1.930 | 3.720 |
| 2022 | 1.530 | 3.570 |
| 2023 | 1.240 | 3.410 |
| 2024 | 1.190 | 3.600 |
Hoekwoning
Gas: 1.000 • Electricity: 2.560
Huurwoning
Gas: 1.060 • Electricity: 2.620
Koopwoning
Gas: 1.280 • Electricity: 3.640
Appartement
Gas: 1.180 • Electricity: 3.120
Tussenwoning
Gas: 970 • Electricity: 2.450
Vrijstaande woning
Gas: 1.380 • Electricity: 3.850
Twee-onder-één-kap woning
Gas: 1.170 • Electricity: 3.380
Total number of company establishments: 490
| Period | Crimes |
|---|---|
| jan 2026 | 2 |
| jul 2025 | 2 |
| jun 2025 | 3 |
| mei 2025 | 1 |
| mrt 2025 | 7 |
| mrt 2026 | 2 |
| nov 2024 | 3 |
| nov 2025 | 3 |
| okt 2024 | 6 |
| okt 2025 | 1 |
| sep 2024 | 4 |
| sep 2025 | 5 |
These figures give an indicative picture of safety trends in the living environment of Albergen.
Short answers based on current local statistics, handy for a quick comparison of the living environment.
Albergen telt in 2026 ongeveer 3.669 inwoners.
De gemiddelde WOZ-waarde in Albergen is in 2025 circa € 450.000.
Het gemiddelde inkomen per inwoner in Albergen ligt rond € 34.700 per jaar.
Voor het huidige jaar gaat het om ongeveer 42 geregistreerde misdrijven. Gebruik deze cijfers als indicatie en vergelijk trends per periode.
In Albergen komt vooral "Vrijstaande woningen" veel voor, met ongeveer 646 woningen.