- Sold
Rombout Hogerbeetsstraat 46 2
1052XE Amsterdam
€ 450.000 k.k.
€ 9.783/m²
A
Save as favorite
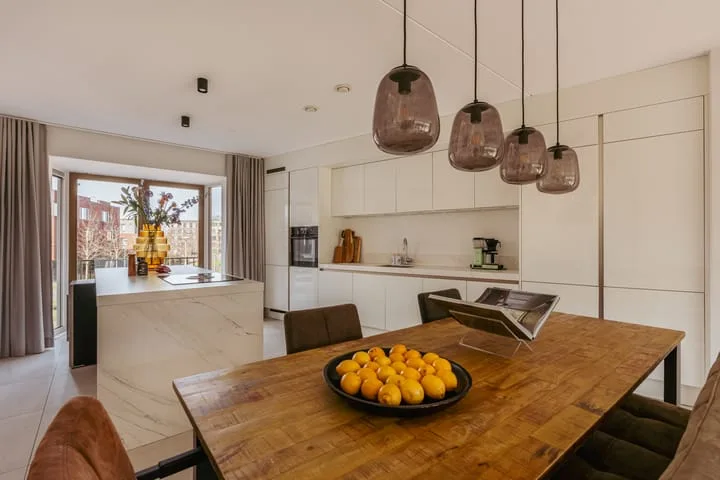
- Living area
- 46 m²
- Land area
- —
- Bedrooms
- 1