- Sold
Wilhelminastraat 115 2
1054WB Amsterdam
€ 450.000 k.k.
€ 9.574/m²
C
Save as favorite
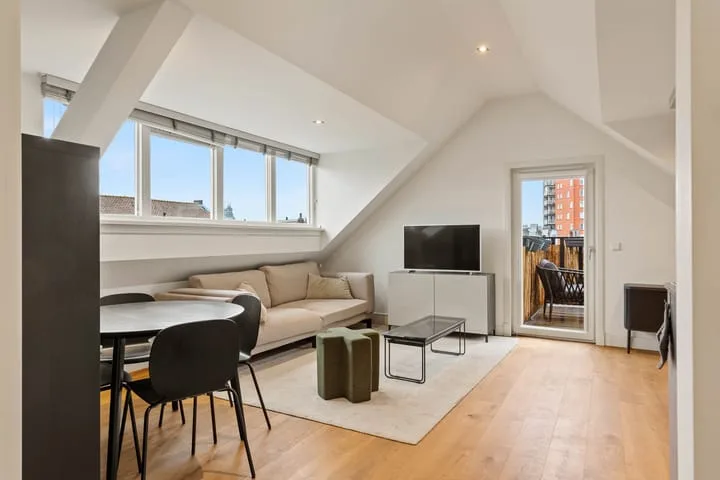
- Living area
- 47 m²
- Land area
- —
- Bedrooms
- 2