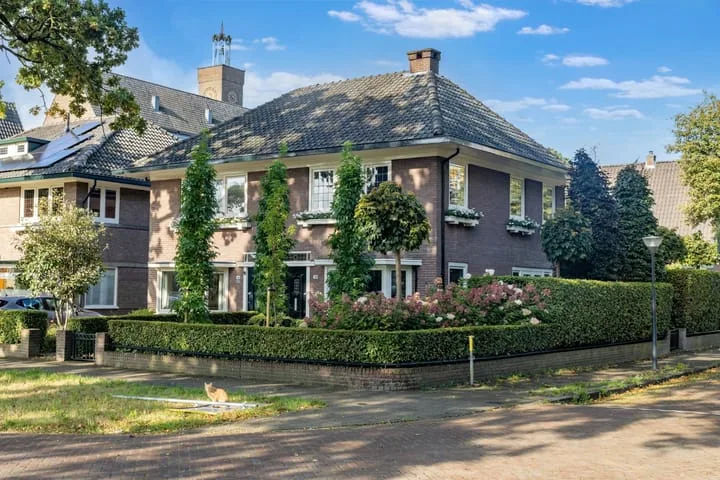
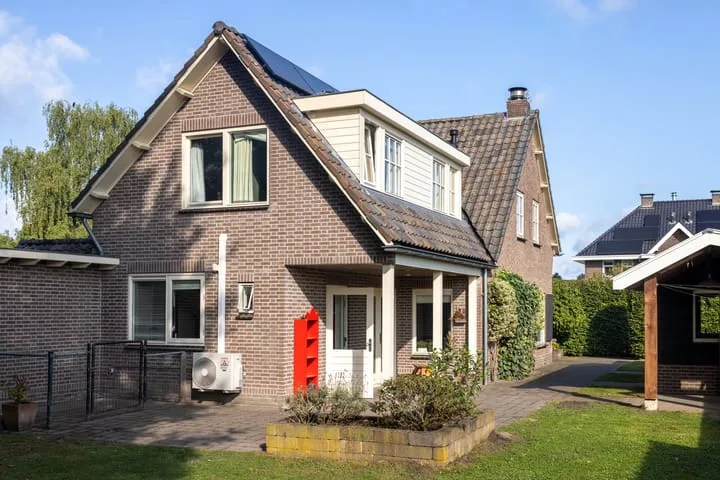
- Sold
Minstreelshoeve 104
7326TS Apeldoorn
€ 339.000 k.k.
€ 3.259/m²
- Living area
- 104 m²
- Land area
- 171 m²
- Bedrooms
- 4
View 1.535 sold houses in Apeldoorn
Type to search. Use arrow down and arrow up to navigate through results and press Enter to open.
Hidden search suggestions.
Compare sold homes in Apeldoorn or view the current offering in this location directly.
On this page you will find recently sold homes in Apeldoorn. Use this overview to better estimate selling prices, popular neighborhoods, and the local housing supply before you choose a real estate agent. Also view the current housing supply with 2.016 houses in Apeldoorn.
7326TS Apeldoorn
€ 339.000 k.k.
€ 3.259/m²
7323ES Apeldoorn
€ 389.500 k.k.
€ 3.141/m²
7333CH Apeldoorn
€ 365.000 k.k.
€ 3.802/m²
7321ZD Apeldoorn
€ 395.000 k.k.
€ 3.950/m²
7325PG Apeldoorn
€ 450.000 k.k.
€ 3.383/m²
7324CD Apeldoorn
€ 485.000 k.k.
€ 4.217/m²
7312NS Apeldoorn
€ 325.000 k.k.
€ 3.869/m²
7323VK Apeldoorn
€ 398.000 k.k.
€ 4.373/m²
7325NH Apeldoorn
€ 450.000 k.k.
€ 3.435/m²
7325ZW Apeldoorn
€ 350.000 k.k.
€ 4.794/m²
7333LZ Apeldoorn
€ 418.000 k.k.
€ 4.593/m²
7312VL Apeldoorn
€ 489.500 k.k.
€ 3.979/m²
7322TA Apeldoorn
€ 495.000 k.k.
€ 4.342/m²
7331SR Apeldoorn
€ 499.000 k.k.
€ 3.465/m²
7334DG Apeldoorn
€ 375.000 k.k.
€ 5.769/m²
7328DA Apeldoorn
€ 345.000 k.k.
€ 3.750/m²
7311GC Apeldoorn
€ 450.000 k.k.
€ 5.357/m²
7316BZ Apeldoorn
€ 945.000 k.k.
€ 4.315/m²
7333BS Apeldoorn
€ 349.500 k.k.
€ 4.314/m²
7331BN Apeldoorn
€ 595.000 k.k.
€ 5.312/m²
7328DX Apeldoorn
€ 399.000 k.k.
€ 3.217/m²
7321GN Apeldoorn
€ 399.500 k.k.
€ 3.768/m²
7315AC Apeldoorn
€ 1.085.000 k.k.
€ 4.079/m²
7313AL Apeldoorn
€ 1.250.000 k.k.
€ 5.506/m²
7325DR Apeldoorn
€ 349.000 k.k.
€ 3.201/m²
7312JD Apeldoorn
€ 205.000 k.k.
€ 4.555/m²
7323RB Apeldoorn
€ 750.000 k.k.
€ 5.725/m²
7326BM Apeldoorn
€ 399.000 k.k.
€ 2.891/m²
Bekijk recente verkopen en ontvang gratis offertes van lokale verkoopmakelaars in Apeldoorn.
Recent verkocht in Apeldoorn? Lees de verkoopgerichte gids huis verkopen in Apeldoorn, vergelijk verkoopmakelaars in Apeldoorn of bekijk de beste verkoopmakelaars in Apeldoorn voor referentie bij jouw keuze.
Makelaars maken scherpere voorstellen als ze weten dat je vergelijkt — vraag offertes aan voor verkoop of aankoop.
Short answers about housing prices, sold homes and comparing real estate agents in Apeldoorn.
The costs of a real estate agent in Apeldoorn vary per office, property type and sales approach. Therefore, compare multiple quotes and also look at the real estate agents in Apeldoorn to better compare rates, presentation and local experience.
On this page we currently show 1.535 sold houses in Apeldoorn from our selection. This helps you to better assess recent transactions and the local housing market.
Houses sold in Apeldoorn give insight into asking prices, house types and neighborhoods where recent transactions have taken place. Compare this also with the current housing stock in Apeldoorn to better understand the market.
Je kunt verkochte woningen gebruiken als eerste marktindicatie, maar een lokale makelaar kan beter rekening houden met afwerking, ligging, onderhoud en actuele vraag in Apeldoorn. Plan de volgende stap via de gids huis verkopen in Apeldoorn.
Vergelijk makelaars in Apeldoorn op lokale verkoopervaring, reviews, verwachte opbrengst, courtage en marketingaanpak. Bekijk verkoopmakelaars in Apeldoorn of de top 10 makelaars in Apeldoorn om snel sterke kantoren te ontdekken.
View current location data on residents, WOZ development, housing stock, energy consumption, business activity and safety in Apeldoorn. In 2026 were there 142.716 residents. The average WOZ value in 2025 is EUR 361.469.
These figures help to better assess and compare the housing stock in Apeldoorn with recent sold homes. Orient yourself then on suitable top real estate agents in Apeldoorn for sales advice in this region.
Residents
142.716
Last year: 2026
Average WOZ
EUR 361.469
Last year: 2025
Average income per person.
EUR 26.550
Source: AllNumbers
Crimes (current year)
6.579
Total registered
| Year | Residents |
|---|---|
| 2021 | 138.801 |
| 2022 | 139.682 |
| 2023 | 141.080 |
| 2024 | 142.110 |
| 2025 | 142.365 |
| 2026 | 142.716 |
| Year | Average WOZ |
|---|---|
| 2021 | EUR 258.046 |
| 2022 | EUR 285.374 |
| 2023 | EUR 352.470 |
| 2024 | EUR 357.223 |
| 2025 | EUR 361.469 |
Hoger
31.190
Praktisch
27.590
Middelbaar
44.160
Europa
9.425
Nederland
108.720
Buiten Europa
24.255
Label A
18.785
Label C
17.200
Label B
10.667
Label G
5.701
Label D
5.288
Label E
3.317
Label A+
2.668
Label F
2.519
Label A+++
1.285
Label A++
826
Label A++++
262
Label A+++++
21
| Year | Gas (m3) | Electricity (kWh) |
|---|---|---|
| 2020 | 1.147 | 2.725 |
| 2021 | 1.279 | 2.753 |
| 2022 | 1.009 | 2.583 |
| 2023 | 846 | 2.450 |
| 2024 | 823 | 2.509 |
Hoekwoning
Gas: 880 • Electricity: 2.544
Huurwoning
Gas: 715 • Electricity: 1.968
Koopwoning
Gas: 935 • Electricity: 2.791
Appartement
Gas: 600 • Electricity: 1.791
Tussenwoning
Gas: 778 • Electricity: 2.398
Vrijstaande woning
Gas: 1.239 • Electricity: 3.332
Twee-onder-één-kap woning
Gas: 1.051 • Electricity: 2.942
Total number of company establishments: 17.735
| Period | Crimes |
|---|---|
| jan 2026 | 514 |
| jul 2025 | 545 |
| jun 2025 | 536 |
| mei 2025 | 564 |
| mrt 2025 | 557 |
| mrt 2026 | 595 |
| nov 2024 | 503 |
| nov 2025 | 623 |
| okt 2024 | 556 |
| okt 2025 | 609 |
| sep 2024 | 597 |
| sep 2025 | 544 |
These figures give an indicative picture of safety trends in the living environment of Apeldoorn.
Short answers based on current local statistics, handy for a quick comparison of the living environment.
Apeldoorn telt in 2026 ongeveer 142.716 inwoners.
De gemiddelde WOZ-waarde in Apeldoorn is in 2025 circa € 361.469.
Het gemiddelde inkomen per inwoner in Apeldoorn ligt rond € 26.550 per jaar.
Voor het huidige jaar gaat het om ongeveer 6.579 geregistreerde misdrijven. Gebruik deze cijfers als indicatie en vergelijk trends per periode.
In Apeldoorn komt vooral "Appartementen" veel voor, met ongeveer 22.649 woningen.