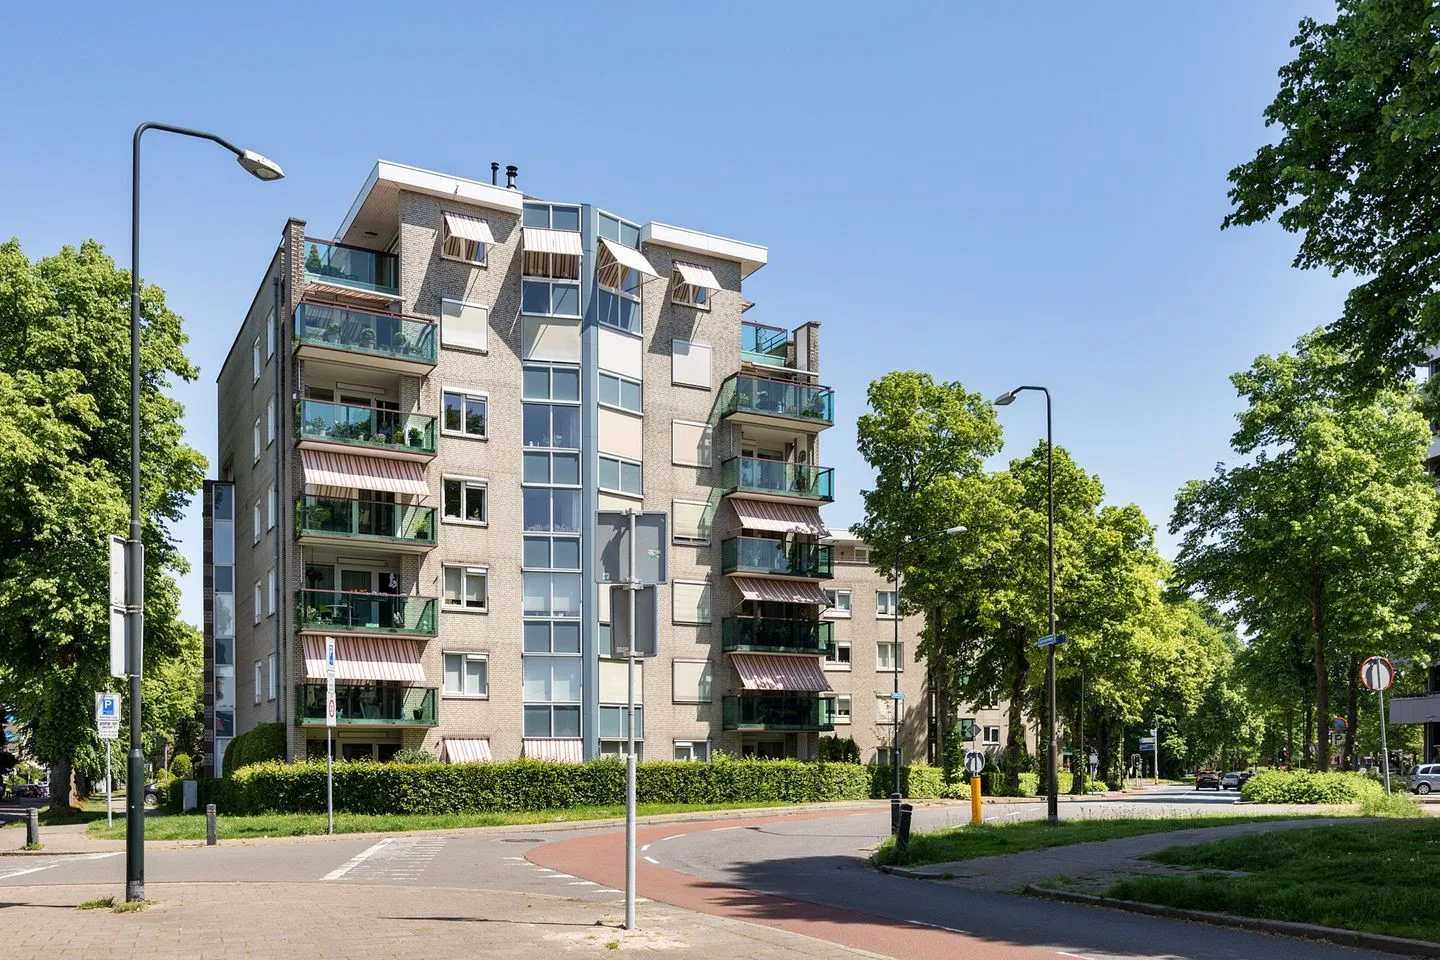
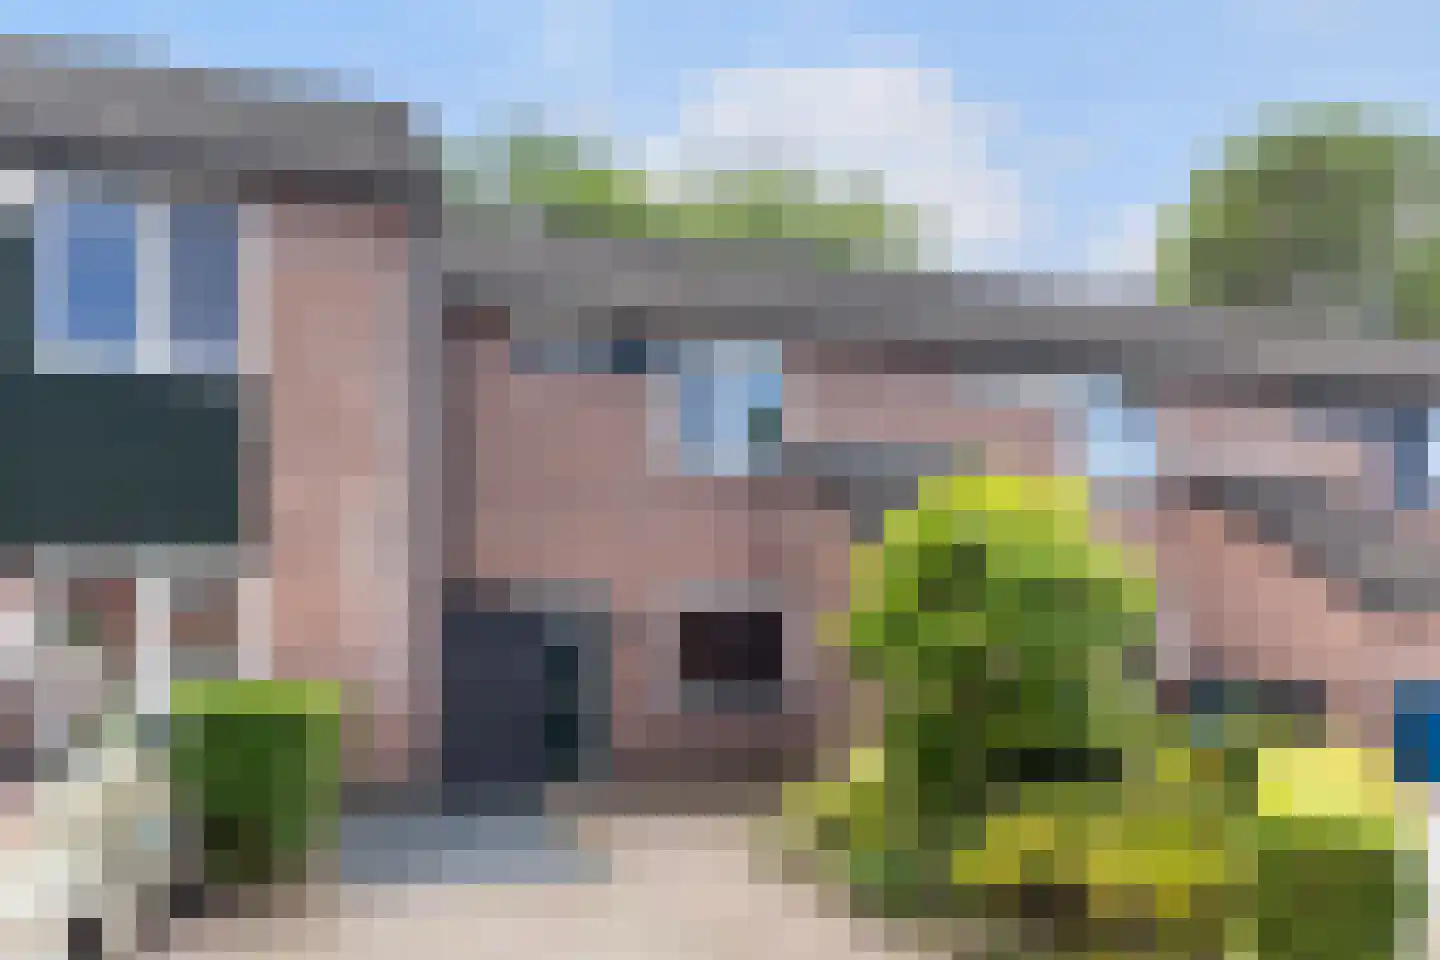
- Available
Fitislaan 43
7331VJ Apeldoorn
€ 400.000 k.k.
€ 5.000/m²
- Living area
- 80 m²
- Land area
- 146 m²
- Bedrooms
- 3
Searching in 2.012 houses in Apeldoorn
Type to search. Use arrow down and arrow up to navigate through results and press Enter to open.
Hidden search suggestions.
View current properties in Apeldoorn or search targeted on street, postal code and property characteristics.
View the current housing stock in Apeldoorn and quickly filter by price, living area, rooms and more. There are currently 2.012 houses in this place within our selection. View also 1.500 sold houses in Apeldoorn for extra insight into the local housing market.
7331VJ Apeldoorn
€ 400.000 k.k.
€ 5.000/m²
7316AD Apeldoorn
€ 1.285.000 k.k.
€ 4.255/m²
7329AH Apeldoorn
€ 749.500 k.k.
€ 4.744/m²
7311AK Apeldoorn
€ 635.000 k.k.
€ 4.504/m²
7315HW Apeldoorn
€ 749.500 k.k.
€ 5.278/m²
7315ER Apeldoorn
€ 525.000 k.k.
€ 6.250/m²
7312JA Apeldoorn
€ 539.000 k.k.
€ 5.337/m²
7321GR Apeldoorn
€ 475.000 k.k.
€ 3.105/m²
7322DG Apeldoorn
€ 425.000 k.k.
€ 3.244/m²
7331DH Apeldoorn
€ 385.000 k.k.
€ 3.702/m²
7312TC Apeldoorn
€ 1.050.000 k.k.
€ 5.224/m²
7313CW Apeldoorn
€ 845.000 k.k.
€ 5.216/m²
7314NC Apeldoorn
€ 829.000 k.k.
€ 5.454/m²
7316JR Apeldoorn
€ 415.000 k.k.
€ 4.826/m²
7333HK Apeldoorn
€ 265.000 k.k.
€ 3.487/m²
7312CS Apeldoorn
€ 798.500 k.k.
€ 5.545/m²
7314PK Apeldoorn
€ 669.000 k.k.
€ 6.027/m²
7322TM Apeldoorn
€ 669.000 k.k.
€ 5.484/m²
7335JL Apeldoorn
€ 529.000 k.k.
€ 6.298/m²
7326SE Apeldoorn
€ 445.000 k.k.
€ 3.836/m²
7316AB Apeldoorn
€ 895.000 k.k.
€ 3.761/m²
7323SB Apeldoorn
€ 745.000 k.k.
€ 4.656/m²
7313EV Apeldoorn
€ 1.498.000 k.k.
€ 5.166/m²
7312GP Apeldoorn
€ 595.000 k.k.
€ 4.020/m²
7331MV Apeldoorn
€ 529.500 k.k.
€ 4.236/m²
7328NV Apeldoorn
€ 375.000 k.k.
€ 4.464/m²
7312SN Apeldoorn
€ 699.500 k.k.
€ 5.181/m²
7326PD Apeldoorn
€ 450.000 k.k.
€ 3.191/m²
Get free quotes from real estate agents with local market knowledge. Compare more than 52 real estate agents in Apeldoorn.
Selling a home in Apeldoorn? View the sales-oriented guide sell a house in Apeldoorn, compare all real estate agents in Apeldoorn or view the top 10 real estate agents in Apeldoorn for extra context to your choice.
Real estate agents make sharper offers when they know you're comparing — ask for quotes for sale or purchase.
Practical answers about housing supply, sales and comparing real estate agents in Apeldoorn.
The costs of a real estate agent in Apeldoorn depend on commission, setup costs, property presentation and the chosen service. Compare the 52 real estate agents in Apeldoorn via the real estate agent page and request multiple quotes to compare rates and approach well.
Within our selection, we are currently showing 2.012 houses in Apeldoorn. View also the sold houses in Apeldoorn to compare the current offering with recent transactions.
Take into account not only price and living area but also maintenance, energy label, location, outdoor space and sales status. This way you compare houses in Apeldoorn on more than just the asking price.
A local real estate agent knows the neighborhoods, recent transactions and demand in Apeldoorn. By comparing 52 real estate agents in the region you get a better insight into prices, sales strategy and expected yield; the top 10 in Apeldoorn provides a useful starting point.
Yes, when making a sales plan, a valuation in Apeldoorn is wise. You gain insight into a realistic asking price and can then compare offers from real estate agents specifically.
View current location data on residents, WOZ development, housing stock, energy consumption, business activity and safety in Apeldoorn. In 2026 were there 142.716 residents. The average WOZ value in 2025 is EUR 361.469.
These figures help to better assess and compare the housing stock in Apeldoorn with recent sold homes. Orient yourself then on suitable top real estate agents in Apeldoorn for sales advice in this region.
Residents
142.716
Last year: 2026
Average WOZ
EUR 361.469
Last year: 2025
Average income per person.
EUR 26.550
Source: AllNumbers
Crimes (current year)
6.579
Total registered
| Year | Residents |
|---|---|
| 2021 | 138.801 |
| 2022 | 139.682 |
| 2023 | 141.080 |
| 2024 | 142.110 |
| 2025 | 142.365 |
| 2026 | 142.716 |
| Year | Average WOZ |
|---|---|
| 2021 | EUR 258.046 |
| 2022 | EUR 285.374 |
| 2023 | EUR 352.470 |
| 2024 | EUR 357.223 |
| 2025 | EUR 361.469 |
Hoger
31.190
Praktisch
27.590
Middelbaar
44.160
Europa
9.425
Nederland
108.720
Buiten Europa
24.255
Label A
18.785
Label C
17.200
Label B
10.667
Label G
5.701
Label D
5.288
Label E
3.317
Label A+
2.668
Label F
2.519
Label A+++
1.285
Label A++
826
Label A++++
262
Label A+++++
21
| Year | Gas (m3) | Electricity (kWh) |
|---|---|---|
| 2020 | 1.147 | 2.725 |
| 2021 | 1.279 | 2.753 |
| 2022 | 1.009 | 2.583 |
| 2023 | 846 | 2.450 |
| 2024 | 823 | 2.509 |
Hoekwoning
Gas: 880 • Electricity: 2.544
Huurwoning
Gas: 715 • Electricity: 1.968
Koopwoning
Gas: 935 • Electricity: 2.791
Appartement
Gas: 600 • Electricity: 1.791
Tussenwoning
Gas: 778 • Electricity: 2.398
Vrijstaande woning
Gas: 1.239 • Electricity: 3.332
Twee-onder-één-kap woning
Gas: 1.051 • Electricity: 2.942
Total number of company establishments: 17.735
| Period | Crimes |
|---|---|
| jan 2026 | 514 |
| jul 2025 | 545 |
| jun 2025 | 536 |
| mei 2025 | 564 |
| mrt 2025 | 557 |
| mrt 2026 | 595 |
| nov 2024 | 503 |
| nov 2025 | 623 |
| okt 2024 | 556 |
| okt 2025 | 609 |
| sep 2024 | 597 |
| sep 2025 | 544 |
These figures give an indicative picture of safety trends in the living environment of Apeldoorn.
Short answers based on current local statistics, handy for a quick comparison of the living environment.
Apeldoorn telt in 2026 ongeveer 142.716 inwoners.
De gemiddelde WOZ-waarde in Apeldoorn is in 2025 circa € 361.469.
Het gemiddelde inkomen per inwoner in Apeldoorn ligt rond € 26.550 per jaar.
Voor het huidige jaar gaat het om ongeveer 6.579 geregistreerde misdrijven. Gebruik deze cijfers als indicatie en vergelijk trends per periode.
In Apeldoorn komt vooral "Appartementen" veel voor, met ongeveer 22.649 woningen.