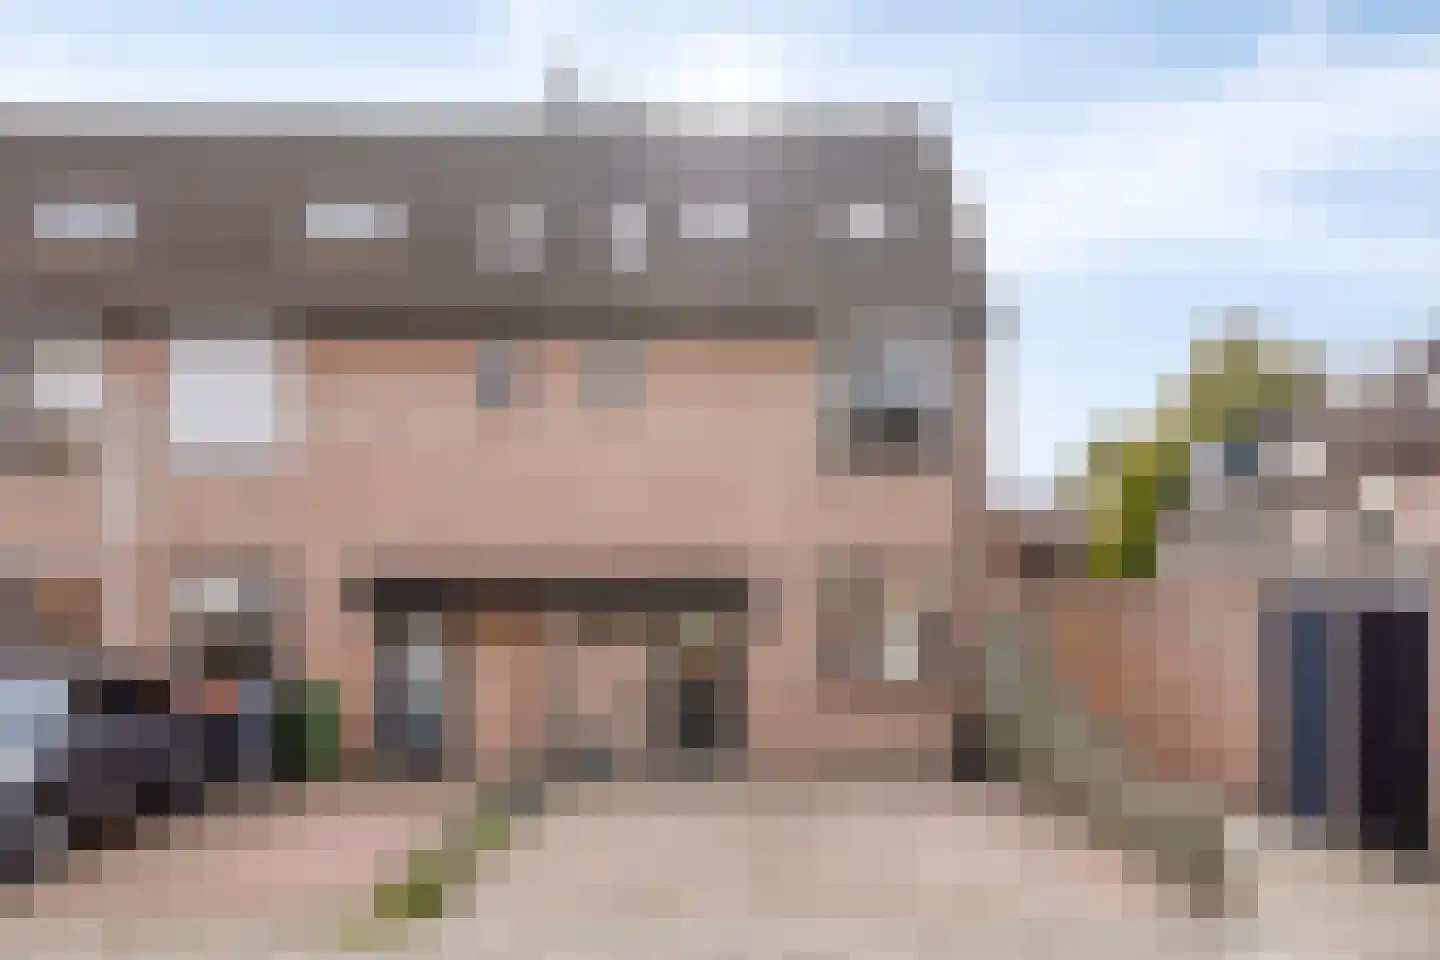
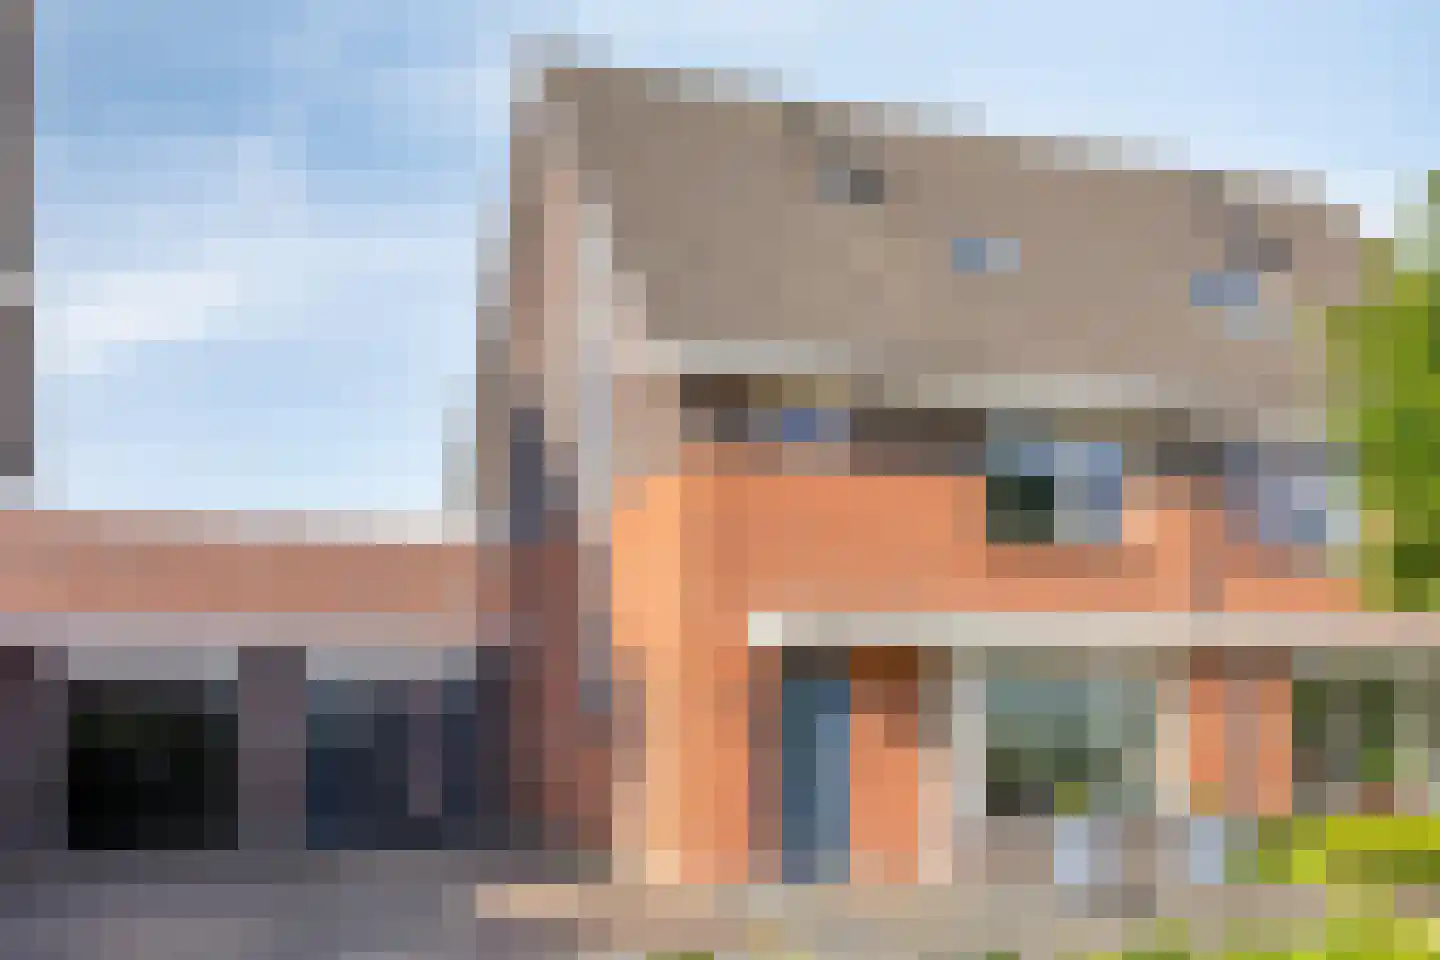
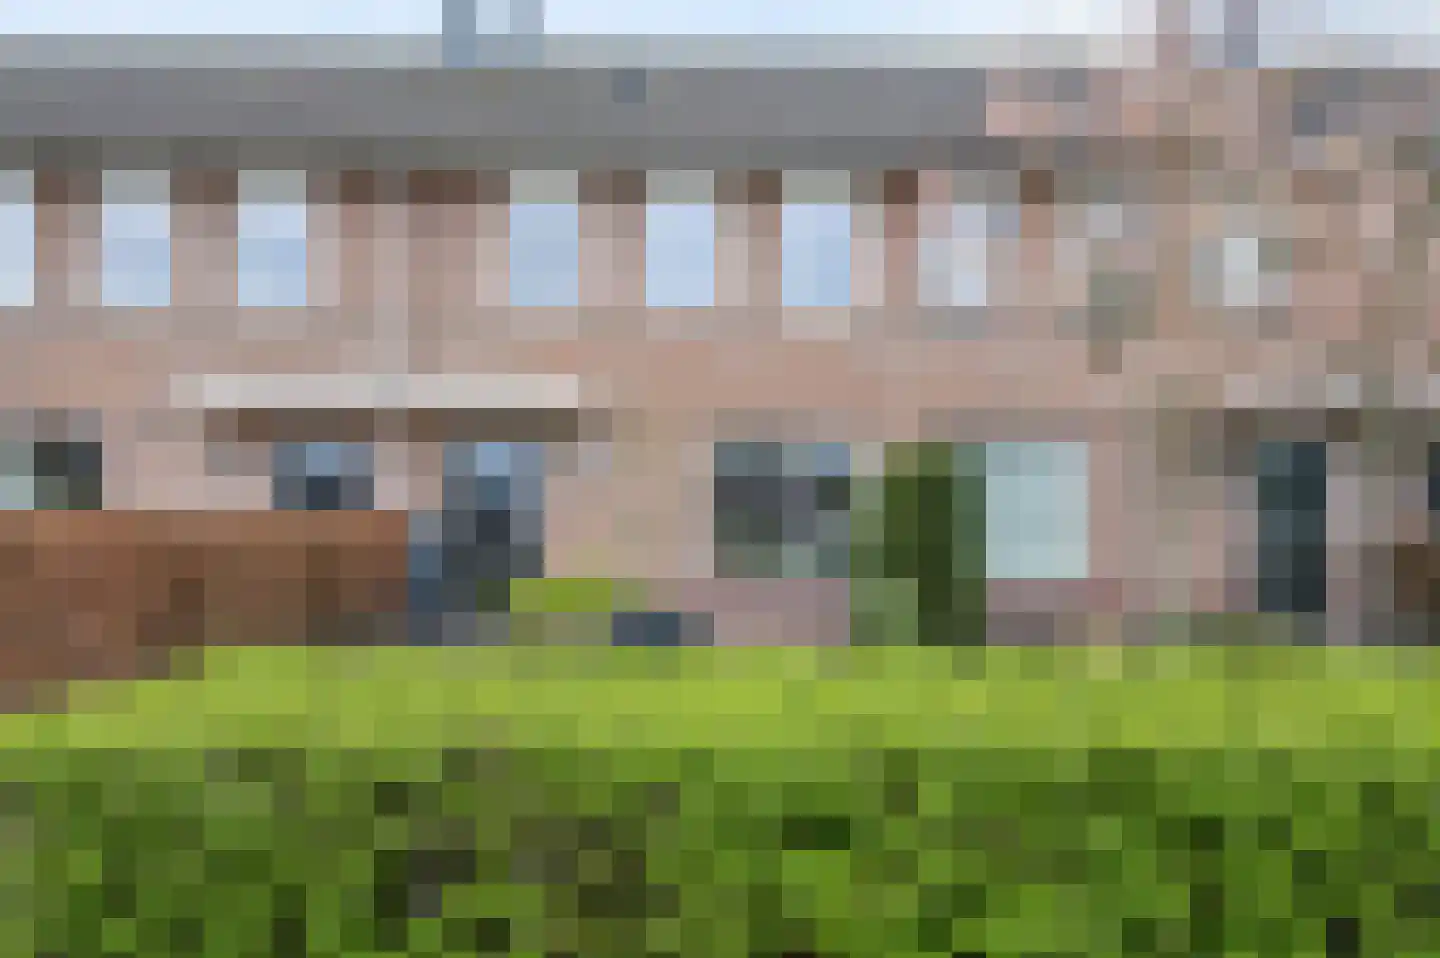
- Available
Orlofflaan 33
3772WM Barneveld
€ 679.000 k.k.
€ 4.782/m²
- Living area
- 142 m²
- Land area
- 237 m²
- Bedrooms
- 5
Searching in 456 houses in Barneveld
Type to search. Use arrow down and arrow up to navigate through results and press Enter to open.
Hidden search suggestions.
View current properties in Barneveld or search targeted on street, postal code and property characteristics.
View the current housing stock in Barneveld and quickly filter by price, living area, rooms and more. There are currently 456 houses in this place within our selection. View also 358 sold houses in Barneveld for extra insight into the local housing market.
3772WM Barneveld
€ 679.000 k.k.
€ 4.782/m²
3772NM Barneveld
€ 479.000 k.k.
€ 4.059/m²
3772RE Barneveld
€ 498.500 k.k.
€ 4.573/m²
3773CH Barneveld
€ 489.000 k.k.
€ 3.677/m²
3772NR Barneveld
€ 498.000 k.k.
€ 4.293/m²
3771JD Barneveld
€ 665.000 k.k.
€ 4.716/m²
3771HW Barneveld
€ 535.000 k.k.
€ 5.047/m²
3771CL Barneveld
€ 1.095.000 k.k.
€ 3.626/m²
3772NN Barneveld
€ 724.500 k.k.
€ 4.500/m²
3771WR Barneveld
€ 675.000 k.k.
€ 4.821/m²
3773BX Barneveld
€ 290.000 k.k.
€ 5.370/m²
3771ZZ Barneveld
€ 409.000 k.k.
€ 4.090/m²
3771KR Barneveld
€ 589.500 k.k.
€ 4.754/m²
3771EB Barneveld
€ 1.282.500 k.k.
€ 4.219/m²
3772KE Barneveld
€ 895.000 k.k.
€ 5.774/m²
3771CT Barneveld
€ 649.500 k.k.
€ 4.190/m²
3772VD Barneveld
€ 450.000 k.k.
€ 4.206/m²
3771DC Barneveld
€ 685.000 k.k.
€ 5.037/m²
3772VE Barneveld
€ 469.500 k.k.
€ 4.429/m²
3771EM Barneveld
€ 579.000 k.k.
€ 4.488/m²
3772SV Barneveld
€ 369.000 k.k.
€ 5.766/m²
3771ZN Barneveld
€ 2.295 p/m
€ 18/m²
3772AG Barneveld
€ 590.000 k.k.
€ 3.986/m²
3772KL Barneveld
€ 445.000 k.k.
€ 3.708/m²
3772DB Barneveld
€ 498.000 k.k.
€ 4.743/m²
3772PX Barneveld
€ 525.000 k.k.
€ 4.134/m²
3771XV Barneveld
€ 1.250.000 k.k.
€ 4.310/m²
3773ZE Barneveld
€ 595.000 k.k.
Get free quotes from real estate agents with local market knowledge. Compare more than 34 real estate agents in Barneveld.
Selling a home in Barneveld? View the sales-oriented guide sell a house in Barneveld, compare all real estate agents in Barneveld or view the top 10 real estate agents in Barneveld for extra context to your choice.
Real estate agents make sharper offers when they know you're comparing — ask for quotes for sale or purchase.
Practical answers about housing supply, sales and comparing real estate agents in Barneveld.
The costs of a real estate agent in Barneveld depend on commission, setup costs, property presentation and the chosen service. Compare the 34 real estate agents in Barneveld via the real estate agent page and request multiple quotes to compare rates and approach well.
Within our selection, we are currently showing 456 houses in Barneveld. View also the sold houses in Barneveld to compare the current offering with recent transactions.
Take into account not only price and living area but also maintenance, energy label, location, outdoor space and sales status. This way you compare houses in Barneveld on more than just the asking price.
A local real estate agent knows the neighborhoods, recent transactions and demand in Barneveld. By comparing 34 real estate agents in the region you get a better insight into prices, sales strategy and expected yield; the top 10 in Barneveld provides a useful starting point.
Yes, when making a sales plan, a valuation in Barneveld is wise. You gain insight into a realistic asking price and can then compare offers from real estate agents specifically.
View current location data on residents, WOZ development, housing stock, energy consumption, business activity and safety in Barneveld. In 2025 were there 36.575 residents. The average WOZ value in 2025 is EUR 440.000.
These figures help to better assess and compare the housing stock in Barneveld with recent sold homes. Orient yourself then on suitable top real estate agents in Barneveld for sales advice in this region.
Residents
36.575
Last year: 2025
Average WOZ
EUR 440.000
Last year: 2025
Average income per person.
EUR 30.500
Source: AllNumbers
Crimes (current year)
955
Total registered
| Year | Residents |
|---|---|
| 2021 | 35.100 |
| 2022 | 35.345 |
| 2023 | 35.835 |
| 2024 | 36.235 |
| 2025 | 36.575 |
| Year | Average WOZ |
|---|---|
| 2021 | EUR 309.000 |
| 2022 | EUR 345.000 |
| 2023 | EUR 398.000 |
| 2024 | EUR 414.000 |
| 2025 | EUR 440.000 |
Hoger
6.310
Praktisch
7.770
Middelbaar
11.230
Europa
1.190
Nederland
31.305
Buiten Europa
4.075
Label A
5.601
Label C
3.862
Label B
2.532
Label A+
664
Label D
628
Label A+++
570
Label G
566
Label F
378
Label E
228
Label A++
199
Label A++++
62
Label A+++++
19
| Year | Gas (m3) | Electricity (kWh) |
|---|---|---|
| 2020 | 1.150 | 2.910 |
| 2021 | 1.290 | 2.960 |
| 2022 | 1.040 | 2.780 |
| 2023 | 880 | 2.640 |
| 2024 | 850 | 2.730 |
Hoekwoning
Gas: 940 • Electricity: 2.870
Huurwoning
Gas: 730 • Electricity: 1.970
Koopwoning
Gas: 960 • Electricity: 3.010
Appartement
Gas: 590 • Electricity: 1.690
Tussenwoning
Gas: 800 • Electricity: 2.540
Vrijstaande woning
Gas: 1.470 • Electricity: 4.170
Twee-onder-één-kap woning
Gas: 1.130 • Electricity: 3.370
Total number of company establishments: 5.415
| Period | Crimes |
|---|---|
| jan 2025 | 91 |
| jan 2026 | 69 |
| jul 2025 | 76 |
| jun 2025 | 98 |
| mei 2025 | 67 |
| mrt 2025 | 85 |
| nov 2024 | 98 |
| nov 2025 | 69 |
| okt 2024 | 102 |
| okt 2025 | 96 |
| sep 2024 | 81 |
| sep 2025 | 65 |
These figures give an indicative picture of safety trends in the living environment of Barneveld.
Short answers based on current local statistics, handy for a quick comparison of the living environment.
Barneveld telt in 2025 ongeveer 36.575 inwoners.
De gemiddelde WOZ-waarde in Barneveld is in 2025 circa € 440.000.
Het gemiddelde inkomen per inwoner in Barneveld ligt rond € 30.500 per jaar.
Voor het huidige jaar gaat het om ongeveer 955 geregistreerde misdrijven. Gebruik deze cijfers als indicatie en vergelijk trends per periode.
In Barneveld komt vooral "Tussenwoningen" veel voor, met ongeveer 5.422 woningen.