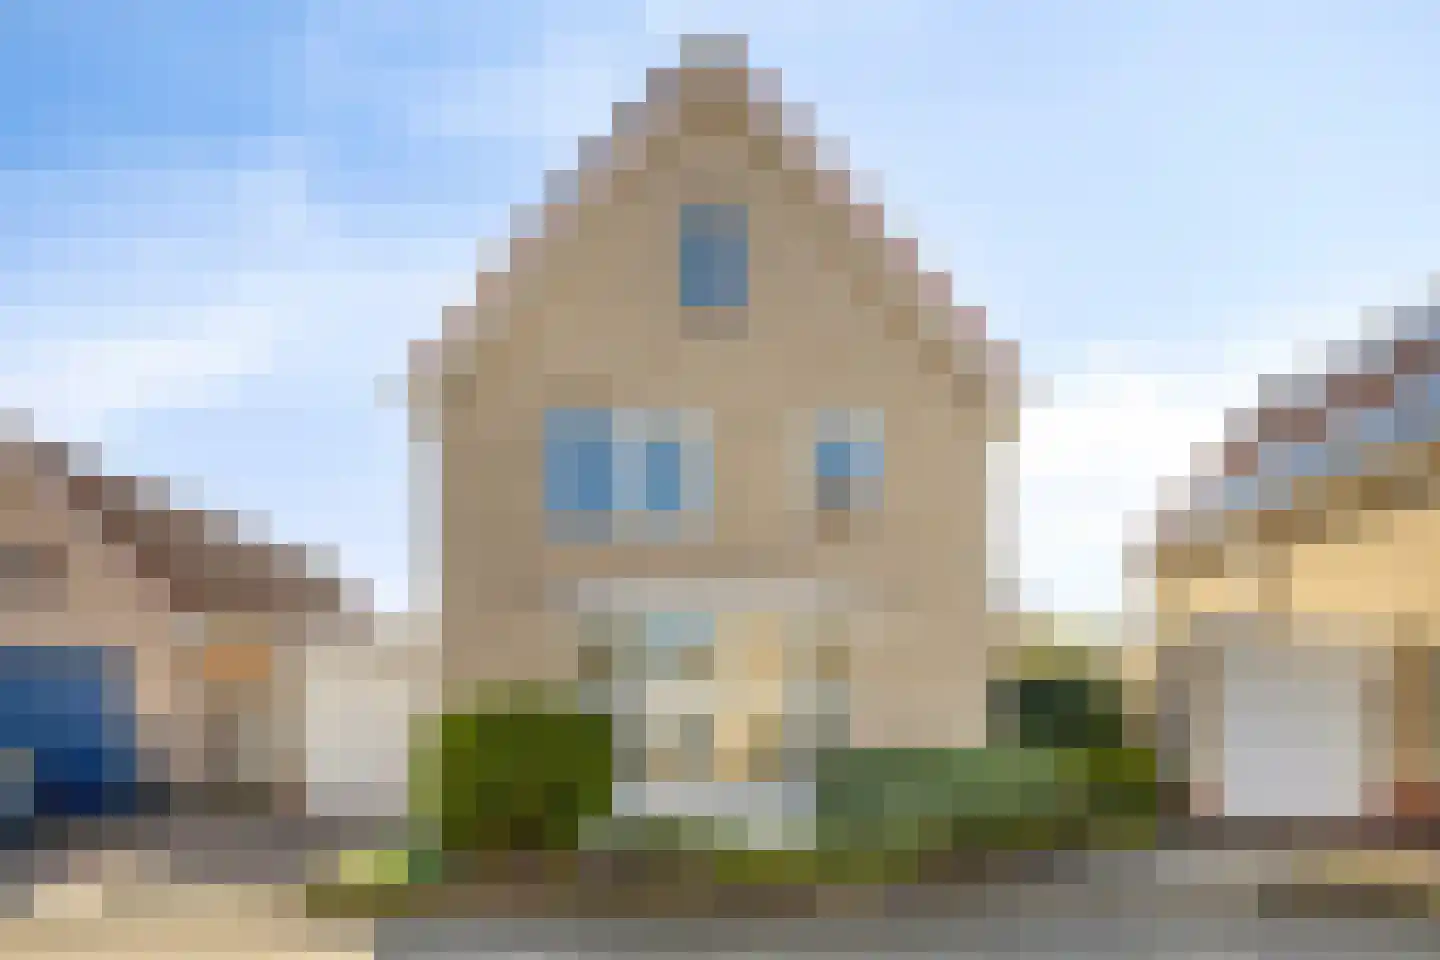
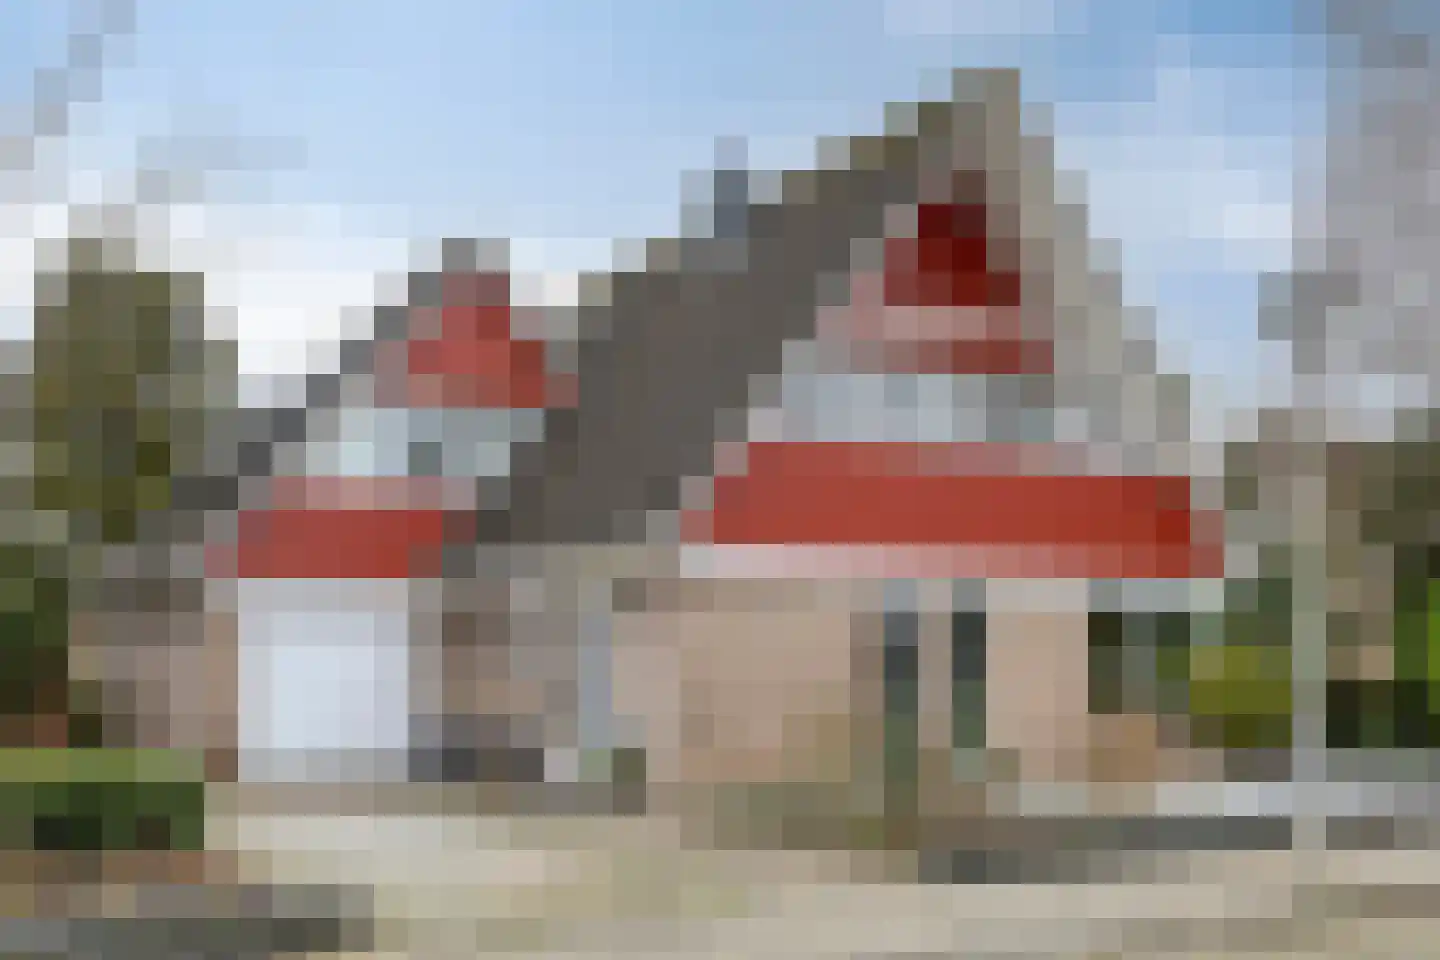
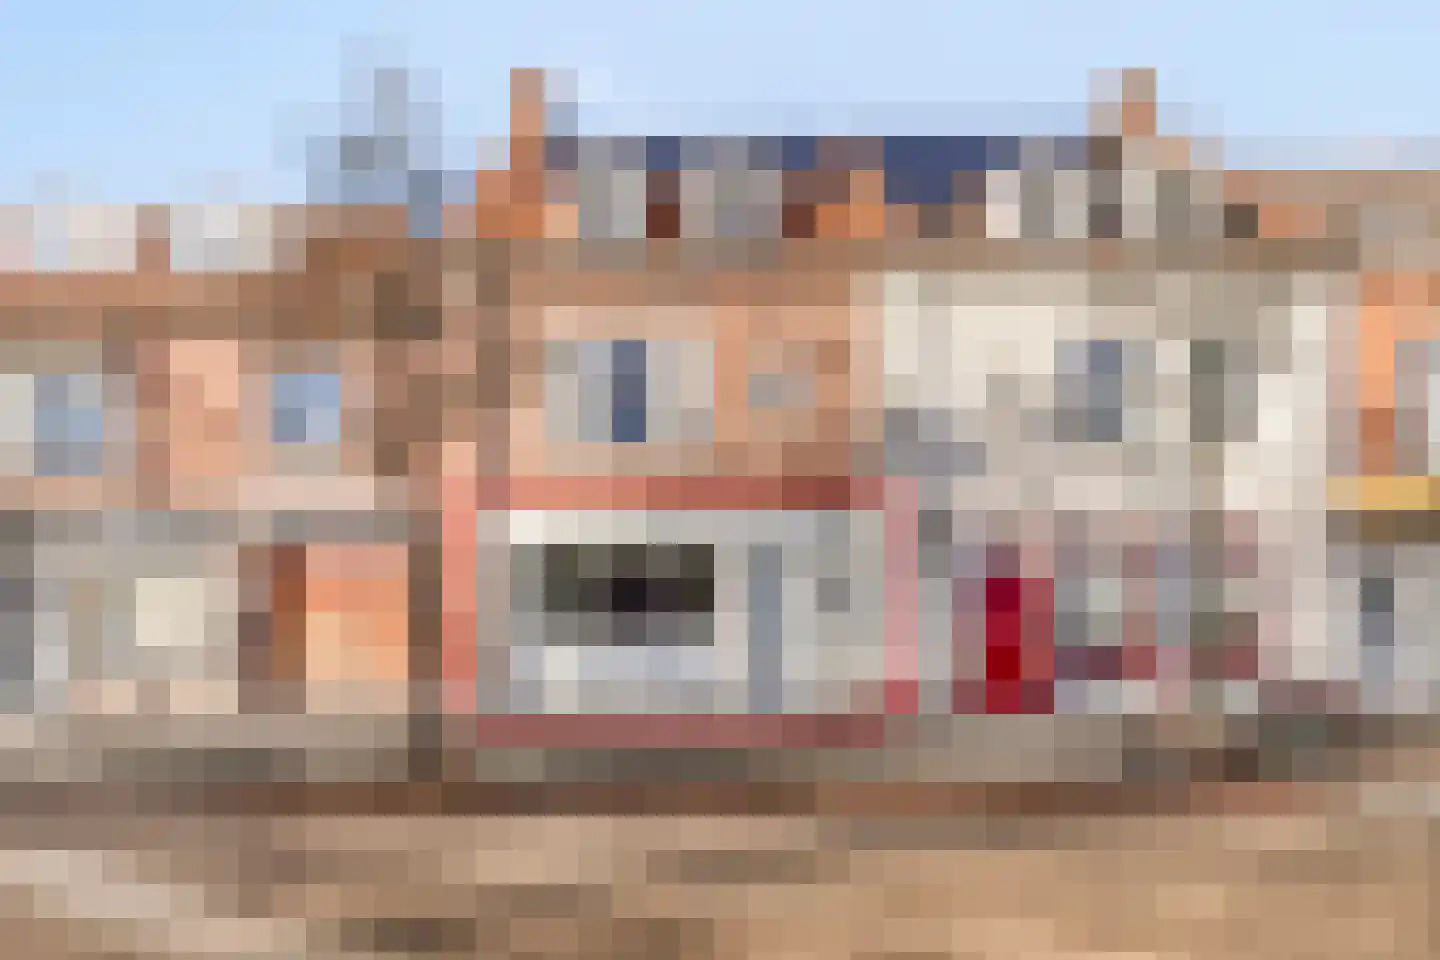
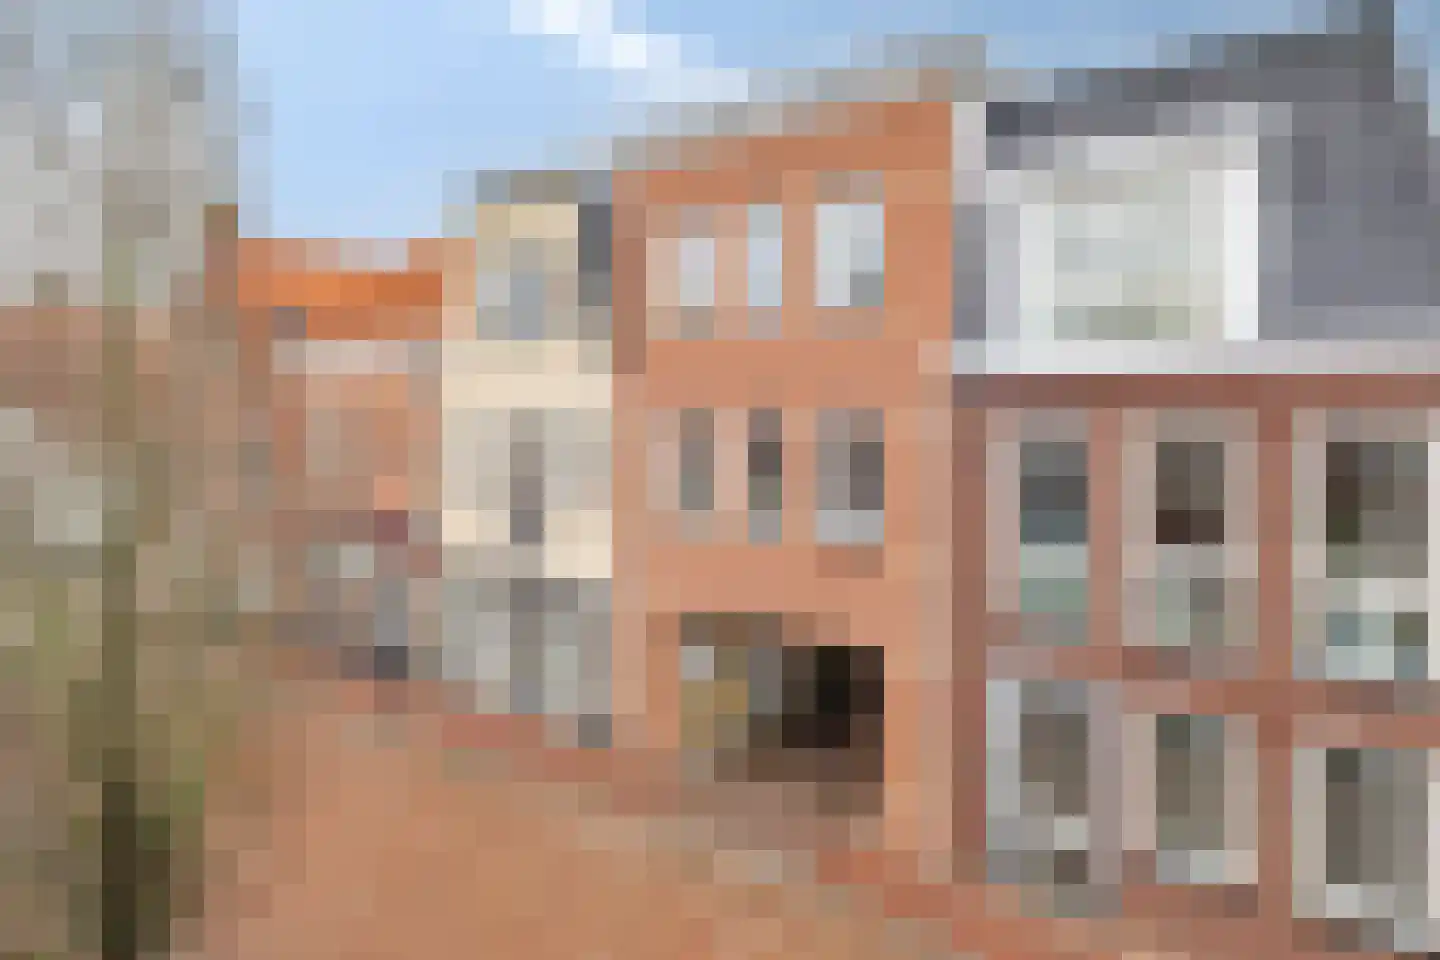
Houses sold in Dinteloord

View 60 sold houses in Dinteloord

Connected to: Vastgoed Nederland NVM Makelaars

On this page you will find recently sold homes in Dinteloord. Use this overview to better estimate selling prices, popular neighborhoods, and the local housing supply before you choose a real estate agent. Also view the current housing supply with 80 houses in Dinteloord.

Selection

Search and filter homes

Set your preferences and discover homes that suit you.

Total supply 242.463
Filters

Set price, area and other characteristics. Adjust a filter or click on Show homes. Location changes directly above.

Reset filters

You search for

  • Place Dinteloord
  • Status Sold

Huis verkopen in Dinteloord? Vergelijk verkoopmakelaars

Bekijk recente verkopen en ontvang gratis offertes van lokale makelaars. Vergelijk meer dan 15 makelaars in Dinteloord.

Free request a quote

  • Quotes in Dinteloord
  • Non-binding
  • Personal
  • Gratis tarieven vergelijken

Recent verkocht in Dinteloord? Lees de verkoopgerichte gids huis verkopen in Dinteloord, vergelijk verkoopmakelaars in Dinteloord of bekijk de beste verkoopmakelaars in Dinteloord voor referentie bij jouw keuze.

Vergelijk meerdere offertes

Makelaars maken scherpere voorstellen als ze weten dat je vergelijkt — vraag offertes aan voor verkoop of aankoop.

Frequently asked questions about sold homes in Dinteloord

Short answers about housing prices, sold homes and comparing real estate agents in Dinteloord.

Residential and neighborhood statistics in Dinteloord

View current location data on residents, WOZ development, housing stock, energy consumption, business activity and safety in Dinteloord. In 2025 were there 5.800 residents. The average WOZ value in 2025 is EUR 337.000.

These figures help to better assess and compare the housing stock in Dinteloord with recent sold homes. Orient yourself then on suitable top real estate agents in Dinteloord for sales advice in this region.

Residents

5.800

Last year: 2025

Average WOZ

EUR 337.000

Last year: 2025

Average income per person.

EUR 32.800

Source: AllNumbers

Crimes (current year)

190

Total registered

Demographics and WOZ development

Inhabitants per year

Inhabitants per year in Dinteloord
Year Residents
2021 5.735
2022 5.850
2023 5.905
2024 5.855
2025 5.800

Annual WOZ value

WOZ value per year in Dinteloord
Year Average WOZ
2021 EUR 238.000
2022 EUR 269.000
2023 EUR 306.000
2024 EUR 320.000
2025 EUR 337.000

Composition of residents

Age build-up

65+: 1.330 0-15: 860 15-25: 630 25-45: 1.290 45-65: 1.690

Education level

Hoger

790

Praktisch

1.380

Middelbaar

2.200

Origin of residents (2025)

Europa

490

Nederland

4.765

Buiten Europa

545

Housing stock and construction periods

Types of homes

Hoekwoningen 441
Appartementen 329
Tussenwoningen 775
Vrijstaande woningen 570
Twee-onder-één-kap woningen 497

Construction period of buildings

Voor 1700 3
1700 tot 1900 43
1900 tot 1925 196
1925 tot 1950 259
1950 tot 1970 566
1970 tot 1980 842
1980 tot 1990 236
1990 tot 2000 294
2000 tot 2010 145
2010 tot 2020 134
2020 en later 41

Energy and sustainability

Energy label distribution

Label C

635

Label A

623

Label B

497

Label G

270

Label D

227

Label F

171

Label E

128

Label A+

26

Label A+++

17

Label A++++

9

Label A++

8

Label A+++++

0

Average energy consumption per year

Average energy consumption per year in Dinteloord
Year Gas (m3) Electricity (kWh)
2020 1.280 3.130
2021 1.440 3.180
2022 1.090 2.970
2023 920 2.840
2024 900 2.930

Consumption per house type

Hoekwoning

Gas: 900 • Electricity: 2.530

Huurwoning

Gas: 780 • Electricity: 2.160

Koopwoning

Gas: 1.000 • Electricity: 3.240

Appartement

Gas: 630 • Electricity: 2.040

Tussenwoning

Gas: 800 • Electricity: 2.480

Vrijstaande woning

Gas: 1.210 • Electricity: 3.910

Twee-onder-één-kap woning

Gas: 970 • Electricity: 2.990

Business activity in Dinteloord (2025)

Handel en HORECA 105
Nijverheid en energie 150
Zakelijke dienstverlening 150
Overheid, onderwijs en zorg 70
Landbouw, bosbouw en visserij 70
Vervoer, informatie en communicatie 45
Financiele diensten en onroerendgoed 35
Cultuur, recreatie en overige diensten 60

Total number of company establishments: 680

Recent crime statistics

Recent crime statistics in Dinteloord
Period Crimes
jan 2026 14
jul 2025 19
jun 2025 17
mei 2025 23
mrt 2025 19
mrt 2026 9
nov 2024 12
nov 2025 8
okt 2024 15
okt 2025 17
sep 2024 13
sep 2025 13

These figures give an indicative picture of safety trends in the living environment of Dinteloord.

Frequently asked questions about living in Dinteloord

Short answers based on current local statistics, handy for a quick comparison of the living environment.

Hoeveel inwoners heeft Dinteloord?

Dinteloord telt in 2025 ongeveer 5.800 inwoners.

Wat is de gemiddelde WOZ-waarde in Dinteloord?

De gemiddelde WOZ-waarde in Dinteloord is in 2025 circa € 337.000.

Wat is het gemiddelde inkomen per inwoner in Dinteloord?

Het gemiddelde inkomen per inwoner in Dinteloord ligt rond € 32.800 per jaar.

Hoe veilig is wonen in Dinteloord?

Voor het huidige jaar gaat het om ongeveer 190 geregistreerde misdrijven. Gebruik deze cijfers als indicatie en vergelijk trends per periode.

Welke woningtypen komen het meest voor in Dinteloord?

In Dinteloord komt vooral "Tussenwoningen" veel voor, met ongeveer 775 woningen.

Gratis vrijblijvende offertes ontvangen

Vergelijk meerdere makelaars en kies de beste match.