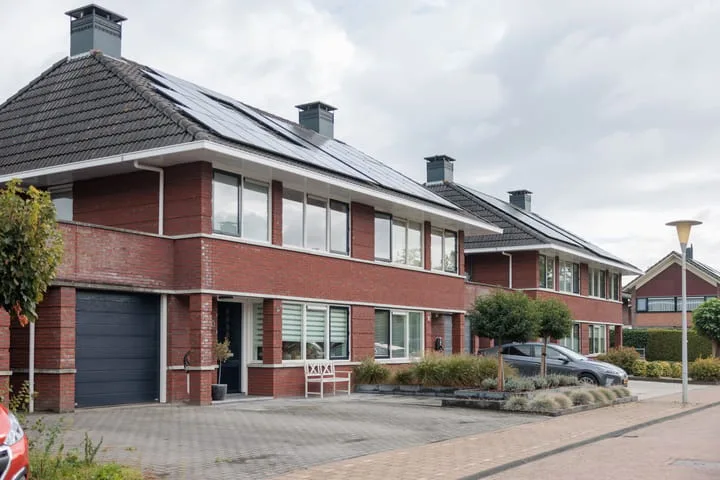
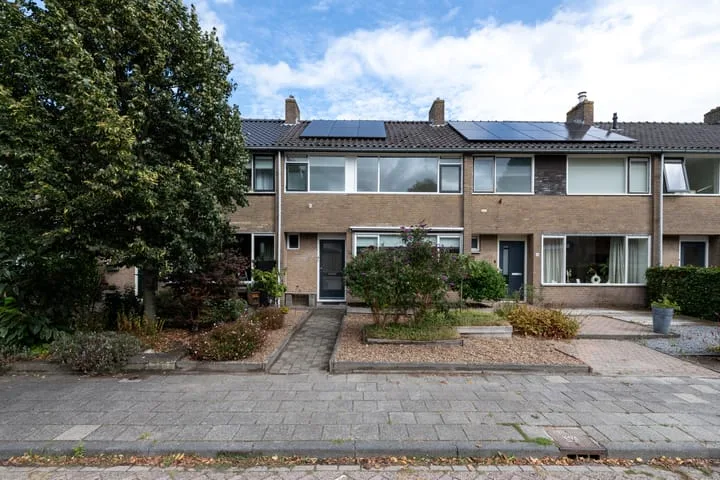
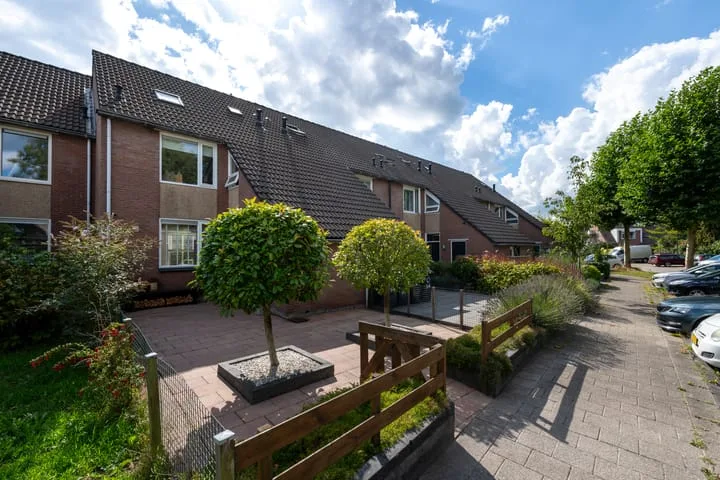
- Sold
Voergang 69
9205AW Drachten
€ 275.000 k.k.
€ 2.182/m²
- Living area
- 126 m²
- Land area
- 225 m²
- Bedrooms
- 3
View 467 sold houses in Drachten
Type to search. Use arrow down and arrow up to navigate through results and press Enter to open.
Hidden search suggestions.
Compare sold homes in Drachten or view the current offering in this location directly.
On this page you will find recently sold homes in Drachten. Use this overview to better estimate selling prices, popular neighborhoods, and the local housing supply before you choose a real estate agent. Also view the current housing supply with 626 houses in Drachten.
9205AW Drachten
€ 275.000 k.k.
€ 2.182/m²
9207CH Drachten
€ 325.000 k.k.
€ 2.754/m²
9205EH Drachten
€ 495.000 k.k.
€ 3.344/m²
9203XP Drachten
€ 275.000 k.k.
€ 2.722/m²
9203TK Drachten
€ 475.000 k.k.
€ 6.089/m²
9205BN Drachten
€ 289.000 k.k.
€ 2.156/m²
9204AM Drachten
€ 309.000 k.k.
€ 2.414/m²
9207BL Drachten
€ 425.000 k.k.
€ 2.931/m²
9204KW Drachten
€ 725.000 k.k.
€ 3.756/m²
9202BR Drachten
€ 230.000 k.k.
€ 2.527/m²
9205BL Drachten
€ 189.000 k.k.
€ 3.258/m²
9207GB Drachten
€ 749.000 k.k.
€ 3.921/m²
9202TN Drachten
€ 289.000 k.k.
€ 2.557/m²
9204LN Drachten
€ 825.000 k.k.
€ 4.365/m²
9207BB Drachten
€ 260.000 k.k.
€ 2.826/m²
9203SR Drachten
€ 414.000 k.k.
€ 2.620/m²
9202GD Drachten
€ 262.500 k.k.
€ 2.243/m²
9203EC Drachten
€ 274.000 k.k.
€ 2.884/m²
9205CA Drachten
€ 275.000 k.k.
€ 2.182/m²
9202ES Drachten
€ 215.000 k.k.
€ 2.905/m²
9207BS Drachten
€ 325.000 k.k.
€ 2.850/m²
9204LS Drachten
€ 425.000 k.k.
€ 3.269/m²
9201AD Drachten
€ 285.000 k.k.
€ 3.031/m²
9207CB Drachten
€ 298.500 k.k.
€ 2.261/m²
9202EG Drachten
€ 250.000 k.k.
€ 2.293/m²
9201GA Drachten
Price upon request
9207BA Drachten
Price upon request
9202LD Drachten
€ 275.000 k.k.
€ 2.165/m²
Get free quotes from realtors with local market knowledge in Drachten.
Selling a home in Drachten? Compare real estate agents who know the local housing market. Also check out all real estate agents in Drachten or the top 10 real estate agents in Drachten for extra context for your choice.
By comparing brokers and requesting quotes
Short answers about housing prices, sold homes and comparing real estate agents in Drachten.
The costs of a real estate agent in Drachten vary per office, property type and sales approach. Therefore, compare multiple quotes and also look at the real estate agents in Drachten to better compare rates, presentation and local experience.
On this page we currently show 467 sold houses in Drachten from our selection. This helps you to better assess recent transactions and the local housing market.
Houses sold in Drachten give insight into asking prices, house types and neighborhoods where recent transactions have taken place. Compare this also with the current housing stock in Drachten to better understand the market.
You can use sold homes as a first market indication, but a local real estate agent can better take into account finishing, location, maintenance and current demand in Drachten.
Compare realtors in Drachten on local sales experience, reviews, expected yield, commission and marketing approach. The top 10 realtors in Drachten helps to quickly discover strong offices.
View current location data on residents, WOZ development, housing stock, energy consumption, business activity and safety in Drachten. In 2025 were there 46.030 residents. The average WOZ value in 2025 is EUR 268.385.
These figures help to better assess and compare the housing stock in Drachten with recent sold homes. Orient yourself then on suitable top real estate agents in Drachten for sales advice in this region.
Residents
46.030
Last year: 2025
Average WOZ
EUR 268.385
Last year: 2025
Average income per person.
EUR 26.669
Source: AllNumbers
Crimes (current year)
1.930
Total registered
| Year | Residents |
|---|---|
| 2021 | 45.172 |
| 2022 | 45.036 |
| 2023 | 45.297 |
| 2024 | 45.505 |
| 2025 | 46.030 |
| Year | Average WOZ |
|---|---|
| 2021 | EUR 196.093 |
| 2022 | EUR 217.007 |
| 2023 | EUR 255.736 |
| 2024 | EUR 263.833 |
| 2025 | EUR 268.385 |
Hoger
8.370
Praktisch
9.250
Middelbaar
15.340
Europa
2.375
Nederland
37.925
Buiten Europa
5.710
Label C
6.778
Label A
6.449
Label B
3.927
Label D
2.253
Label E
1.088
Label G
801
Label F
687
Label A+
505
Label A+++
437
Label A++++
174
Label A++
167
Label A+++++
13
| Year | Gas (m3) | Electricity (kWh) |
|---|---|---|
| 2020 | 1.214 | 2.417 |
| 2021 | 1.347 | 2.448 |
| 2022 | 1.060 | 2.288 |
| 2023 | 903 | 2.189 |
| 2024 | 883 | 2.260 |
Hoekwoning
Gas: 1.004 • Electricity: 2.255
Huurwoning
Gas: 780 • Electricity: 1.719
Koopwoning
Gas: 1.000 • Electricity: 2.557
Appartement
Gas: 666 • Electricity: 1.569
Tussenwoning
Gas: 904 • Electricity: 2.063
Vrijstaande woning
Gas: 1.250 • Electricity: 3.331
Twee-onder-één-kap woning
Gas: 975 • Electricity: 2.604
Total number of company establishments: 4.885
| Period | Crimes |
|---|---|
| jan 2025 | 194 |
| jan 2026 | 170 |
| jul 2025 | 129 |
| jun 2025 | 146 |
| mei 2025 | 150 |
| mrt 2025 | 140 |
| nov 2024 | 159 |
| nov 2025 | 181 |
| okt 2024 | 219 |
| okt 2025 | 207 |
| sep 2024 | 183 |
| sep 2025 | 174 |
These figures give an indicative picture of safety trends in the living environment of Drachten.
Short answers based on current local statistics, handy for a quick comparison of the living environment.
Drachten telt in 2025 ongeveer 46.030 inwoners.
De gemiddelde WOZ-waarde in Drachten is in 2025 circa € 268.385.
Het gemiddelde inkomen per inwoner in Drachten ligt rond € 26.669 per jaar.
Voor het huidige jaar gaat het om ongeveer 1.930 geregistreerde misdrijven. Gebruik deze cijfers als indicatie en vergelijk trends per periode.
In Drachten komt vooral "Tussenwoningen" veel voor, met ongeveer 7.619 woningen.