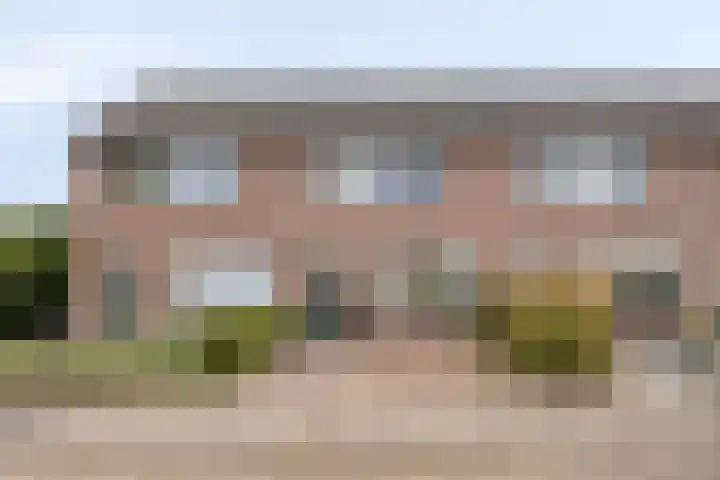
Houses sold in Driel

View 29 sold houses in Driel

Connected to: Vastgoed Nederland NVM Makelaars

On this page you will find recently sold homes in Driel. Use this overview to better estimate selling prices, popular neighborhoods, and the local housing supply before you choose a real estate agent. Also view the current housing supply with 34 houses in Driel.

Selection

Search and filter homes

Set your preferences and discover homes that suit you.

Total supply 241.257
Filters

Set price, area and other characteristics. Adjust a filter or click on Show homes. Location changes directly above.

Reset filters

You search for

  • Place Driel
  • Status Sold

Huis verkopen in Driel? Vergelijk verkoopmakelaars

Bekijk recente verkopen en ontvang gratis offertes van lokale verkoopmakelaars in Driel.

Free request a quote

  • Quotes in Driel
  • Non-binding
  • Personal
  • Gratis tarieven vergelijken

Zelf je woning verkopen in Driel? Vergelijk verkoopmakelaars in Driel of bekijk de beste verkoopmakelaars in Driel als referentie bij jouw keuze.

Vergelijk meerdere offertes

Makelaars maken scherpere voorstellen als ze weten dat je vergelijkt — vraag offertes aan voor verkoop of aankoop.

Frequently asked questions about sold homes in Driel

Short answers about housing prices, sold homes and comparing real estate agents in Driel.

Residential and neighborhood statistics in Driel

View current location data on residents, WOZ development, housing stock, energy consumption, business activity and safety in Driel. In 2026 were there 4.379 residents. The average WOZ value in 2025 is EUR 410.000.

These figures help to better assess and compare the housing stock in Driel with recent sold homes. Orient yourself then on suitable top real estate agents in Driel for sales advice in this region.

Residents

4.379

Last year: 2026

Average WOZ

EUR 410.000

Last year: 2025

Average income per person.

EUR 34.000

Source: AllNumbers

Crimes (current year)

66

Total registered

Demographics and WOZ development

Inhabitants per year

Inhabitants per year in Driel
Year Residents
2021 4.375
2022 4.345
2023 4.385
2024 4.380
2025 4.360
2026 4.379

Annual WOZ value

WOZ value per year in Driel
Year Average WOZ
2021 EUR 280.000
2022 EUR 315.000
2023 EUR 364.000
2024 EUR 391.000
2025 EUR 410.000

Composition of residents

Age build-up

65+: 830 0-15: 785 15-25: 515 25-45: 980 45-65: 1.240

Education level

Hoger

910

Praktisch

800

Middelbaar

1.490

Origin of residents (2025)

Europa

215

Nederland

3.815

Buiten Europa

330

Housing stock and construction periods

Types of homes

Hoekwoningen 355
Appartementen 190
Tussenwoningen 622
Vrijstaande woningen 354
Twee-onder-één-kap woningen 298

Construction period of buildings

Voor 1700 3
1700 tot 1900 22
1900 tot 1925 37
1925 tot 1950 179
1950 tot 1970 392
1970 tot 1980 404
1980 tot 1990 166
1990 tot 2000 103
2000 tot 2010 196
2010 tot 2020 235
2020 en later 38

Energy and sustainability

Energy label distribution

Label C

558

Label A

537

Label B

179

Label D

135

Label F

123

Label G

83

Label E

64

Label A+

26

Label A++

18

Label A+++

18

Label A++++

7

Label A+++++

0

Average energy consumption per year

Average energy consumption per year in Driel
Year Gas (m3) Electricity (kWh)
2020 1.300 3.160
2021 1.500 3.230
2022 1.150 3.050
2023 950 2.910
2024 940 3.010

Consumption per house type

Hoekwoning

Gas: 910 • Electricity: 2.560

Huurwoning

Gas: 870 • Electricity: 2.270

Koopwoning

Gas: 980 • Electricity: 3.180

Appartement

Gas: 740 • Electricity: 2.450

Tussenwoning

Gas: 800 • Electricity: 2.500

Vrijstaande woning

Gas: 1.250 • Electricity: 4.050

Twee-onder-één-kap woning

Gas: 1.070 • Electricity: 3.140

Business activity in Driel (2025)

Handel en HORECA 70
Nijverheid en energie 85
Zakelijke dienstverlening 120
Overheid, onderwijs en zorg 100
Landbouw, bosbouw en visserij 20
Vervoer, informatie en communicatie 35
Financiele diensten en onroerendgoed 20
Cultuur, recreatie en overige diensten 55

Total number of company establishments: 500

Recent crime statistics

Recent crime statistics in Driel
Period Crimes
jan 2026 4
jul 2025 6
jun 2025 6
mei 2025 4
mrt 2025 3
mrt 2026 4
nov 2024 7
nov 2025 7
okt 2024 9
okt 2025 2
sep 2024 17
sep 2025 6

These figures give an indicative picture of safety trends in the living environment of Driel.

Frequently asked questions about living in Driel

Short answers based on current local statistics, handy for a quick comparison of the living environment.

Hoeveel inwoners heeft Driel?

Driel telt in 2026 ongeveer 4.379 inwoners.

Wat is de gemiddelde WOZ-waarde in Driel?

De gemiddelde WOZ-waarde in Driel is in 2025 circa € 410.000.

Wat is het gemiddelde inkomen per inwoner in Driel?

Het gemiddelde inkomen per inwoner in Driel ligt rond € 34.000 per jaar.

Hoe veilig is wonen in Driel?

Voor het huidige jaar gaat het om ongeveer 66 geregistreerde misdrijven. Gebruik deze cijfers als indicatie en vergelijk trends per periode.

Welke woningtypen komen het meest voor in Driel?

In Driel komt vooral "Tussenwoningen" veel voor, met ongeveer 622 woningen.

Gratis vrijblijvende offertes ontvangen

Vergelijk meerdere makelaars en kies de beste match.