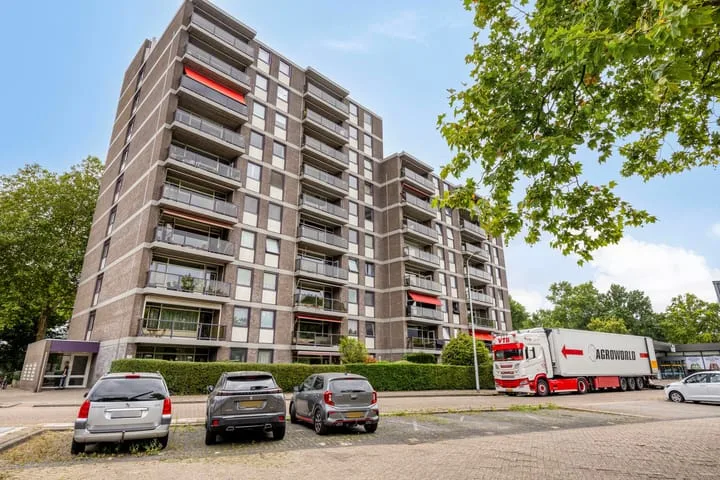
- Sold
Diekirchlaan 161
5625AH Eindhoven
€ 450.000 k.k.
€ 4.545/m²
- Living area
- 99 m²
- Land area
- —
- Bedrooms
- 2
Found: 3.378 houses in Eindhoven within your selection
Type to search. Use arrow down and arrow up to navigate through results and press Enter to open.
Hidden search suggestions.
Refine your selection in Eindhoven or reset the filters for the full housing stock.
View the current housing stock in Eindhoven and quickly filter by price, living area, rooms and more. There are currently 3.378 houses in this place within our selection. View also 2.190 sold houses in Eindhoven for extra insight into the local housing market.
5625AH Eindhoven
€ 450.000 k.k.
€ 4.545/m²
5644CT Eindhoven
€ 375.000 k.k.
€ 5.281/m²
5653LM Eindhoven
€ 359.000 k.k.
€ 4.487/m²
5624KZ Eindhoven
€ 760.000 k.k.
€ 4.871/m²
5651HE Eindhoven
€ 639.000 k.k.
€ 5.325/m²
5616JB Eindhoven
€ 1.450.000 k.k.
€ 5.069/m²
5632AD Eindhoven
€ 550.000 k.k.
€ 3.374/m²
5628WR Eindhoven
€ 435.000 k.k.
€ 3.990/m²
5611BJ Eindhoven
€ 499.500 k.k.
€ 6.842/m²
5628GA Eindhoven
€ 495.000 k.k.
€ 3.367/m²
5628KP Eindhoven
€ 450.000 k.k.
€ 3.515/m²
5632HP Eindhoven
€ 389.000 k.k.
€ 3.929/m²
5646JA Eindhoven
€ 485.000 k.k.
€ 4.254/m²
5627HH Eindhoven
€ 500.000 k.k.
€ 3.676/m²
5611KG Eindhoven
€ 450.000 k.k.
€ 5.172/m²
5629NA Eindhoven
€ 575.000 k.k.
€ 4.637/m²
5614HH Eindhoven
€ 475.000 k.k.
€ 3.893/m²
5629NE Eindhoven
€ 445.000 k.k.
€ 4.494/m²
5614CJ Eindhoven
€ 384.500 k.k.
€ 4.419/m²
5644RJ Eindhoven
€ 1.485.000 k.k.
€ 6.086/m²
5616BS Eindhoven
€ 584.000 k.k.
€ 5.034/m²
5614BL Eindhoven
€ 600.000 k.k.
€ 4.651/m²
5614HX Eindhoven
€ 540.000 k.k.
€ 4.778/m²
5658BN Eindhoven
€ 550.000 k.k.
€ 4.583/m²
5654DK Eindhoven
€ 495.000 k.k.
€ 4.057/m²
5629GG Eindhoven
€ 625.000 k.k.
€ 4.139/m²
5623CG Eindhoven
€ 360.000 k.k.
€ 4.186/m²
5642NB Eindhoven
€ 300.000 k.k.
€ 5.263/m²
Get free quotes from realtors with local market knowledge in Eindhoven.
Selling a home in Eindhoven? Compare real estate agents who know the local housing market. Also check out all real estate agents in Eindhoven or the top 10 real estate agents in Eindhoven for extra context for your choice.
By comparing brokers and requesting quotes
Practical answers about housing supply, sales and comparing real estate agents in Eindhoven.
The costs of a real estate agent in Eindhoven depend on commission, start-up costs, property presentation and the chosen service. View the real estate agents in Eindhoven and request multiple quotes to compare rates and approach properly.
Within our selection, we are currently showing 3.378 houses in Eindhoven. View also the sold houses in Eindhoven to compare the current offering with recent transactions.
Let naast prijs en woonoppervlakte ook op onderhoud, energielabel, ligging, buitenruimte en de verkoopstatus. Zo vergelijk je woningen in Eindhoven op meer dan alleen de vraagprijs.
A local real estate agent knows the neighborhoods, recent transactions and demand in Eindhoven. By comparing agents you get a better insight into fees, sales strategy and expected yield; the top 10 in Eindhoven gives a handy starting point.
Yes, when making a sales plan, a valuation in Eindhoven is wise. You gain insight into a realistic asking price and can then compare offers from real estate agents specifically.
View current location data on residents, WOZ development, housing stock, energy consumption, business activity and safety in Eindhoven. In 2026 were there 249.873 residents. The average WOZ value in 2025 is EUR 391.000.
These figures help to better assess and compare the housing stock in Eindhoven with recent sold homes. Orient yourself then on suitable top real estate agents in Eindhoven for sales advice in this region.
Residents
249.873
Last year: 2026
Average WOZ
EUR 391.000
Last year: 2025
Average income per person.
EUR 36.400
Source: AllNumbers
Crimes (current year)
18.880
Total registered
| Year | Residents |
|---|---|
| 2022 | 238.326 |
| 2023 | 243.730 |
| 2024 | 246.417 |
| 2025 | 249.035 |
| 2026 | 249.873 |
| Year | Average WOZ |
|---|---|
| 2021 | EUR 287.000 |
| 2022 | EUR 314.000 |
| 2023 | EUR 360.000 |
| 2024 | EUR 363.000 |
| 2025 | EUR 391.000 |
Hoger
43
Praktisch
24
Middelbaar
34
Europa
36.936
Nederland
134.959
Buiten Europa
77.140
Label A
34.103
Label C
29.742
Label B
19.304
Label D
11.177
Label E
9.327
Label F
6.306
Label A+
5.788
Label G
4.088
Label A++
3.731
Label A+++
2.635
Label A++++
578
Label A+++++
42
| Year | Gas (m3) | Electricity (kWh) |
|---|---|---|
| 2020 | 1.040 | 2.540 |
| 2021 | 1.140 | 2.570 |
| 2022 | 900 | 2.400 |
| 2023 | 770 | 2.270 |
| 2024 | 750 | 2.310 |
Hoekwoning
Gas: 970 • Electricity: 2.650
Huurwoning
Gas: 670 • Electricity: 1.900
Koopwoning
Gas: 890 • Electricity: 2.740
Appartement
Gas: 550 • Electricity: 1.710
Tussenwoning
Gas: 830 • Electricity: 2.450
Vrijstaande woning
Gas: 1.400 • Electricity: 4.320
Twee-onder-één-kap woning
Gas: 1.210 • Electricity: 3.250
Total number of company establishments: 33.545
| Period | Crimes |
|---|---|
| jan 2025 | 1.526 |
| jan 2026 | 1.357 |
| jul 2025 | 1.556 |
| jun 2025 | 1.564 |
| mei 2025 | 1.610 |
| mrt 2025 | 1.666 |
| nov 2024 | 1.768 |
| nov 2025 | 1.541 |
| okt 2024 | 1.807 |
| okt 2025 | 1.706 |
| sep 2024 | 1.612 |
| sep 2025 | 1.579 |
These figures give an indicative picture of safety trends in the living environment of Eindhoven.
Short answers based on current local statistics, handy for a quick comparison of the living environment.
Eindhoven telt in 2026 ongeveer 249.873 inwoners.
De gemiddelde WOZ-waarde in Eindhoven is in 2025 circa € 391.000.
Het gemiddelde inkomen per inwoner in Eindhoven ligt rond € 36.400 per jaar.
Voor het huidige jaar gaat het om ongeveer 18.880 geregistreerde misdrijven. Gebruik deze cijfers als indicatie en vergelijk trends per periode.
In Eindhoven komt vooral "Appartementen" veel voor, met ongeveer 58.911 woningen.