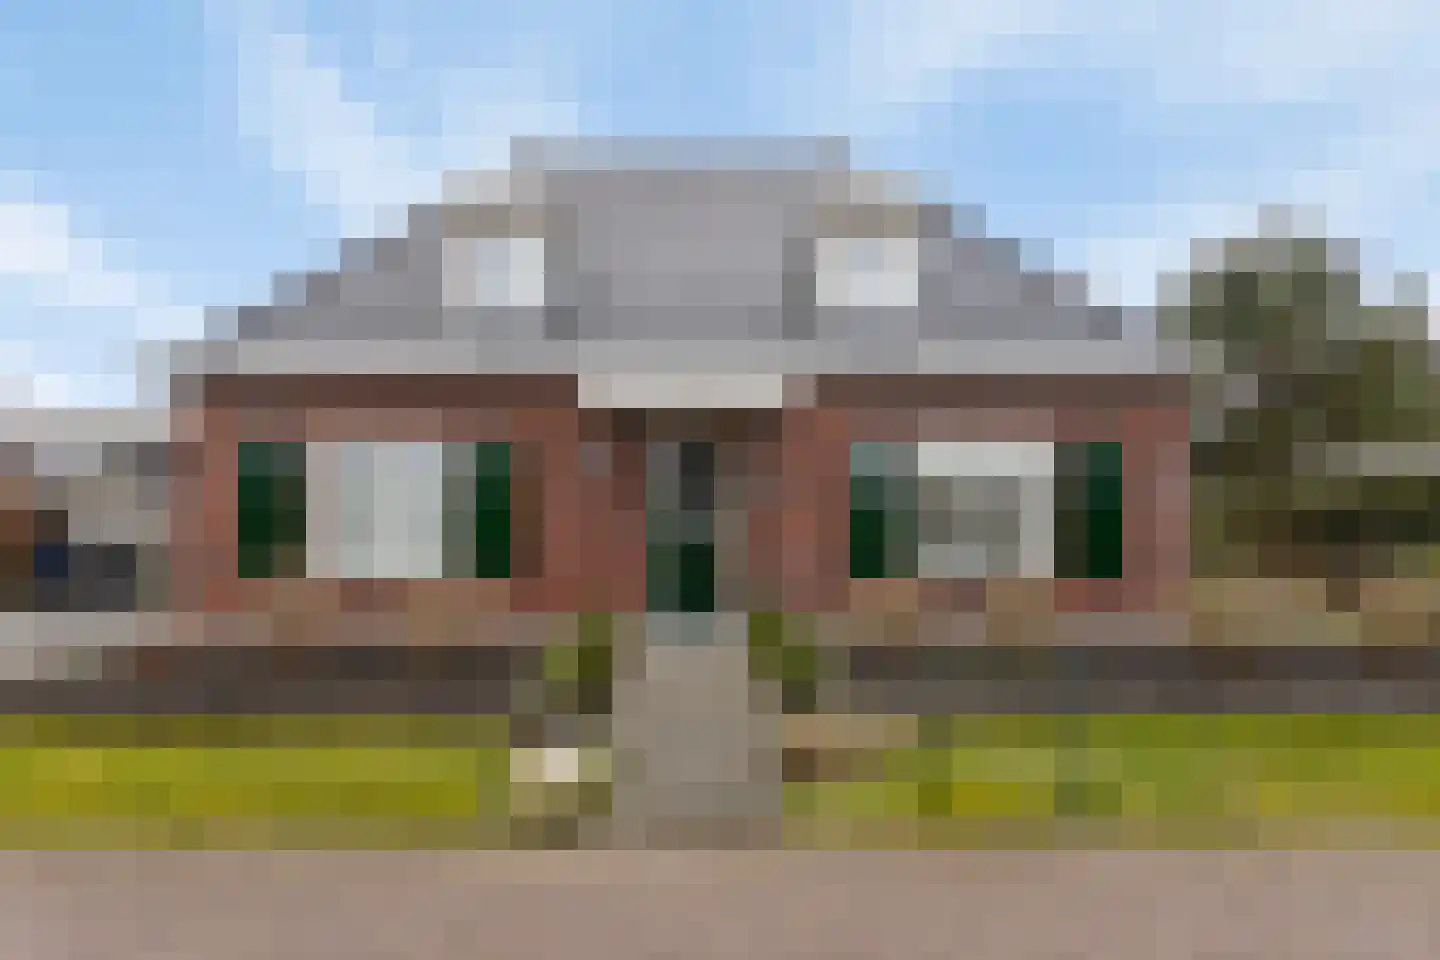
Housing offer in Harkstede

Searching in 37 houses in Harkstede

Connected to: Vastgoed Nederland NVM Makelaars

View the current housing stock in Harkstede and quickly filter by price, living area, rooms and more. There are currently 37 houses in this place within our selection. View also 32 sold houses in Harkstede for extra insight into the local housing market.

Selection

Search and filter homes

Set your preferences and discover homes that suit you.

Total supply 242.654
Filters

Set price, area and other characteristics. Adjust a filter or click on Show homes. Location changes directly above.

Reset filters

You search for

  • Place Harkstede

Selling a home in Harkstede? Compare realtor offers

Get free quotes from real estate agents with local market knowledge. Compare more than 106 real estate agents in Harkstede.

Free request a quote

  • Quotes in Harkstede
  • Non-binding
  • Personal
  • Compare free rates

Selling a home in Harkstede? Compare all real estate agents in Harkstede or view the top 10 real estate agents in Harkstede for extra context for your choice.

Compare multiple quotes

Real estate agents make sharper offers when they know you're comparing — ask for quotes for sale or purchase.

Frequently asked questions about homes in Harkstede

Practical answers about housing supply, sales and comparing real estate agents in Harkstede.

Residential and neighborhood statistics in Harkstede

View current location data on residents, WOZ development, housing stock, energy consumption, business activity and safety in Harkstede.

These figures help to better assess and compare the housing stock in Harkstede with recent sold homes. Orient yourself then on suitable top real estate agents in Harkstede for sales advice in this region.

Residents

-

No data

Average WOZ

-

No data

Average income per person.

EUR 29.800

Source: AllNumbers

Crimes (current year)

66

Total registered

Composition of residents

Education level

Hoog opleidingsniveau

880

Laag opleidingsniveau

460

Middelbaar opleidingsniveau

890

Housing stock and construction periods

Construction period of buildings

2020+ 46
<1700 1
1700-1900 15
1900-1925 70
1925-1950 120
1950-1970 145
1970-1980 172
1980-1990 106
1990-2000 313
2000-2010 360
2010-2020 16

Energy and sustainability

Energy label distribution

Label A

470

Label B

256

Label C

225

Label G

131

Label D

96

Label F

59

Label A+

38

Label E

29

Label A++

2

Label A+++

2

Label A++++

0

Label A+++++

0

Recent crime statistics

Recent crime statistics in Harkstede
Period Crimes
jan 2023 1
jul 2022 4
jul 2023 4
jun 2022 5
jun 2023 3
mei 2022 5
mei 2023 1
mrt 2022 9
mrt 2023 3
nov 2022 5
okt 2022 7
sep 2022 6

These figures give an indicative picture of safety trends in the living environment of Harkstede.

Frequently asked questions about living in Harkstede

Short answers based on current local statistics, handy for a quick comparison of the living environment.

Wat is het gemiddelde inkomen per inwoner in Harkstede?

Het gemiddelde inkomen per inwoner in Harkstede ligt rond € 29.800 per jaar.

Hoe veilig is wonen in Harkstede?

Voor het huidige jaar gaat het om ongeveer 66 geregistreerde misdrijven. Gebruik deze cijfers als indicatie en vergelijk trends per periode.

Receive free, non-binding quotes

Compare multiple real estate agents and choose the best match.