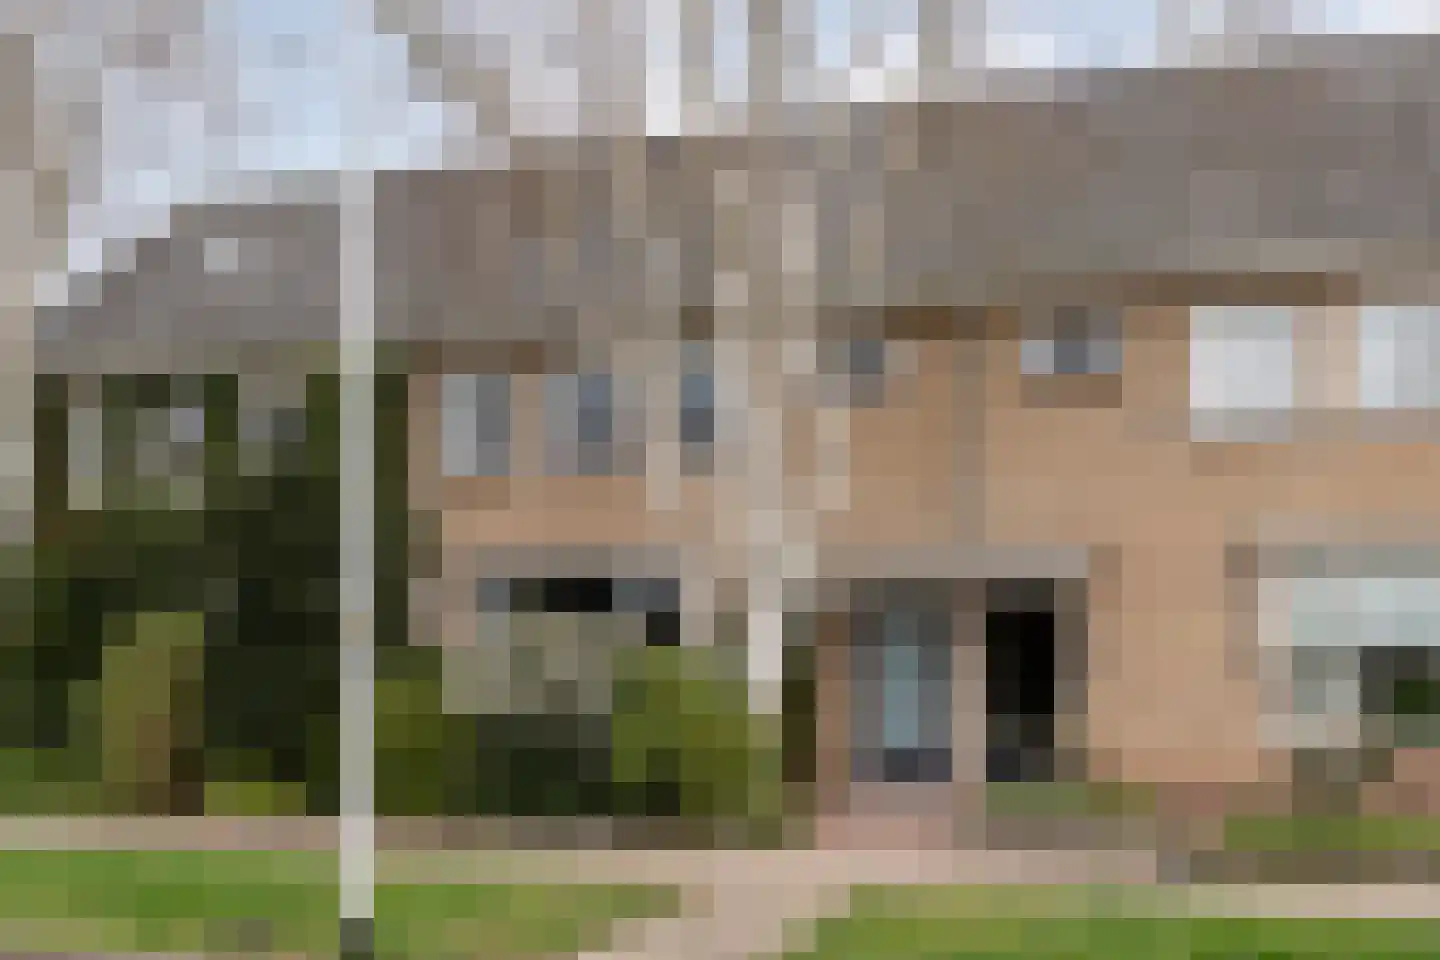
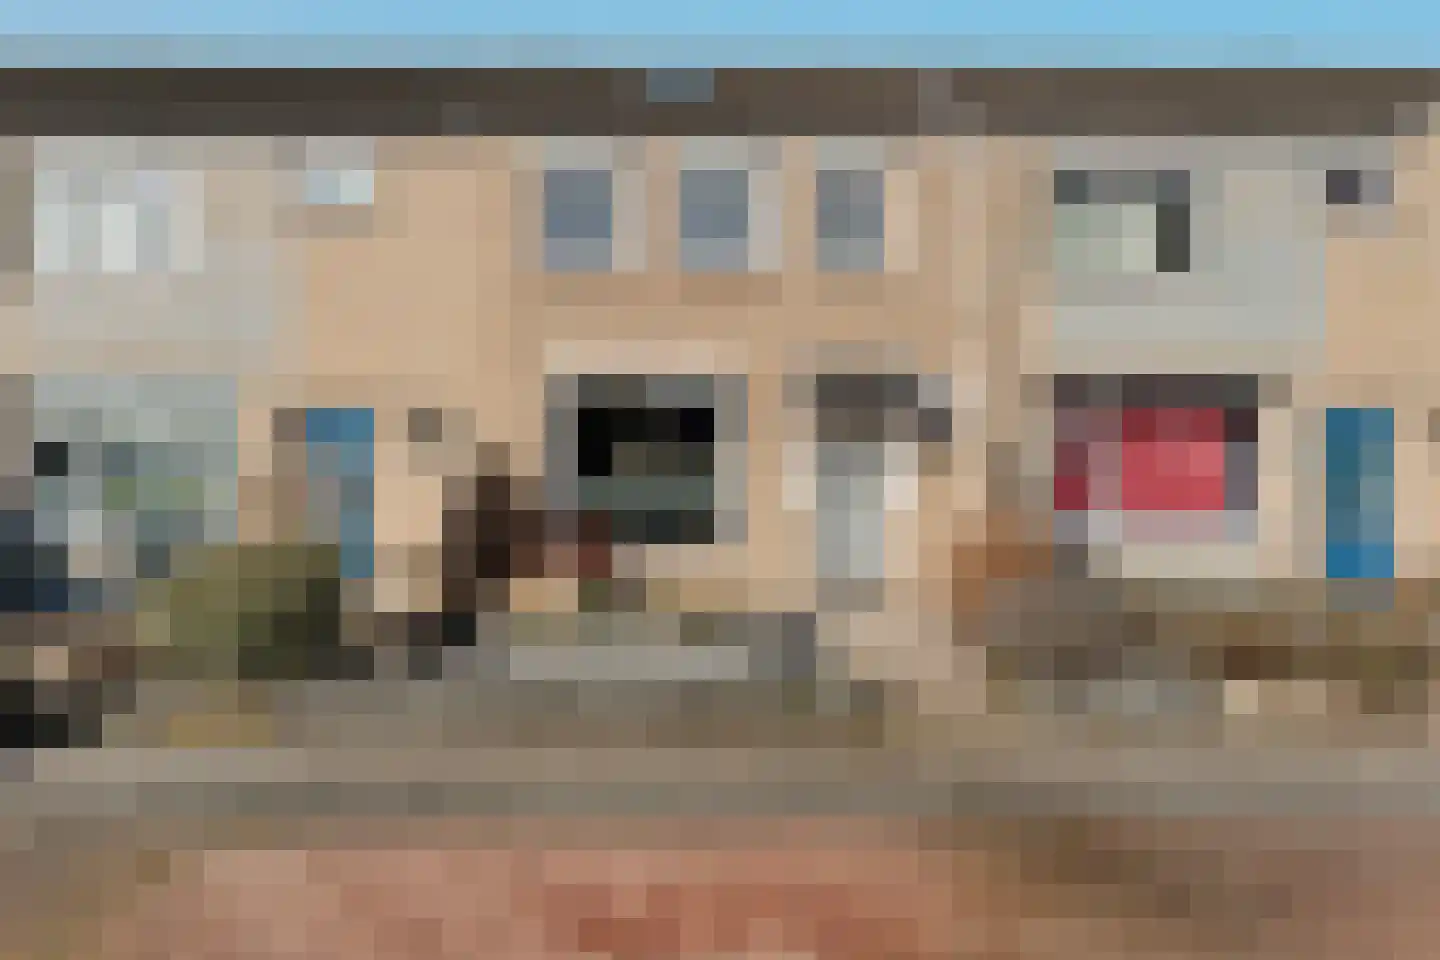
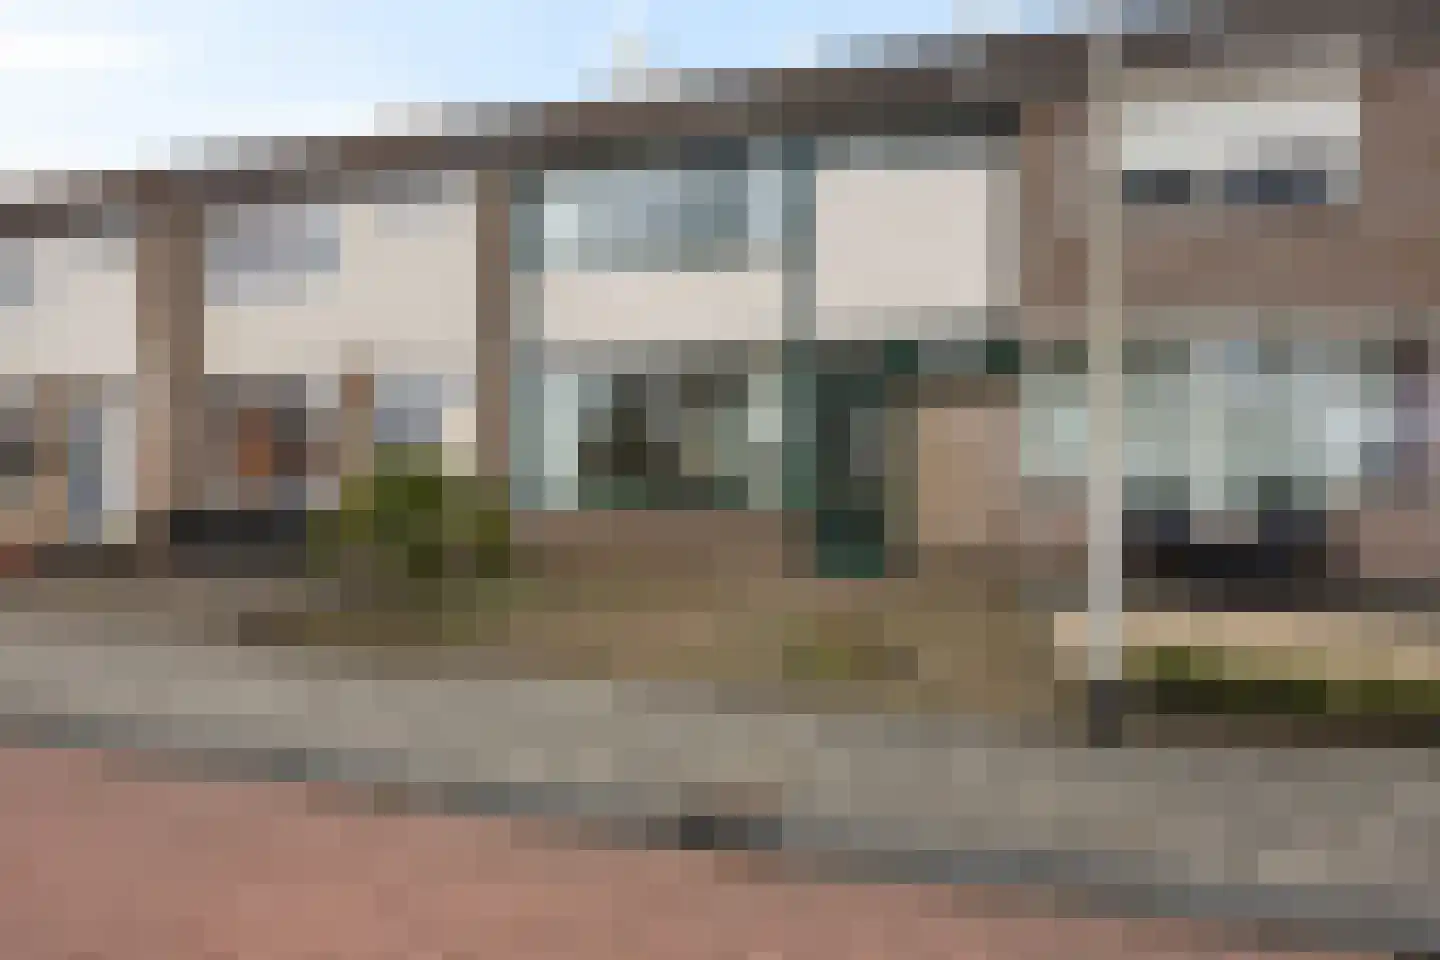
Houses sold in Hasselt

View 83 sold houses in Hasselt

Connected to: Vastgoed Nederland NVM Makelaars

On this page you will find recently sold homes in Hasselt. Use this overview to better estimate selling prices, popular neighborhoods, and the local housing supply before you choose a real estate agent. Also view the current housing supply with 107 houses in Hasselt.

Selection

Search and filter homes

Set your preferences and discover homes that suit you.

Total supply 241.263
Filters

Set price, area and other characteristics. Adjust a filter or click on Show homes. Location changes directly above.

Reset filters

You search for

  • Place Hasselt
  • Status Sold

Huis verkopen in Hasselt? Vergelijk verkoopmakelaars

Bekijk recente verkopen en ontvang gratis offertes van lokale verkoopmakelaars in Hasselt.

Free request a quote

  • Quotes in Hasselt
  • Non-binding
  • Personal
  • Gratis tarieven vergelijken

Zelf je woning verkopen in Hasselt? Vergelijk verkoopmakelaars in Hasselt of bekijk de beste verkoopmakelaars in Hasselt als referentie bij jouw keuze.

Vergelijk meerdere offertes

Makelaars maken scherpere voorstellen als ze weten dat je vergelijkt — vraag offertes aan voor verkoop of aankoop.

Frequently asked questions about sold homes in Hasselt

Short answers about housing prices, sold homes and comparing real estate agents in Hasselt.

Residential and neighborhood statistics in Hasselt

View current location data on residents, WOZ development, housing stock, energy consumption, business activity and safety in Hasselt. In 2026 were there 7.972 residents. The average WOZ value in 2025 is EUR 338.830.

These figures help to better assess and compare the housing stock in Hasselt with recent sold homes. Orient yourself then on suitable top real estate agents in Hasselt for sales advice in this region.

Residents

7.972

Last year: 2026

Average WOZ

EUR 338.830

Last year: 2025

Average income per person.

EUR 28.694

Source: AllNumbers

Crimes (current year)

117

Total registered

Demographics and WOZ development

Inhabitants per year

Inhabitants per year in Hasselt
Year Residents
2021 7.380
2022 7.520
2023 7.735
2024 7.775
2025 7.840
2026 7.972

Annual WOZ value

WOZ value per year in Hasselt
Year Average WOZ
2021 EUR 236.693
2022 EUR 264.025
2023 EUR 300.626
2024 EUR 319.504
2025 EUR 338.830

Composition of residents

Age build-up

65+: 1.635 0-15: 1.420 15-25: 915 25-45: 1.945 45-65: 1.985

Education level

Hoger

1.390

Praktisch

1.580

Middelbaar

2.730

Origin of residents (2025)

Europa

305

Nederland

7.055

Buiten Europa

480

Housing stock and construction periods

Types of homes

Hoekwoningen 701
Appartementen 376
Tussenwoningen 1.208
Vrijstaande woningen 514
Twee-onder-één-kap woningen 511

Construction period of buildings

Voor 1700 85
1700 tot 1900 139
1900 tot 1925 81
1925 tot 1950 164
1950 tot 1970 728
1970 tot 1980 658
1980 tot 1990 403
1990 tot 2000 496
2000 tot 2010 118
2010 tot 2020 312
2020 en later 210

Energy and sustainability

Energy label distribution

Label C

993

Label A

686

Label B

533

Label D

220

Label F

207

Label G

178

Label A+++

94

Label E

87

Label A+

87

Label A++++

65

Label A++

57

Label A+++++

1

Average energy consumption per year

Average energy consumption per year in Hasselt
Year Gas (m3) Electricity (kWh)
2020 1.235 2.858
2021 1.401 2.966
2022 1.081 2.818
2023 883 2.693
2024 845 2.778

Consumption per house type

Hoekwoning

Gas: 874 • Electricity: 2.453

Huurwoning

Gas: 794 • Electricity: 2.117

Koopwoning

Gas: 918 • Electricity: 2.890

Appartement

Gas: 547 • Electricity: 1.970

Tussenwoning

Gas: 743 • Electricity: 2.200

Vrijstaande woning

Gas: 1.135 • Electricity: 3.689

Twee-onder-één-kap woning

Gas: 982 • Electricity: 2.953

Business activity in Hasselt (2025)

Handel en HORECA 150
Nijverheid en energie 140
Zakelijke dienstverlening 170
Overheid, onderwijs en zorg 120
Landbouw, bosbouw en visserij 60
Vervoer, informatie en communicatie 50
Financiele diensten en onroerendgoed 40
Cultuur, recreatie en overige diensten 90

Total number of company establishments: 820

Recent crime statistics

Recent crime statistics in Hasselt
Period Crimes
jan 2026 8
jul 2025 11
jun 2025 11
mei 2025 9
mrt 2025 7
mrt 2026 12
nov 2024 14
nov 2025 10
okt 2024 10
okt 2025 7
sep 2024 17
sep 2025 13

These figures give an indicative picture of safety trends in the living environment of Hasselt.

Frequently asked questions about living in Hasselt

Short answers based on current local statistics, handy for a quick comparison of the living environment.

Hoeveel inwoners heeft Hasselt?

Hasselt telt in 2026 ongeveer 7.972 inwoners.

Wat is de gemiddelde WOZ-waarde in Hasselt?

De gemiddelde WOZ-waarde in Hasselt is in 2025 circa € 338.830.

Wat is het gemiddelde inkomen per inwoner in Hasselt?

Het gemiddelde inkomen per inwoner in Hasselt ligt rond € 28.694 per jaar.

Hoe veilig is wonen in Hasselt?

Voor het huidige jaar gaat het om ongeveer 117 geregistreerde misdrijven. Gebruik deze cijfers als indicatie en vergelijk trends per periode.

Welke woningtypen komen het meest voor in Hasselt?

In Hasselt komt vooral "Tussenwoningen" veel voor, met ongeveer 1.208 woningen.

Gratis vrijblijvende offertes ontvangen

Vergelijk meerdere makelaars en kies de beste match.