- Under consideration
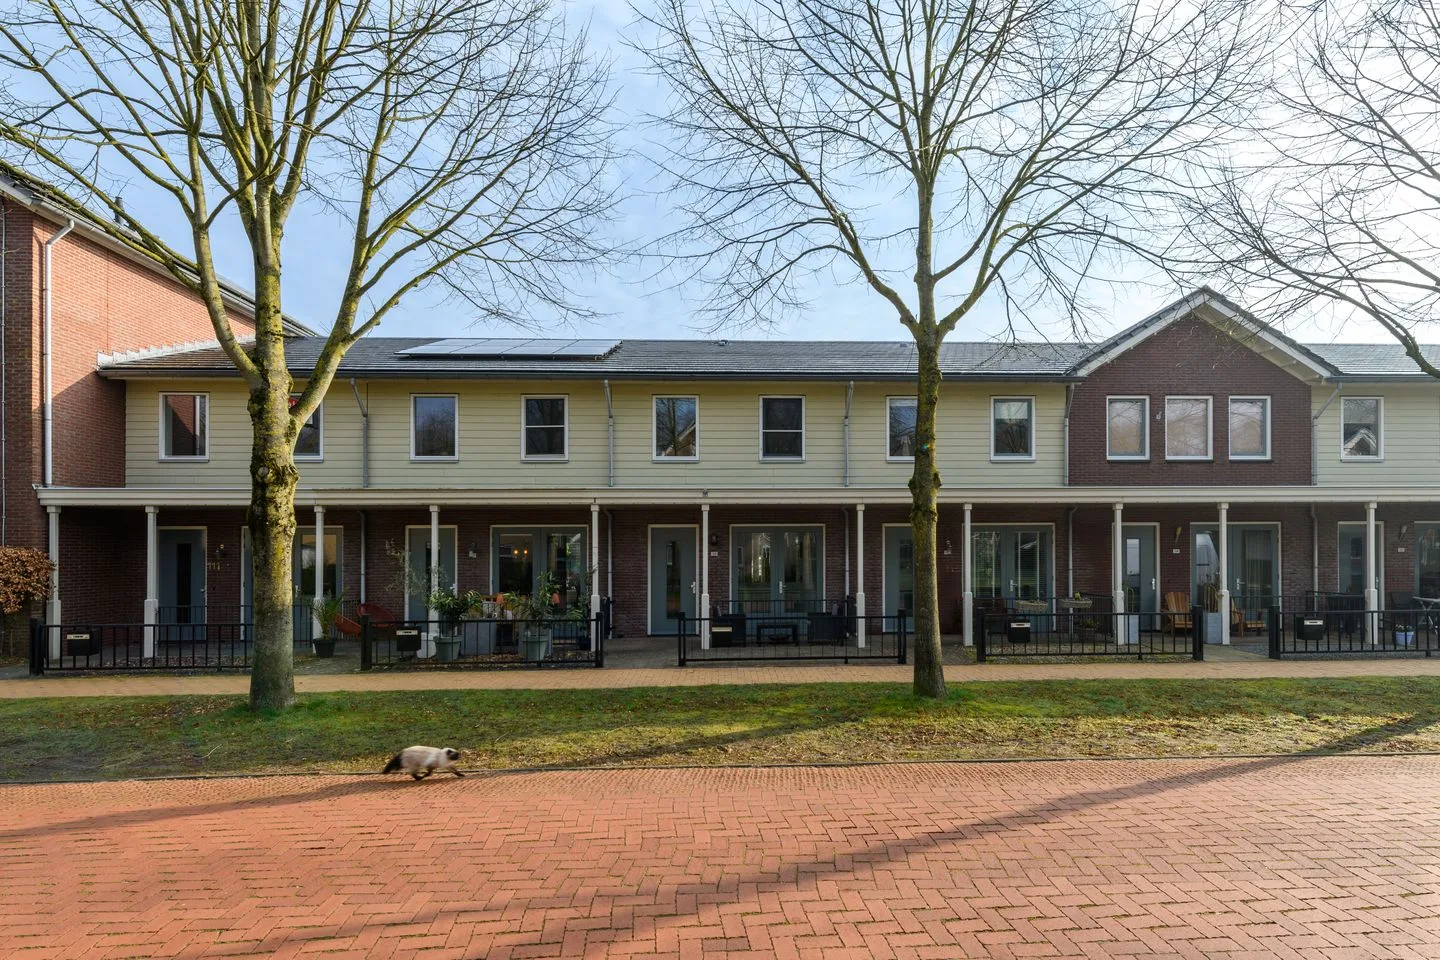
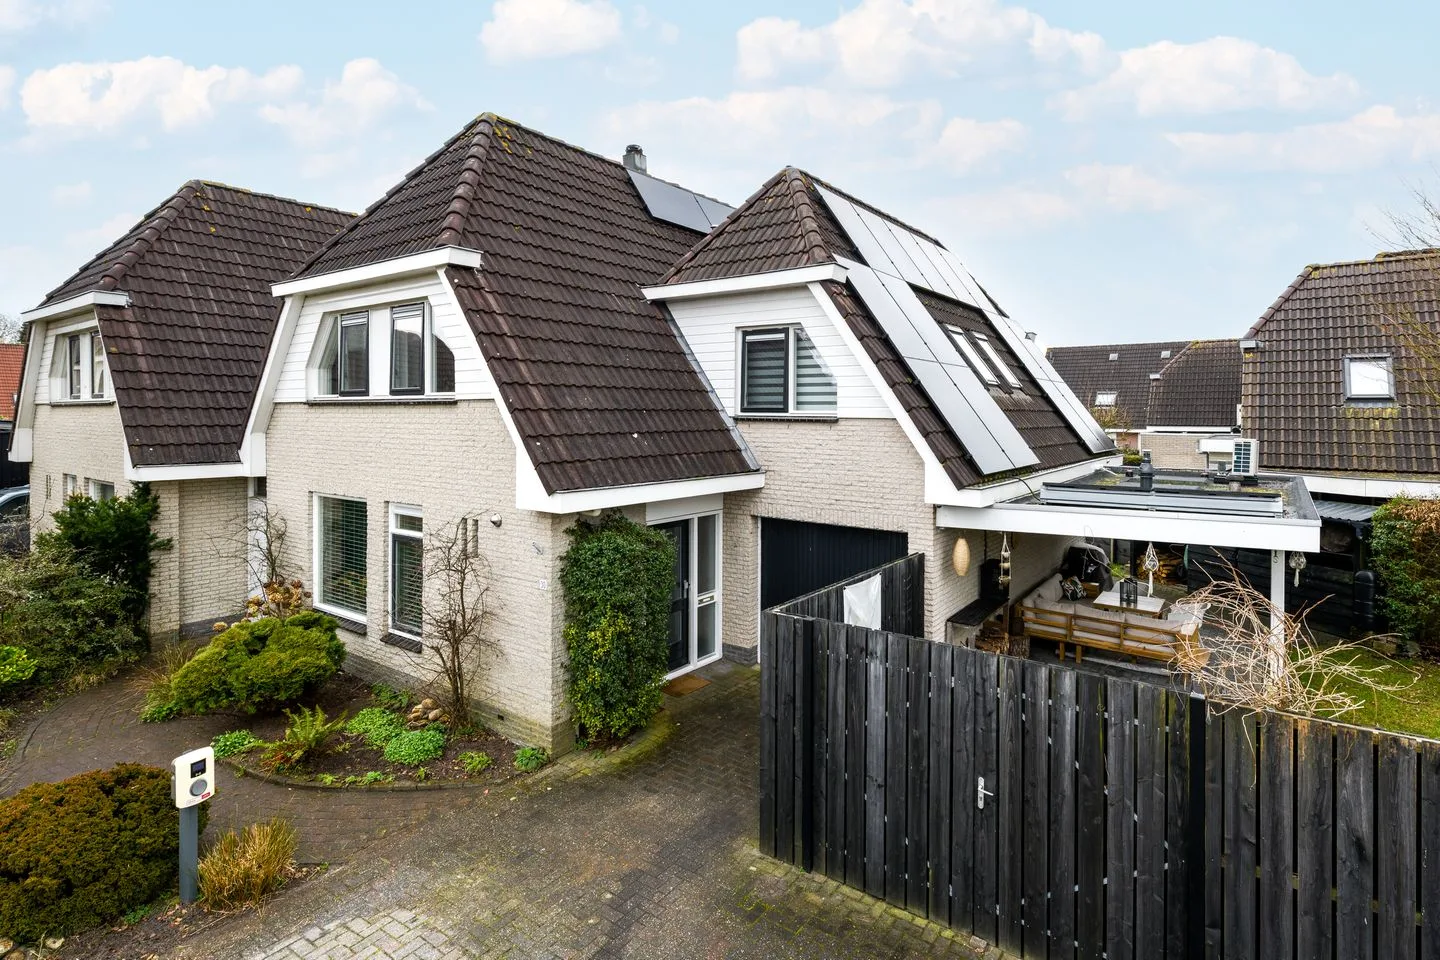
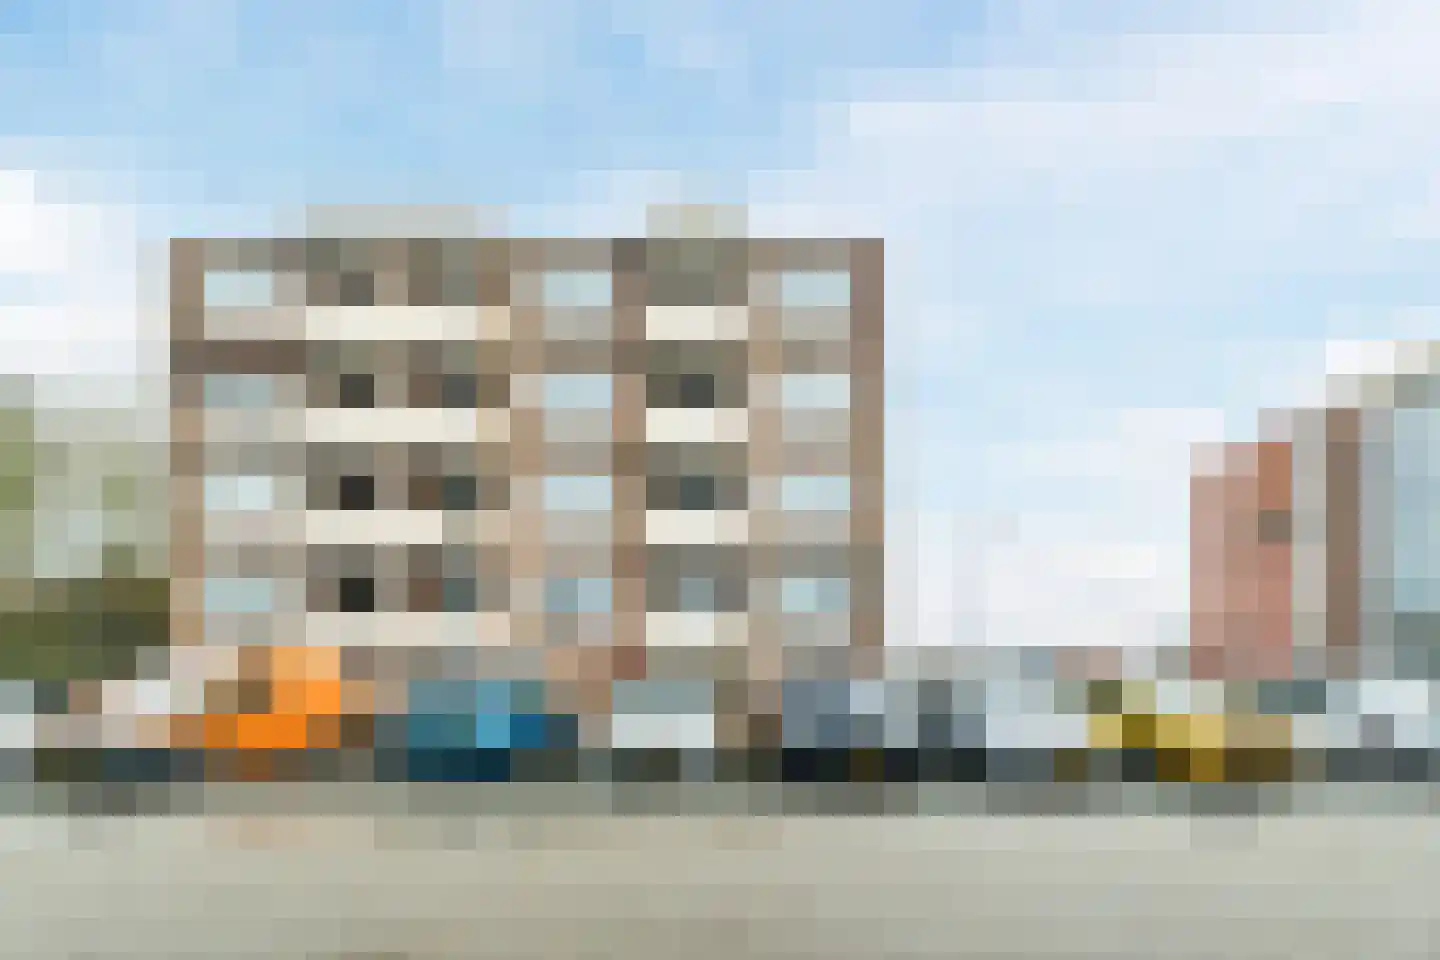
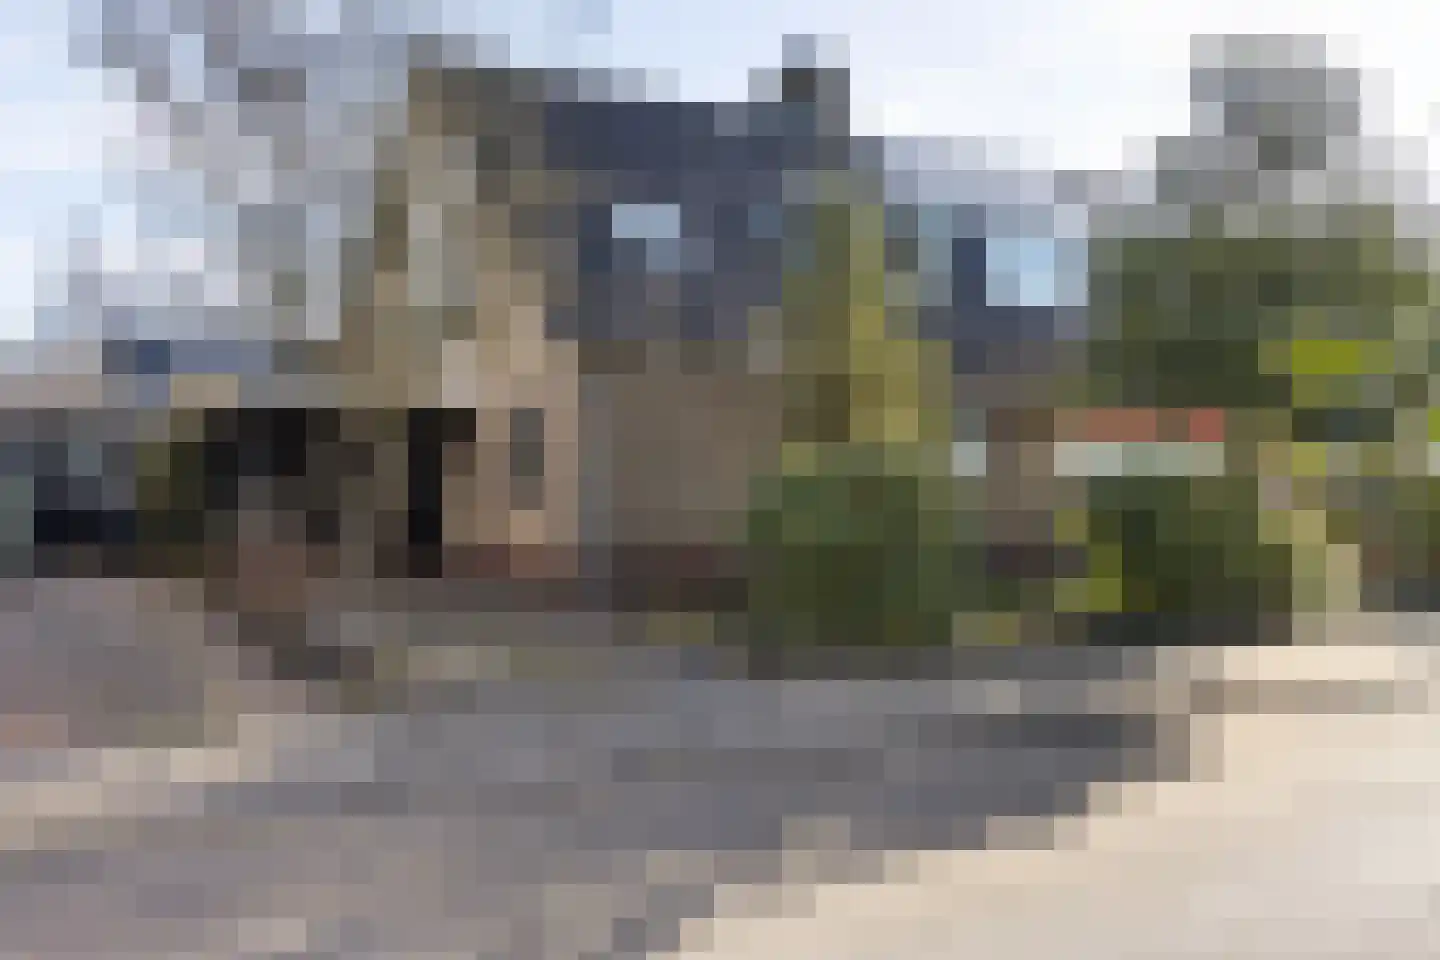
Zwette 17
8446ME Heerenveen
€ 379.000 k.k.
€ 2.938/m²
D
Save as favorite
- Living area
- 129 m²
- Land area
- 260 m²
- Bedrooms
- 4