- Sold subject to confirmation
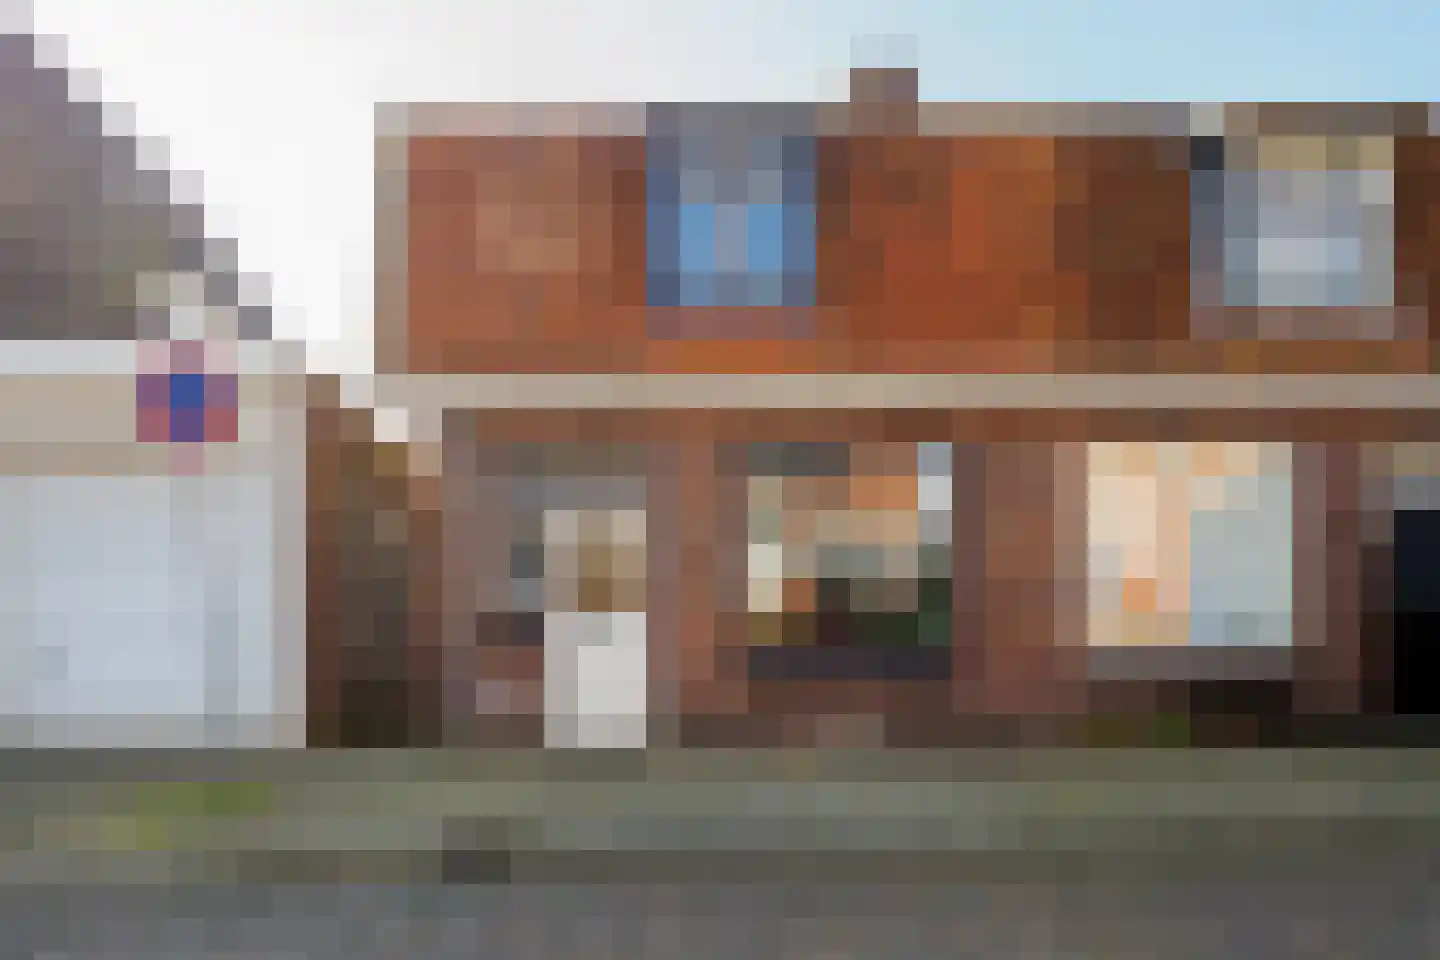
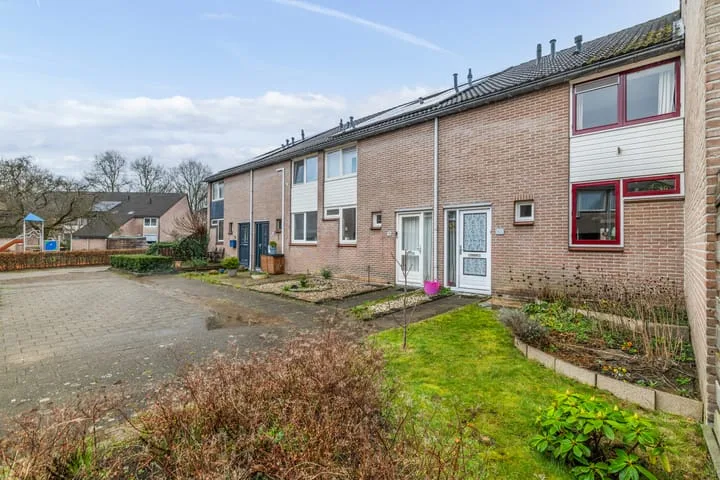
Alexanderstraat 66
7553WZ Hengelo
€ 289.000 k.k.
€ 3.042/m²
D
Save as favorite
- Living area
- 95 m²
- Land area
- 175 m²
- Bedrooms
- 3