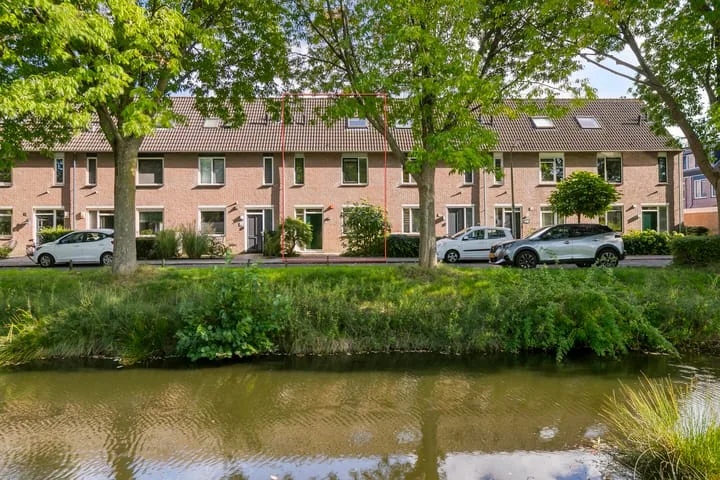
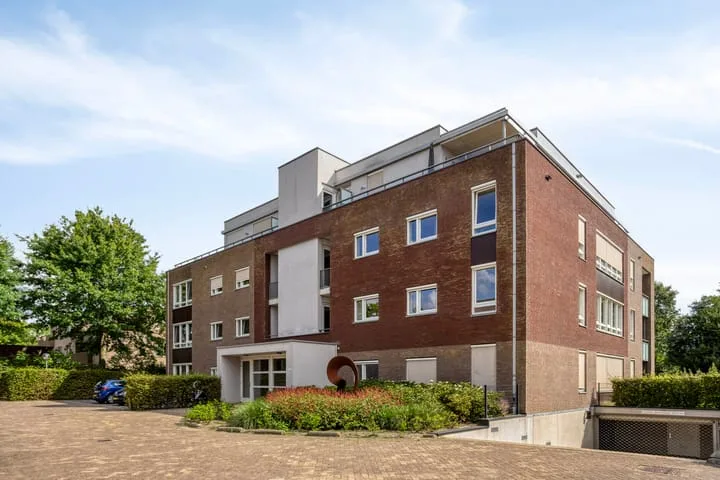
- Sold
Kolkrijst 29
3828EJ Hoogland
€ 469.500 k.k.
€ 3.848/m²
- Living area
- 122 m²
- Land area
- 243 m²
- Bedrooms
- 4
Searching in 112 houses in Hoogland
Type to search. Use arrow down and arrow up to navigate through results and press Enter to open.
Hidden search suggestions.
View current properties in Hoogland or search targeted on street, postal code and property characteristics.
View the current housing stock in Hoogland and quickly filter by price, living area, rooms and more. There are currently 112 houses in this place within our selection. View also 88 sold houses in Hoogland for extra insight into the local housing market.
3828EJ Hoogland
€ 469.500 k.k.
€ 3.848/m²
3828CX Hoogland
€ 339.000 k.k.
€ 5.745/m²
3828AJ Hoogland
€ 1.250.000 k.k.
€ 5.682/m²
3828JD Hoogland
€ 645.000 k.k.
€ 4.006/m²
3828JM Hoogland
€ 675.000 k.k.
€ 5.818/m²
3828CE Hoogland
€ 550.000 k.k.
€ 4.782/m²
3828GT Hoogland
€ 550.000 k.k.
€ 3.416/m²
3828CH Hoogland
€ 525.000 k.k.
€ 4.101/m²
3828JM Hoogland
€ 350.000 k.k.
€ 6.363/m²
3828PK Hoogland
€ 1.895.000 k.k.
€ 4.211/m²
3828CZ Hoogland
€ 295.000 k.k.
€ 5.566/m²
3828HG Hoogland
€ 560.000 k.k.
€ 4.480/m²
3828TB Hoogland
€ 800.000 k.k.
€ 4.878/m²
3828EL Hoogland
€ 475.000 k.k.
€ 3.544/m²
3828BZ Hoogland
€ 600.000 k.k.
€ 4.838/m²
3828VD Hoogland
€ 535.000 k.k.
€ 4.349/m²
3828DA Hoogland
€ 525.000 k.k.
€ 5.000/m²
3828SJ Hoogland
€ 475.000 k.k.
€ 4.656/m²
3828RE Hoogland
€ 550.000 k.k.
€ 4.867/m²
3828VS Hoogland
€ 537.000 k.k.
€ 4.365/m²
3828CJ Hoogland
€ 945.000 k.k.
€ 5.869/m²
3828ER Hoogland
€ 525.000 k.k.
€ 5.303/m²
3828AD Hoogland
€ 975.000 k.k.
€ 4.733/m²
3828CJ Hoogland
€ 799.000 k.k.
€ 6.053/m²
3828AN Hoogland
€ 585.000 k.k.
€ 6.358/m²
3828LH Hoogland
€ 575.000 k.k.
€ 5.582/m²
3828CG Hoogland
€ 525.000 k.k.
€ 4.133/m²
3828LJ Hoogland
€ 695.000 k.k.
€ 4.826/m²
Get free quotes from real estate agents with local market knowledge. Compare more than 103 real estate agents in Hoogland.
Selling a home in Hoogland? View the sales-oriented guide sell a house in Hoogland, compare all real estate agents in Hoogland or view the top 10 real estate agents in Hoogland for extra context to your choice.
Real estate agents make sharper offers when they know you're comparing — ask for quotes for sale or purchase.
Practical answers about housing supply, sales and comparing real estate agents in Hoogland.
The costs of a real estate agent in Hoogland depend on commission, setup costs, property presentation and the chosen service. Compare the 103 real estate agents in Hoogland via the real estate agent page and request multiple quotes to compare rates and approach well.
Within our selection, we are currently showing 112 houses in Hoogland. View also the sold houses in Hoogland to compare the current offering with recent transactions.
Take into account not only price and living area but also maintenance, energy label, location, outdoor space and sales status. This way you compare houses in Hoogland on more than just the asking price.
A local real estate agent knows the neighborhoods, recent transactions and demand in Hoogland. By comparing 103 real estate agents in the region you get a better insight into prices, sales strategy and expected yield; the top 10 in Hoogland provides a useful starting point.
Yes, when making a sales plan, a valuation in Hoogland is wise. You gain insight into a realistic asking price and can then compare offers from real estate agents specifically.
View current location data on residents, WOZ development, housing stock, energy consumption, business activity and safety in Hoogland. In 2025 were there 10.125 residents. The average WOZ value in 2025 is EUR 487.520.
These figures help to better assess and compare the housing stock in Hoogland with recent sold homes. Orient yourself then on suitable top real estate agents in Hoogland for sales advice in this region.
Residents
10.125
Last year: 2025
Average WOZ
EUR 487.520
Last year: 2025
Average income per person.
EUR 35.598
Source: AllNumbers
Crimes (current year)
239
Total registered
| Year | Residents |
|---|---|
| 2021 | 10.305 |
| 2022 | 10.245 |
| 2023 | 10.180 |
| 2024 | 10.140 |
| 2025 | 10.125 |
| Year | Average WOZ |
|---|---|
| 2021 | EUR 365.923 |
| 2022 | EUR 404.109 |
| 2023 | EUR 471.727 |
| 2024 | EUR 465.173 |
| 2025 | EUR 487.520 |
Hoger
2.770
Praktisch
1.490
Middelbaar
3.140
Europa
455
Nederland
8.755
Buiten Europa
915
Label C
1.919
Label B
921
Label A
669
Label D
449
Label E
152
Label F
135
Label G
119
Label A+
48
Label A+++
19
Label A++
15
Label A++++
9
Label A+++++
0
| Year | Gas (m3) | Electricity (kWh) |
|---|---|---|
| 2020 | 1.222 | 3.078 |
| 2021 | 1.393 | 3.169 |
| 2022 | 1.084 | 2.925 |
| 2023 | 906 | 2.739 |
| 2024 | 877 | 2.800 |
Hoekwoning
Gas: 938 • Electricity: 2.709
Huurwoning
Gas: 721 • Electricity: 1.995
Koopwoning
Gas: 955 • Electricity: 2.907
Appartement
Gas: 621 • Electricity: 1.929
Tussenwoning
Gas: 814 • Electricity: 2.460
Vrijstaande woning
Gas: 1.405 • Electricity: 4.142
Twee-onder-één-kap woning
Gas: 1.153 • Electricity: 3.206
Total number of company establishments: 1.370
| Period | Crimes |
|---|---|
| jan 2025 | 12 |
| jan 2026 | 21 |
| jul 2025 | 20 |
| jun 2025 | 15 |
| mei 2025 | 15 |
| mrt 2025 | 20 |
| nov 2024 | 20 |
| nov 2025 | 17 |
| okt 2024 | 17 |
| okt 2025 | 24 |
| sep 2024 | 7 |
| sep 2025 | 29 |
These figures give an indicative picture of safety trends in the living environment of Hoogland.
Short answers based on current local statistics, handy for a quick comparison of the living environment.
Hoogland telt in 2025 ongeveer 10.125 inwoners.
De gemiddelde WOZ-waarde in Hoogland is in 2025 circa € 487.520.
Het gemiddelde inkomen per inwoner in Hoogland ligt rond € 35.598 per jaar.
Voor het huidige jaar gaat het om ongeveer 239 geregistreerde misdrijven. Gebruik deze cijfers als indicatie en vergelijk trends per periode.
In Hoogland komt vooral "Tussenwoningen" veel voor, met ongeveer 2.116 woningen.