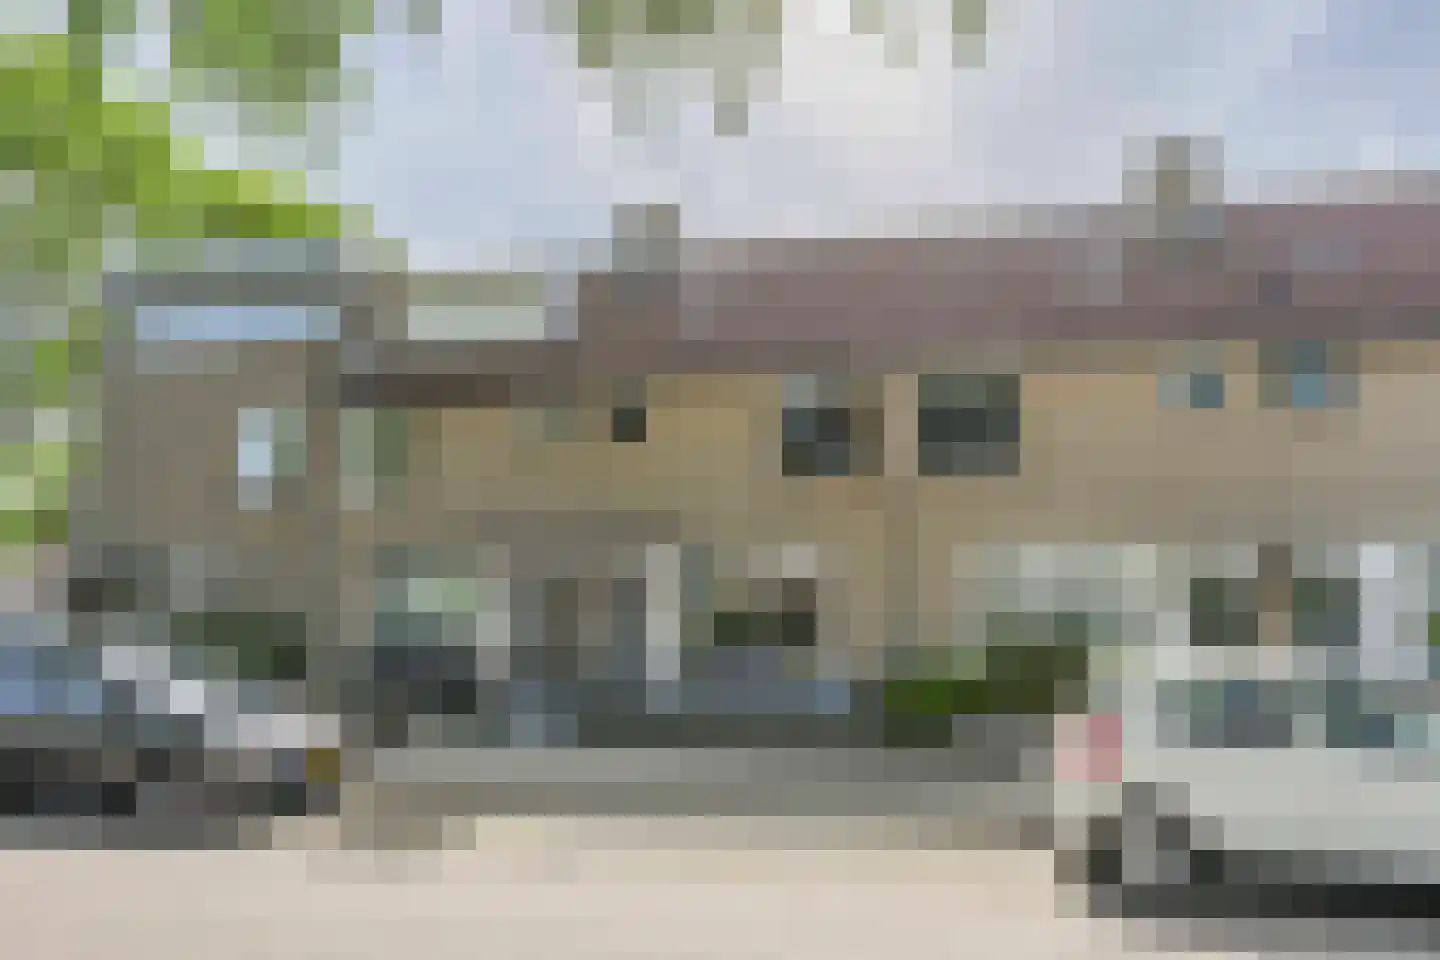
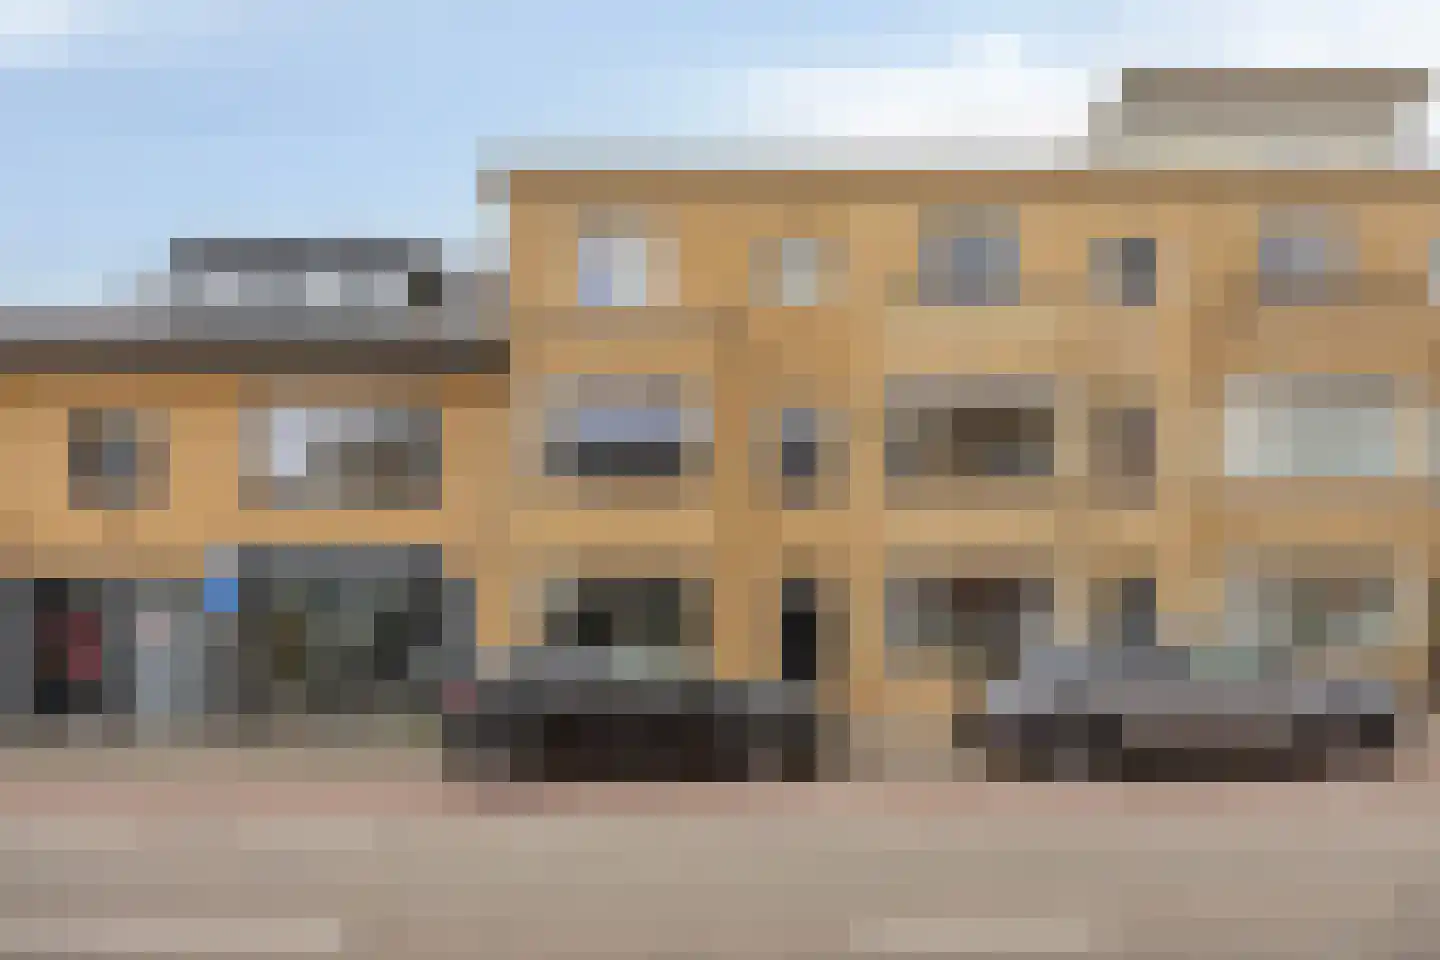
Housing offer in Katwijk

Searching in 457 houses in Katwijk

Connected to: Vastgoed Nederland NVM Makelaars

View the current housing stock in Katwijk and quickly filter by price, living area, rooms and more. There are currently 457 houses in this place within our selection. View also 349 sold houses in Katwijk for extra insight into the local housing market.

Selection

Search and filter homes

Set your preferences and discover homes that suit you.

Total supply 244.789
Filters

Set price, area and other characteristics. Adjust a filter or click on Show homes. Location changes directly above.

Reset filters

You search for

  • Place Katwijk

Selling a home in Katwijk? Compare realtor offers

Get free quotes from real estate agents with local market knowledge. Compare more than 119 real estate agents in Katwijk.

Free request a quote

  • Quotes in Katwijk
  • Non-binding
  • Personal
  • Compare free rates

Selling a home in Katwijk? View the sales-oriented guide sell a house in Katwijk, compare all real estate agents in Katwijk or view the top 10 real estate agents in Katwijk for extra context to your choice.

Compare multiple quotes

Real estate agents make sharper offers when they know you're comparing — ask for quotes for sale or purchase.

Frequently asked questions about homes in Katwijk

Practical answers about housing supply, sales and comparing real estate agents in Katwijk.

Residential and neighborhood statistics in Katwijk

View current location data on residents, WOZ development, housing stock, energy consumption, business activity and safety in Katwijk.

These figures help to better assess and compare the housing stock in Katwijk with recent sold homes. Orient yourself then on suitable top real estate agents in Katwijk for sales advice in this region.

Residents

-

No data

Average WOZ

-

No data

Average income per person.

EUR 26.784

Source: AllNumbers

Crimes (current year)

1.830

Total registered

Composition of residents

Education level

Hoog opleidingsniveau

6.240

Laag opleidingsniveau

10.380

Middelbaar opleidingsniveau

14.710

Housing stock and construction periods

Construction period of buildings

2020+ 280
<1700 4
1700-1900 117
1900-1925 1.069
1925-1950 2.103
1950-1970 6.071
1970-1980 2.420
1980-1990 2.977
1990-2000 1.801
2000-2010 1.832
2010-2020 1.369

Energy and sustainability

Energy label distribution

Label C

5.794

Label A

3.469

Label B

2.844

Label E

2.558

Label G

1.431

Label D

1.303

Label F

1.241

Label A+++

186

Label A++++

39

Label A+

32

Label A++

19

Label A+++++

1

Recent crime statistics

Recent crime statistics in Katwijk
Period Crimes
jan 2023 119
jul 2022 163
jul 2023 129
jun 2022 170
jun 2023 161
mei 2022 171
mei 2023 156
mrt 2022 120
mrt 2023 131
nov 2022 171
okt 2022 177
sep 2022 171

These figures give an indicative picture of safety trends in the living environment of Katwijk.

Frequently asked questions about living in Katwijk

Short answers based on current local statistics, handy for a quick comparison of the living environment.

Wat is het gemiddelde inkomen per inwoner in Katwijk?

Het gemiddelde inkomen per inwoner in Katwijk ligt rond € 26.784 per jaar.

Hoe veilig is wonen in Katwijk?

Voor het huidige jaar gaat het om ongeveer 1.830 geregistreerde misdrijven. Gebruik deze cijfers als indicatie en vergelijk trends per periode.

Receive free, non-binding quotes

Compare multiple real estate agents and choose the best match.