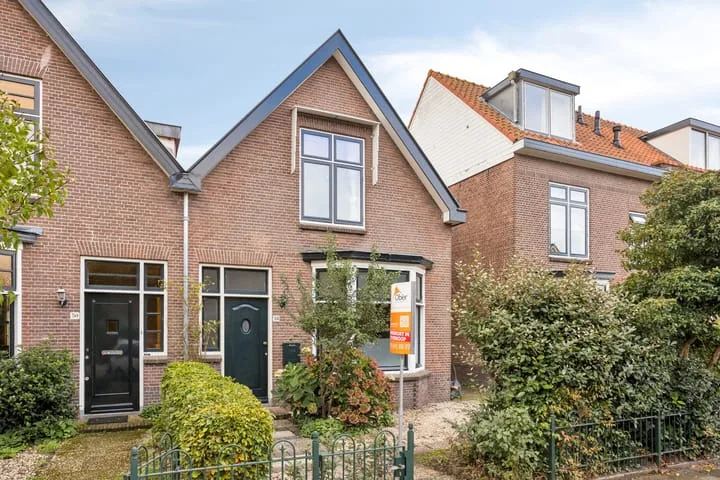
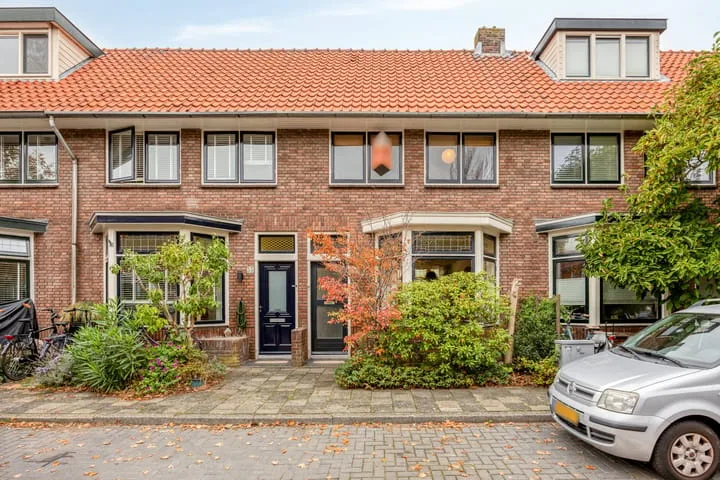
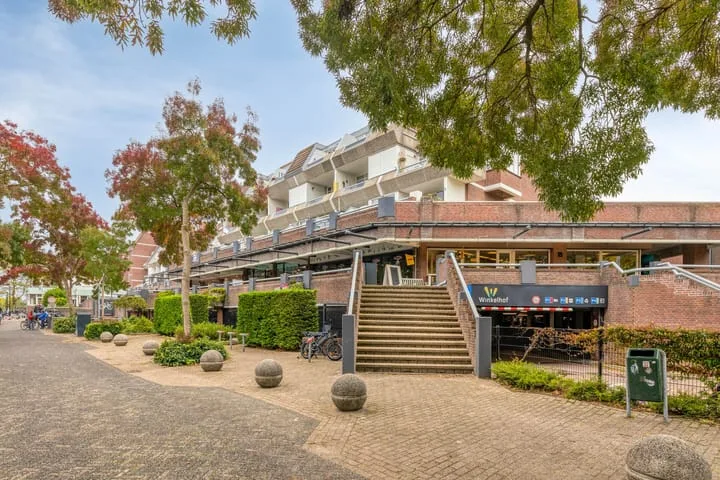
- Sold
Heinsiuslaan 10
2353TJ Leiderdorp
€ 550.000 k.k.
€ 4.583/m²
- Living area
- 120 m²
- Land area
- 148 m²
- Bedrooms
- 3
Searching in 358 houses in Leiderdorp
Type to search. Use arrow down and arrow up to navigate through results and press Enter to open.
Hidden search suggestions.
View current properties in Leiderdorp or search targeted on street, postal code and property characteristics.
View the current housing stock in Leiderdorp and quickly filter by price, living area, rooms and more. There are currently 358 houses in this place within our selection. View also 251 sold houses in Leiderdorp for extra insight into the local housing market.
2353TJ Leiderdorp
€ 550.000 k.k.
€ 4.583/m²
2353NS Leiderdorp
€ 1.000.000 k.k.
€ 4.115/m²
2351GG Leiderdorp
€ 589.000 k.k.
€ 4.177/m²
2353SG Leiderdorp
€ 535.000 k.k.
€ 4.385/m²
2353KP Leiderdorp
€ 550.000 k.k.
€ 4.700/m²
2353NR Leiderdorp
€ 625.000 k.k.
€ 3.324/m²
2353TH Leiderdorp
€ 298.000 k.k.
€ 5.137/m²
2352KC Leiderdorp
€ 245.000 k.k.
€ 5.697/m²
2352CD Leiderdorp
€ 400.000 k.k.
€ 4.347/m²
2353MS Leiderdorp
€ 948.000 k.k.
€ 5.852/m²
2352XG Leiderdorp
€ 495.000 k.k.
€ 4.852/m²
2353MN Leiderdorp
€ 600.000 k.k.
€ 5.217/m²
2352CV Leiderdorp
€ 375.000 k.k.
€ 4.464/m²
2351CT Leiderdorp
€ 595.000 k.k.
€ 5.833/m²
2351PE Leiderdorp
€ 450.000 k.k.
€ 5.555/m²
2352BR Leiderdorp
€ 375.000 k.k.
€ 5.000/m²
2351NT Leiderdorp
€ 595.000 k.k.
€ 5.666/m²
2351CR Leiderdorp
€ 1.399.000 k.k.
€ 6.330/m²
2352RN Leiderdorp
€ 585.000 k.k.
€ 5.416/m²
2353BT Leiderdorp
€ 599.000 k.k.
€ 3.864/m²
2352VE Leiderdorp
€ 375.000 k.k.
€ 4.120/m²
2352VJ Leiderdorp
€ 319.000 k.k.
€ 3.467/m²
2351AV Leiderdorp
Price upon request
2353TG Leiderdorp
Price upon request
2351CT Leiderdorp
€ 598.000 k.k.
€ 4.635/m²
2353EB Leiderdorp
€ 575.000 k.k.
€ 4.713/m²
2352CD Leiderdorp
€ 405.000 k.k.
€ 4.450/m²
2353TC Leiderdorp
€ 299.000 k.k.
€ 4.822/m²
Get free quotes from real estate agents with local market knowledge. Compare more than 131 real estate agents in Leiderdorp.
Selling a home in Leiderdorp? View the sales-oriented guide sell a house in Leiderdorp, compare all real estate agents in Leiderdorp or view the top 10 real estate agents in Leiderdorp for extra context to your choice.
Real estate agents make sharper offers when they know you're comparing — ask for quotes for sale or purchase.
Practical answers about housing supply, sales and comparing real estate agents in Leiderdorp.
The costs of a real estate agent in Leiderdorp depend on commission, setup costs, property presentation and the chosen service. Compare the 131 real estate agents in Leiderdorp via the real estate agent page and request multiple quotes to compare rates and approach well.
Within our selection, we are currently showing 358 houses in Leiderdorp. View also the sold houses in Leiderdorp to compare the current offering with recent transactions.
Take into account not only price and living area but also maintenance, energy label, location, outdoor space and sales status. This way you compare houses in Leiderdorp on more than just the asking price.
A local real estate agent knows the neighborhoods, recent transactions and demand in Leiderdorp. By comparing 131 real estate agents in the region you get a better insight into prices, sales strategy and expected yield; the top 10 in Leiderdorp provides a useful starting point.
Yes, when making a sales plan, a valuation in Leiderdorp is wise. You gain insight into a realistic asking price and can then compare offers from real estate agents specifically.
View current location data on residents, WOZ development, housing stock, energy consumption, business activity and safety in Leiderdorp. In 2026 were there 27.946 residents. The average WOZ value in 2025 is EUR 450.000.
These figures help to better assess and compare the housing stock in Leiderdorp with recent sold homes. Orient yourself then on suitable top real estate agents in Leiderdorp for sales advice in this region.
Residents
27.946
Last year: 2026
Average WOZ
EUR 450.000
Last year: 2025
Average income per person.
EUR 37.800
Source: AllNumbers
Crimes (current year)
894
Total registered
| Year | Residents |
|---|---|
| 2022 | 27.464 |
| 2023 | 27.657 |
| 2024 | 27.736 |
| 2025 | 27.751 |
| 2026 | 27.946 |
| Year | Average WOZ |
|---|---|
| 2021 | EUR 334.000 |
| 2022 | EUR 361.000 |
| 2023 | EUR 412.000 |
| 2024 | EUR 423.000 |
| 2025 | EUR 450.000 |
Hoger
42
Praktisch
21
Middelbaar
37
Europa
2.167
Nederland
20.394
Buiten Europa
5.190
Label C
3.838
Label A
3.051
Label B
2.267
Label E
1.166
Label D
1.084
Label F
599
Label A+
457
Label G
323
Label A++
297
Label A+++
197
Label A++++
3
Label A+++++
3
| Year | Gas (m3) | Electricity (kWh) |
|---|---|---|
| 2020 | 1.020 | 2.790 |
| 2021 | 1.120 | 2.790 |
| 2022 | 870 | 2.570 |
| 2023 | 740 | 2.370 |
| 2024 | 730 | 2.390 |
Hoekwoning
Gas: 1.070 • Electricity: 2.730
Huurwoning
Gas: 530 • Electricity: 1.850
Koopwoning
Gas: 850 • Electricity: 2.670
Appartement
Gas: 440 • Electricity: 1.890
Tussenwoning
Gas: 860 • Electricity: 2.560
Vrijstaande woning
Gas: 1.500 • Electricity: 4.390
Twee-onder-één-kap woning
Gas: 1.260 • Electricity: 3.600
Total number of company establishments: 3.435
| Period | Crimes |
|---|---|
| jan 2025 | 78 |
| jan 2026 | 67 |
| jul 2025 | 67 |
| jun 2025 | 70 |
| mei 2025 | 74 |
| mrt 2025 | 64 |
| nov 2024 | 72 |
| nov 2025 | 70 |
| okt 2024 | 52 |
| okt 2025 | 70 |
| sep 2024 | 80 |
| sep 2025 | 100 |
These figures give an indicative picture of safety trends in the living environment of Leiderdorp.
Short answers based on current local statistics, handy for a quick comparison of the living environment.
Leiderdorp telt in 2026 ongeveer 27.946 inwoners.
De gemiddelde WOZ-waarde in Leiderdorp is in 2025 circa € 450.000.
Het gemiddelde inkomen per inwoner in Leiderdorp ligt rond € 37.800 per jaar.
Voor het huidige jaar gaat het om ongeveer 894 geregistreerde misdrijven. Gebruik deze cijfers als indicatie en vergelijk trends per periode.
In Leiderdorp komt vooral "Appartementen" veel voor, met ongeveer 5.453 woningen.