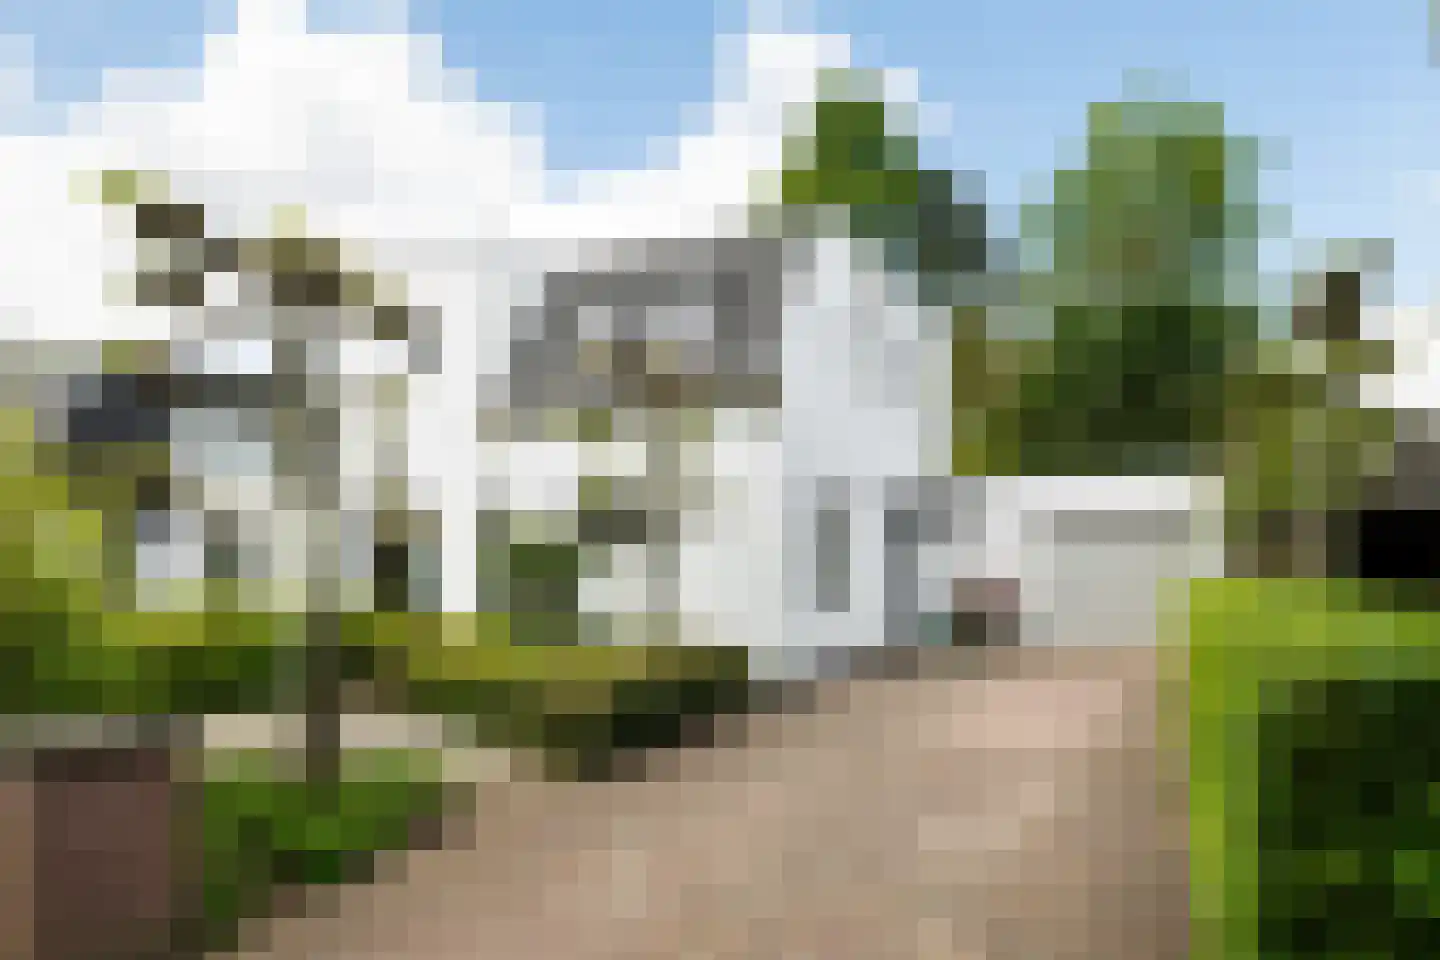
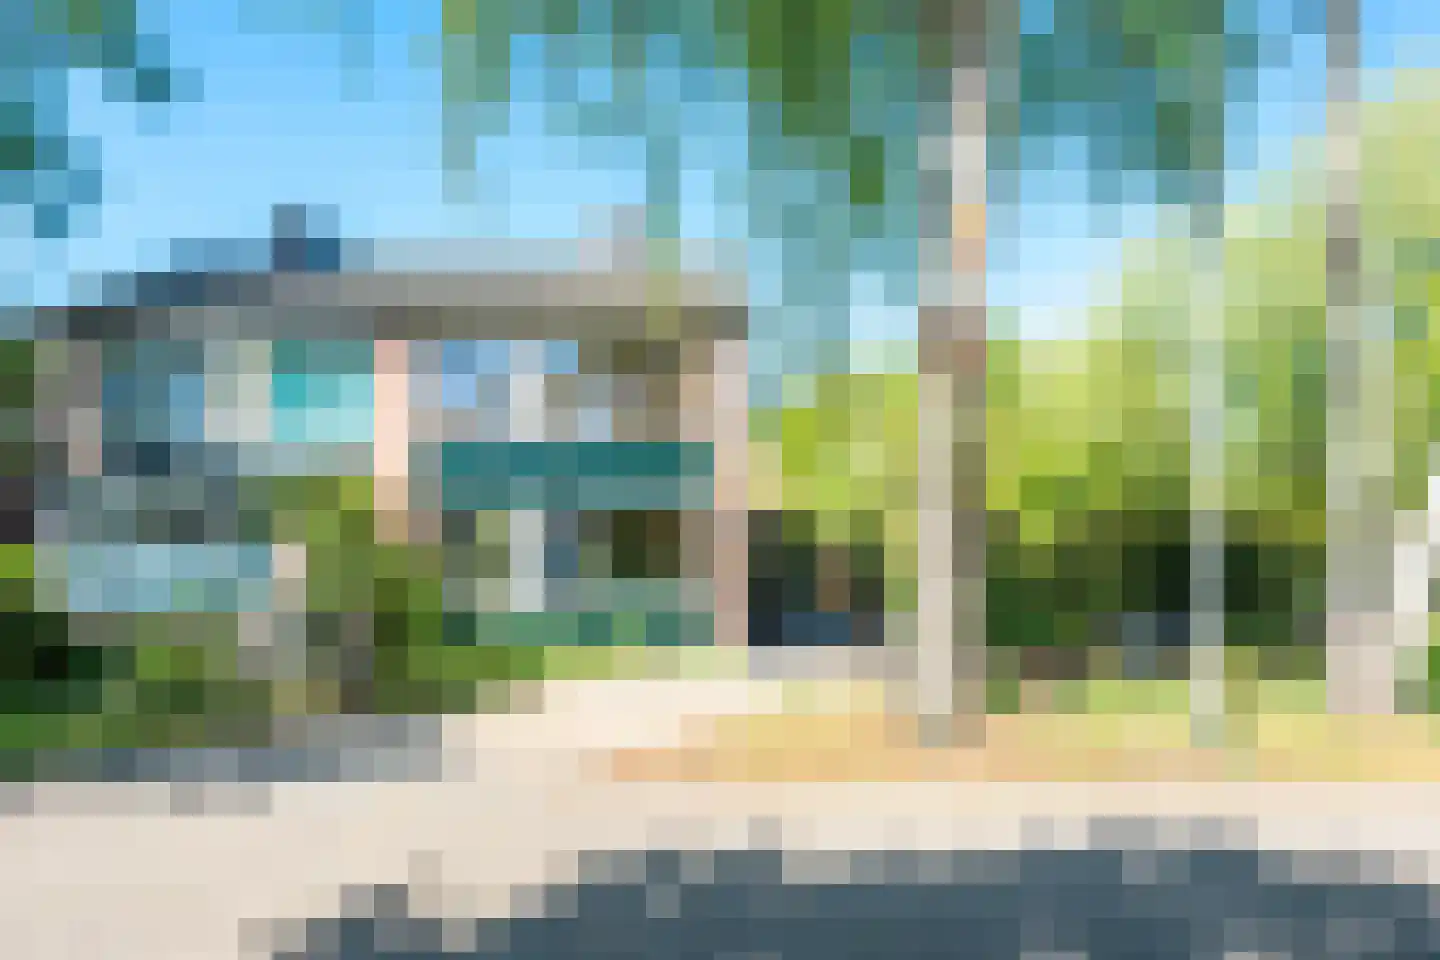
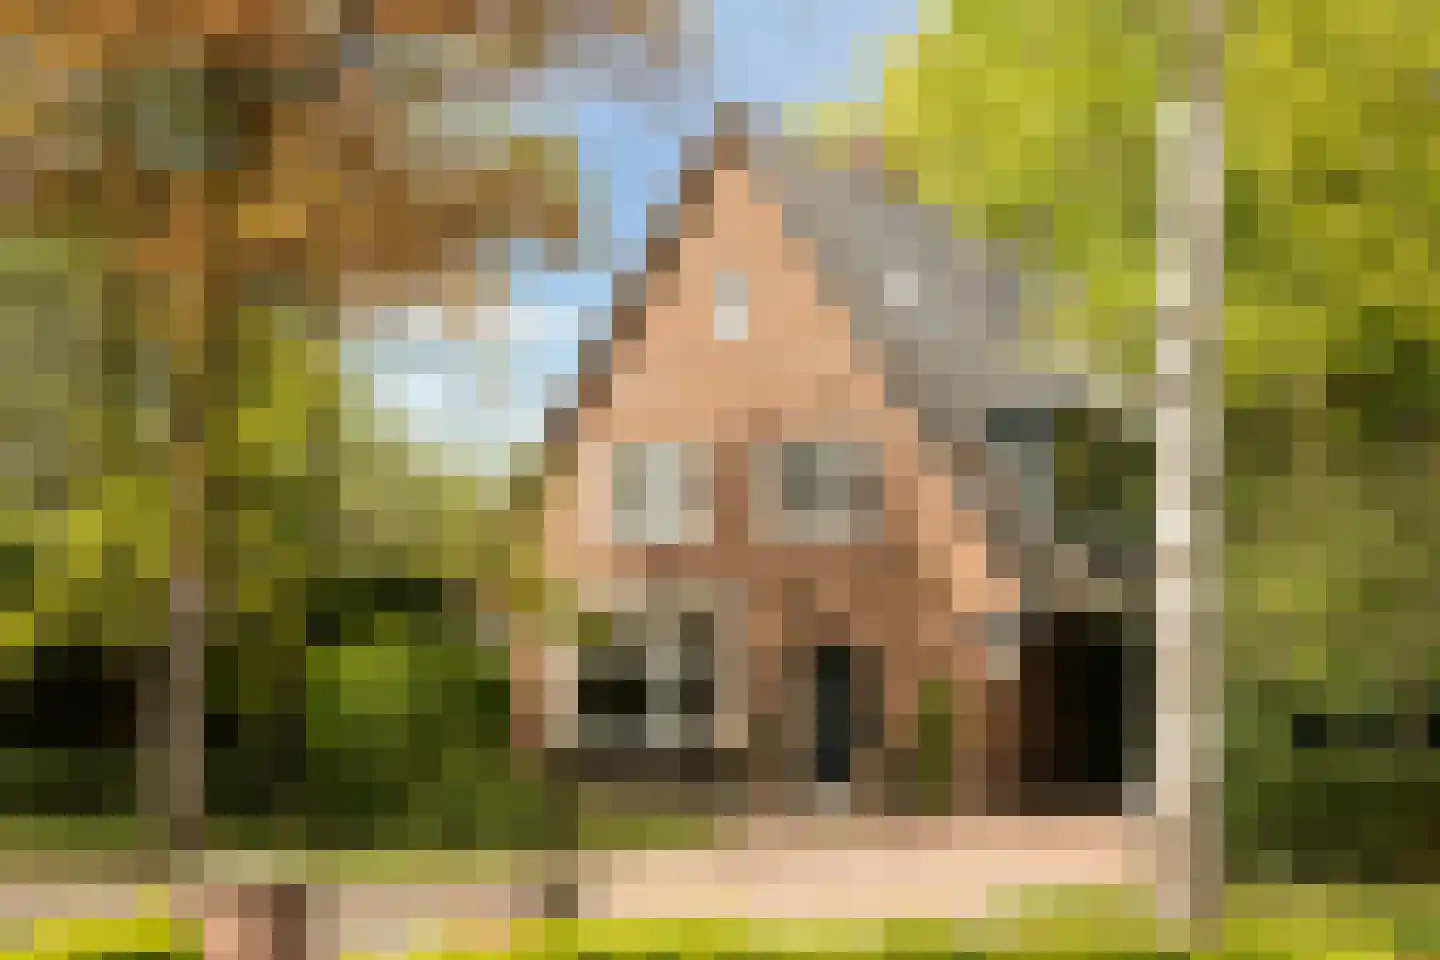
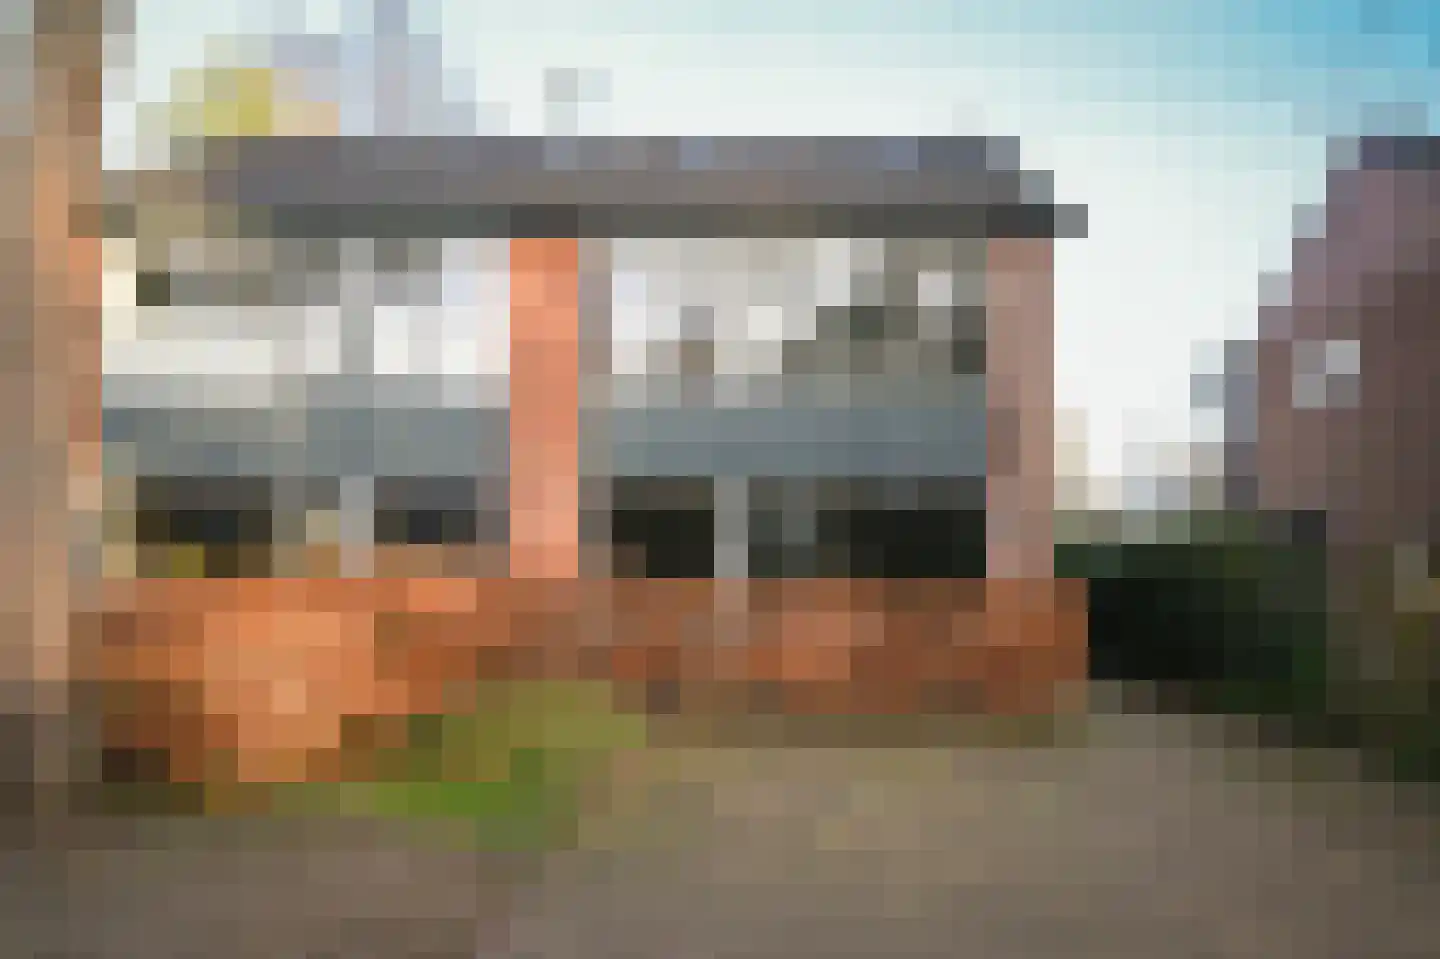
- Available
Haarweg 3
3953BG Maarsbergen
€ 665.000 k.k.
€ 5.000/m²
- Living area
- 133 m²
- Land area
- 451 m²
- Bedrooms
- 3
Searching in 21 houses in Maarsbergen
Type to search. Use arrow down and arrow up to navigate through results and press Enter to open.
Hidden search suggestions.
View current properties in Maarsbergen or search targeted on street, postal code and property characteristics.
View the current housing stock in Maarsbergen and quickly filter by price, living area, rooms and more. There are currently 21 houses in this place within our selection. View also 15 sold houses in Maarsbergen for extra insight into the local housing market.
3953BG Maarsbergen
€ 665.000 k.k.
€ 5.000/m²
3953BP Maarsbergen
€ 639.500 k.k.
€ 5.466/m²
3953LX Maarsbergen
€ 1.295.000 k.k.
€ 7.194/m²
3953BL Maarsbergen
€ 650.000 k.k.
€ 4.779/m²
3953BS Maarsbergen
€ 925.000 k.k.
3953BP Maarsbergen
€ 1.275.000 k.k.
3953BL Maarsbergen
€ 650.000 k.k.
€ 5.603/m²
3953MG Maarsbergen
€ 1.185.000 k.k.
€ 5.290/m²
3953MH Maarsbergen
€ 259.000 k.k.
€ 5.285/m²
3953CH Maarsbergen
€ 469.000 k.k.
€ 4.989/m²
3953ML Maarsbergen
€ 1.200.000 k.k.
€ 7.595/m²
3953MC Maarsbergen
€ 489.500 k.k.
€ 3.794/m²
3953CH Maarsbergen
€ 935.000 k.k.
€ 4.819/m²
3953BG Maarsbergen
€ 1.250.000 k.k.
€ 6.377/m²
3953MH Maarsbergen
€ 349.000 k.k.
€ 4.256/m²
3953CB Maarsbergen
€ 998.000 k.k.
€ 5.836/m²
3953BH Maarsbergen
€ 1.200.000 k.k.
€ 6.557/m²
3953MC Maarsbergen
€ 625.000 k.k.
€ 3.698/m²
3953CH Maarsbergen
€ 689.500 k.k.
€ 6.048/m²
3953MJ Maarsbergen
€ 689.500 k.k.
€ 6.211/m²
3953ML Maarsbergen
€ 1.550.000 k.k.
€ 6.431/m²
Get free quotes from real estate agents with local market knowledge. Compare more than 49 real estate agents in Maarsbergen.
Selling a home in Maarsbergen? Compare all real estate agents in Maarsbergen or view the top 10 real estate agents in Maarsbergen for extra context for your choice.
Real estate agents make sharper offers when they know you're comparing — ask for quotes for sale or purchase.
Practical answers about housing supply, sales and comparing real estate agents in Maarsbergen.
The costs of a real estate agent in Maarsbergen depend on commission, setup costs, property presentation and the chosen service. Compare the 49 real estate agents in Maarsbergen via the real estate agent page and request multiple quotes to compare rates and approach well.
Within our selection, we are currently showing 21 houses in Maarsbergen. View also the sold houses in Maarsbergen to compare the current offering with recent transactions.
Take into account not only price and living area but also maintenance, energy label, location, outdoor space and sales status. This way you compare houses in Maarsbergen on more than just the asking price.
A local real estate agent knows the neighborhoods, recent transactions and demand in Maarsbergen. By comparing 49 real estate agents in the region you get a better insight into prices, sales strategy and expected yield; the top 10 in Maarsbergen provides a useful starting point.
Yes, when making a sales plan, a valuation in Maarsbergen is wise. You gain insight into a realistic asking price and can then compare offers from real estate agents specifically.
View current location data on residents, WOZ development, housing stock, energy consumption, business activity and safety in Maarsbergen. In 2025 were there 1.464 residents. The average WOZ value in 2025 is EUR 525.519.
These figures help to better assess and compare the housing stock in Maarsbergen with recent sold homes. Orient yourself then on suitable top real estate agents in Maarsbergen for sales advice in this region.
Residents
1.464
Last year: 2025
Average WOZ
EUR 525.519
Last year: 2025
Average income per person.
EUR 39.197
Source: AllNumbers
Crimes (current year)
79
Total registered
| Year | Residents |
|---|---|
| 2021 | 1.319 |
| 2022 | 1.361 |
| 2023 | 1.424 |
| 2024 | 1.436 |
| 2025 | 1.464 |
| Year | Average WOZ |
|---|---|
| 2021 | EUR 383.091 |
| 2022 | EUR 399.319 |
| 2023 | EUR 474.698 |
| 2024 | EUR 566.343 |
| 2025 | EUR 525.519 |
Hoger
326
Praktisch
154
Middelbaar
400
Europa
95
Nederland
1.239
Buiten Europa
129
Label A
145
Label C
123
Label F
72
Label B
66
Label G
60
Label D
46
Label A+++
29
Label E
20
Label A++
14
Label A++++
9
Label A+
5
Label A+++++
2
| Year | Gas (m3) | Electricity (kWh) |
|---|---|---|
| 2020 | 1.644 | 3.470 |
| 2021 | 1.838 | 3.714 |
| 2022 | 1.389 | 3.511 |
| 2023 | 1.129 | 3.453 |
| 2024 | 1.078 | 3.591 |
Hoekwoning
Gas: 648 • Electricity: 1.885
Huurwoning
Gas: 1.076 • Electricity: 2.545
Koopwoning
Gas: 1.141 • Electricity: 3.743
Appartement
Gas: 779 • Electricity: 2.230
Tussenwoning
Gas: 525 • Electricity: 1.590
Vrijstaande woning
Gas: 1.292 • Electricity: 4.286
Twee-onder-één-kap woning
Gas: 1.175 • Electricity: 3.304
Total number of company establishments: 359
| Period | Crimes |
|---|---|
| jan 2026 | 6 |
| jul 2025 | 15 |
| jun 2025 | 10 |
| mei 2025 | 3 |
| mrt 2025 | 5 |
| mrt 2026 | 8 |
| nov 2024 | 6 |
| nov 2025 | 7 |
| okt 2024 | 14 |
| okt 2025 | 4 |
| sep 2024 | 6 |
| sep 2025 | 2 |
These figures give an indicative picture of safety trends in the living environment of Maarsbergen.
Short answers based on current local statistics, handy for a quick comparison of the living environment.
Maarsbergen telt in 2025 ongeveer 1.464 inwoners.
De gemiddelde WOZ-waarde in Maarsbergen is in 2025 circa € 525.519.
Het gemiddelde inkomen per inwoner in Maarsbergen ligt rond € 39.197 per jaar.
Voor het huidige jaar gaat het om ongeveer 79 geregistreerde misdrijven. Gebruik deze cijfers als indicatie en vergelijk trends per periode.
In Maarsbergen komt vooral "Vrijstaande woningen" veel voor, met ongeveer 255 woningen.