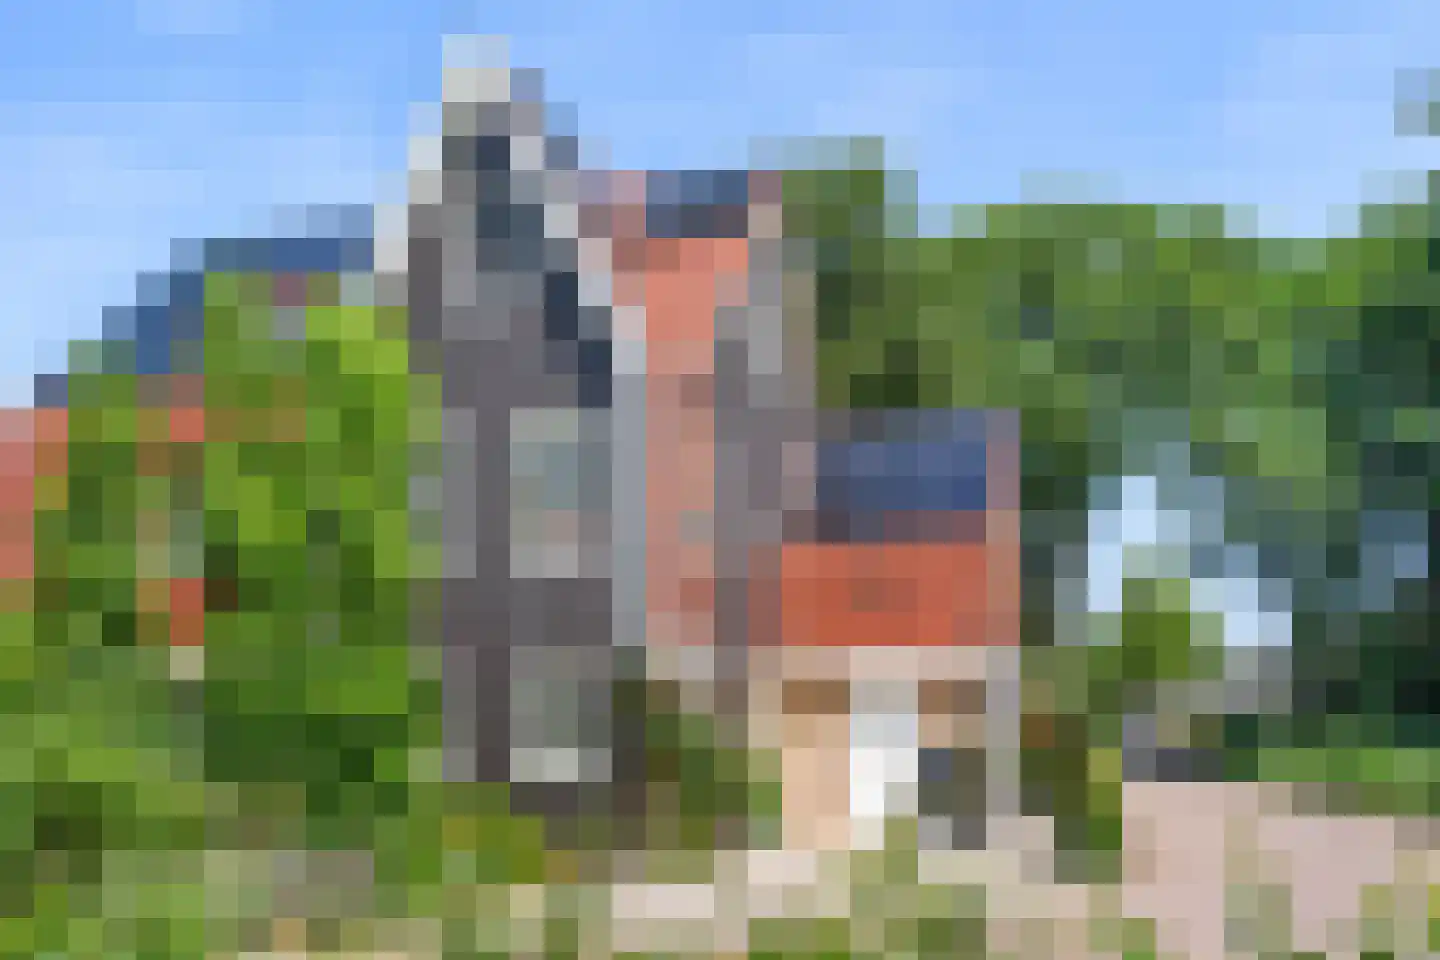
Houses sold in Otterlo

View 25 sold houses in Otterlo

Connected to: Vastgoed Nederland NVM Makelaars

On this page you will find recently sold homes in Otterlo. Use this overview to better estimate selling prices, popular neighborhoods, and the local housing supply before you choose a real estate agent. Also view the current housing supply with 78 houses in Otterlo.

Selection

Search and filter homes

Set your preferences and discover homes that suit you.

Total supply 242.868
Filters

Set price, area and other characteristics. Adjust a filter or click on Show homes. Location changes directly above.

Reset filters

You search for

  • Place Otterlo
  • Status Sold

Sell your house in Otterlo? Compare real estate agents

View recent sales and receive free quotes from local real estate agents. Compare more than 18 real estate agents in Otterlo.

Free request a quote

  • Quotes in Otterlo
  • Non-binding
  • Personal
  • Compare free rates

Selling your own home in Otterlo? Compare real estate agents in Otterlo or view the best real estate agents in Otterlo as a reference for your choice.

Compare multiple quotes

Real estate agents make sharper offers when they know you're comparing — ask for quotes for sale or purchase.

Frequently asked questions about sold homes in Otterlo

Short answers about housing prices, sold homes and comparing real estate agents in Otterlo.

Residential and neighborhood statistics in Otterlo

View current location data on residents, WOZ development, housing stock, energy consumption, business activity and safety in Otterlo. In 2026 were there 2.428 residents. The average WOZ value in 2025 is EUR 503.000.

These figures help to better assess and compare the housing stock in Otterlo with recent sold homes. Orient yourself then on suitable top real estate agents in Otterlo for sales advice in this region.

Residents

2.428

Last year: 2026

Average WOZ

EUR 503.000

Last year: 2025

Average income per person.

EUR 34.200

Source: AllNumbers

Crimes (current year)

67

Total registered

Demographics and WOZ development

Inhabitants per year

Inhabitants per year in Otterlo
Year Residents
2021 2.310
2022 2.260
2023 2.260
2024 2.280
2025 2.380
2026 2.428

Annual WOZ value

WOZ value per year in Otterlo
Year Average WOZ
2021 EUR 364.000
2022 EUR 388.000
2023 EUR 441.000
2024 EUR 472.000
2025 EUR 503.000

Composition of residents

Age build-up

65+: 530 0-15: 355 15-25: 290 25-45: 565 45-65: 690

Education level

Hoger

360

Praktisch

490

Middelbaar

910

Origin of residents (2025)

Europa

70

Nederland

2.085

Buiten Europa

230

Housing stock and construction periods

Types of homes

Hoekwoningen 113
Appartementen 257
Tussenwoningen 179
Vrijstaande woningen 443
Twee-onder-één-kap woningen 111

Construction period of buildings

Voor 1700 2
1700 tot 1900 18
1900 tot 1925 38
1925 tot 1950 141
1950 tot 1970 242
1970 tot 1980 170
1980 tot 1990 160
1990 tot 2000 154
2000 tot 2010 199
2010 tot 2020 659
2020 en later 255

Energy and sustainability

Energy label distribution

Label A

280

Label C

275

Label B

270

Label D

135

Label F

106

Label G

100

Label E

57

Label A+

21

Label A+++

9

Label A++

6

Label A++++

3

Label A+++++

0

Average energy consumption per year

Average energy consumption per year in Otterlo
Year Gas (m3) Electricity (kWh)
2020 1.650 3.640
2021 1.920 3.790
2022 1.530 3.510
2023 1.270 3.340
2024 1.200 3.380

Consumption per house type

Hoekwoning

Gas: 1.020 • Electricity: 2.660

Huurwoning

Gas: 1.010 • Electricity: 2.260

Koopwoning

Gas: 1.340 • Electricity: 3.630

Appartement

Gas: 1.060 • Electricity: 2.230

Tussenwoning

Gas: 890 • Electricity: 2.500

Vrijstaande woning

Gas: 1.520 • Electricity: 4.100

Twee-onder-één-kap woning

Gas: 1.250 • Electricity: 3.300

Business activity in Otterlo (2025)

Handel en HORECA 90
Nijverheid en energie 80
Zakelijke dienstverlening 110
Overheid, onderwijs en zorg 50
Landbouw, bosbouw en visserij 50
Vervoer, informatie en communicatie 25
Financiele diensten en onroerendgoed 25
Cultuur, recreatie en overige diensten 40

Total number of company establishments: 475

Recent crime statistics

Recent crime statistics in Otterlo
Period Crimes
jan 2026 1
jul 2025 7
jun 2025 3
mei 2025 6
mrt 2025 5
mrt 2026 3
nov 2024 18
nov 2025 5
okt 2024 13
okt 2025 9
sep 2024 6
sep 2025 6

These figures give an indicative picture of safety trends in the living environment of Otterlo.

Frequently asked questions about living in Otterlo

Short answers based on current local statistics, handy for a quick comparison of the living environment.

Hoeveel inwoners heeft Otterlo?

Otterlo telt in 2026 ongeveer 2.428 inwoners.

Wat is de gemiddelde WOZ-waarde in Otterlo?

De gemiddelde WOZ-waarde in Otterlo is in 2025 circa € 503.000.

Wat is het gemiddelde inkomen per inwoner in Otterlo?

Het gemiddelde inkomen per inwoner in Otterlo ligt rond € 34.200 per jaar.

Hoe veilig is wonen in Otterlo?

Voor het huidige jaar gaat het om ongeveer 67 geregistreerde misdrijven. Gebruik deze cijfers als indicatie en vergelijk trends per periode.

Welke woningtypen komen het meest voor in Otterlo?

In Otterlo komt vooral "Vrijstaande woningen" veel voor, met ongeveer 443 woningen.

Receive free, non-binding quotes

Compare multiple real estate agents and choose the best match.