- Available
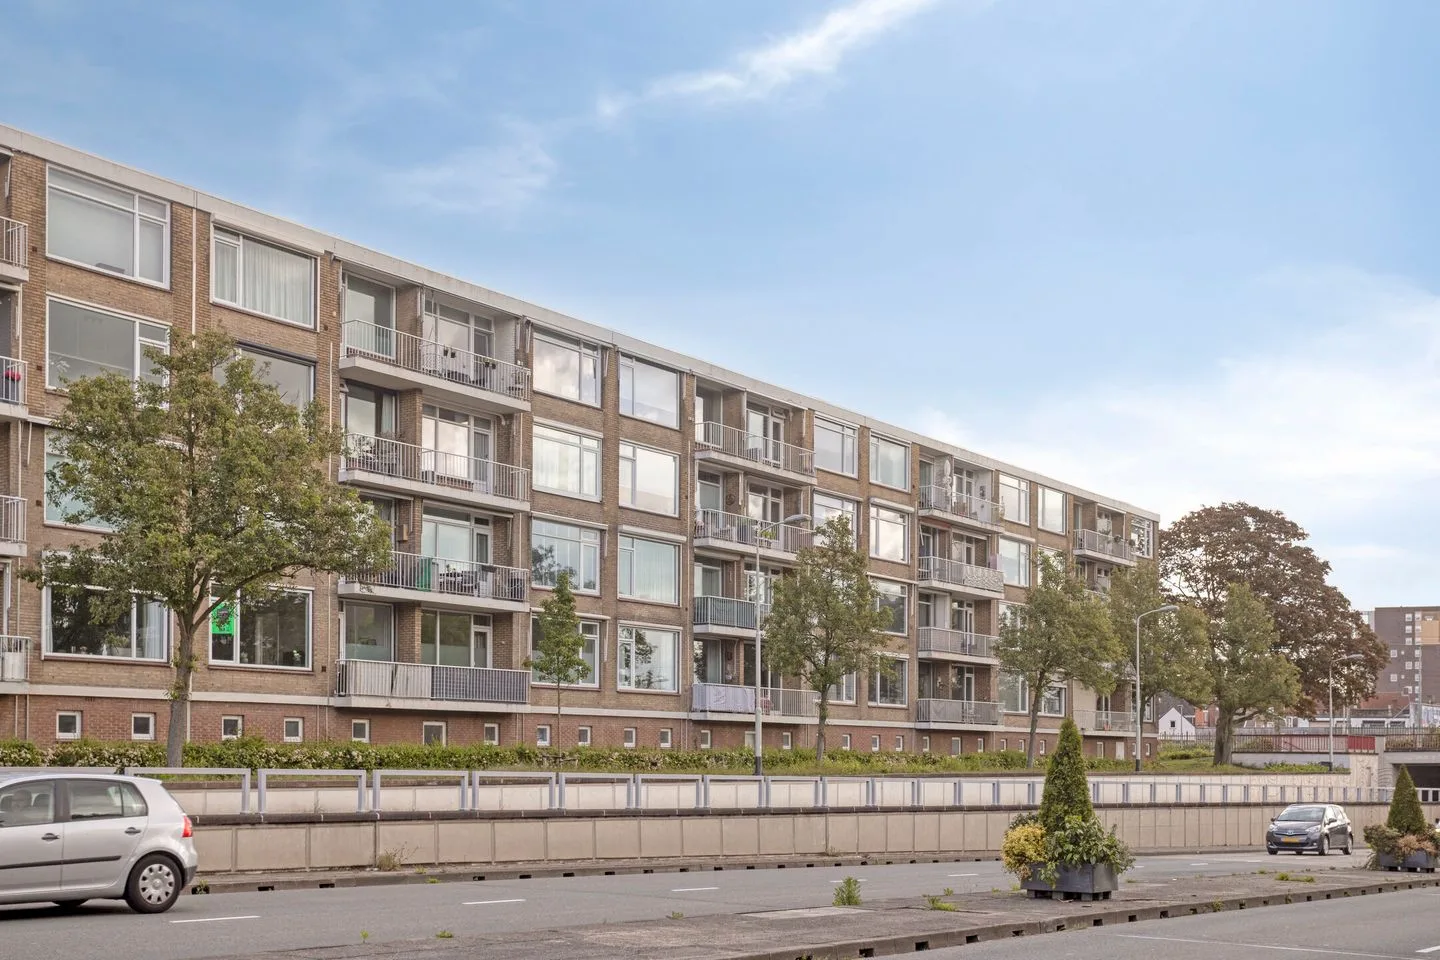
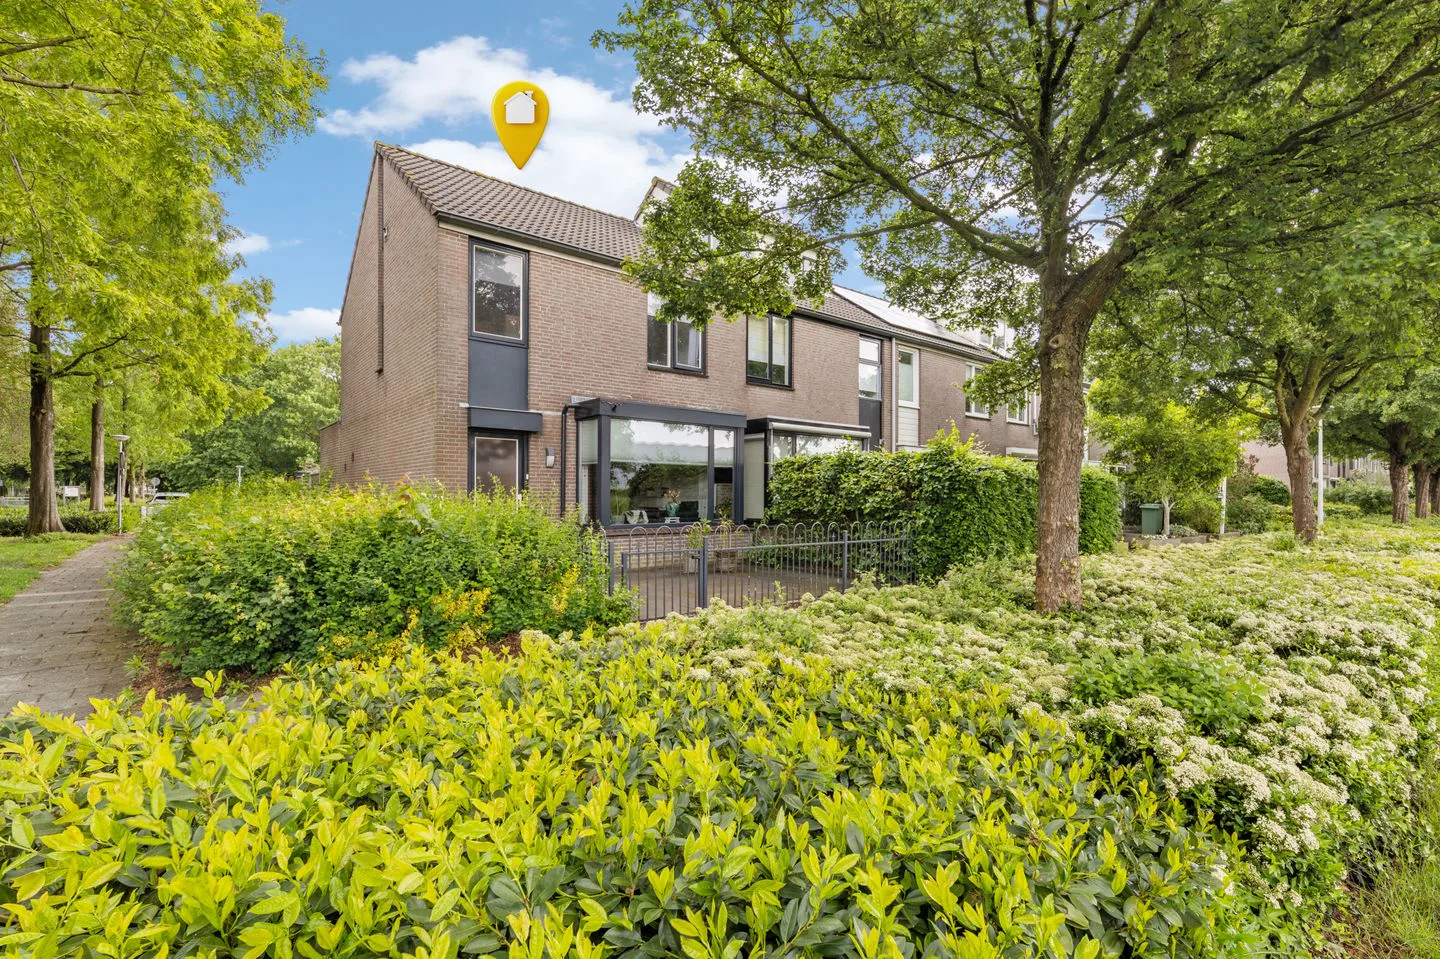
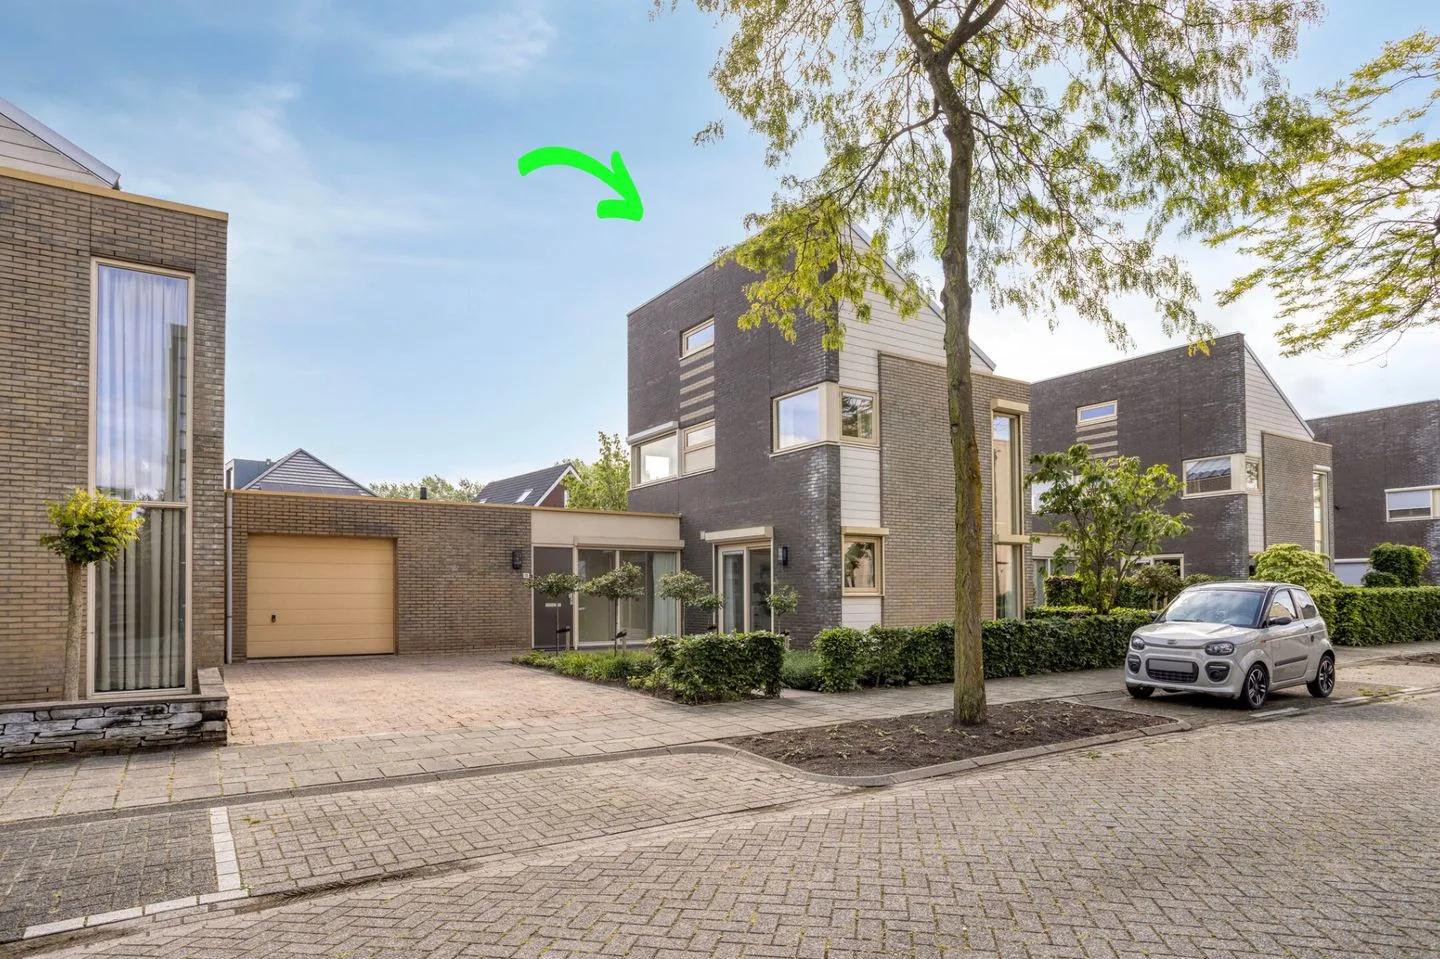
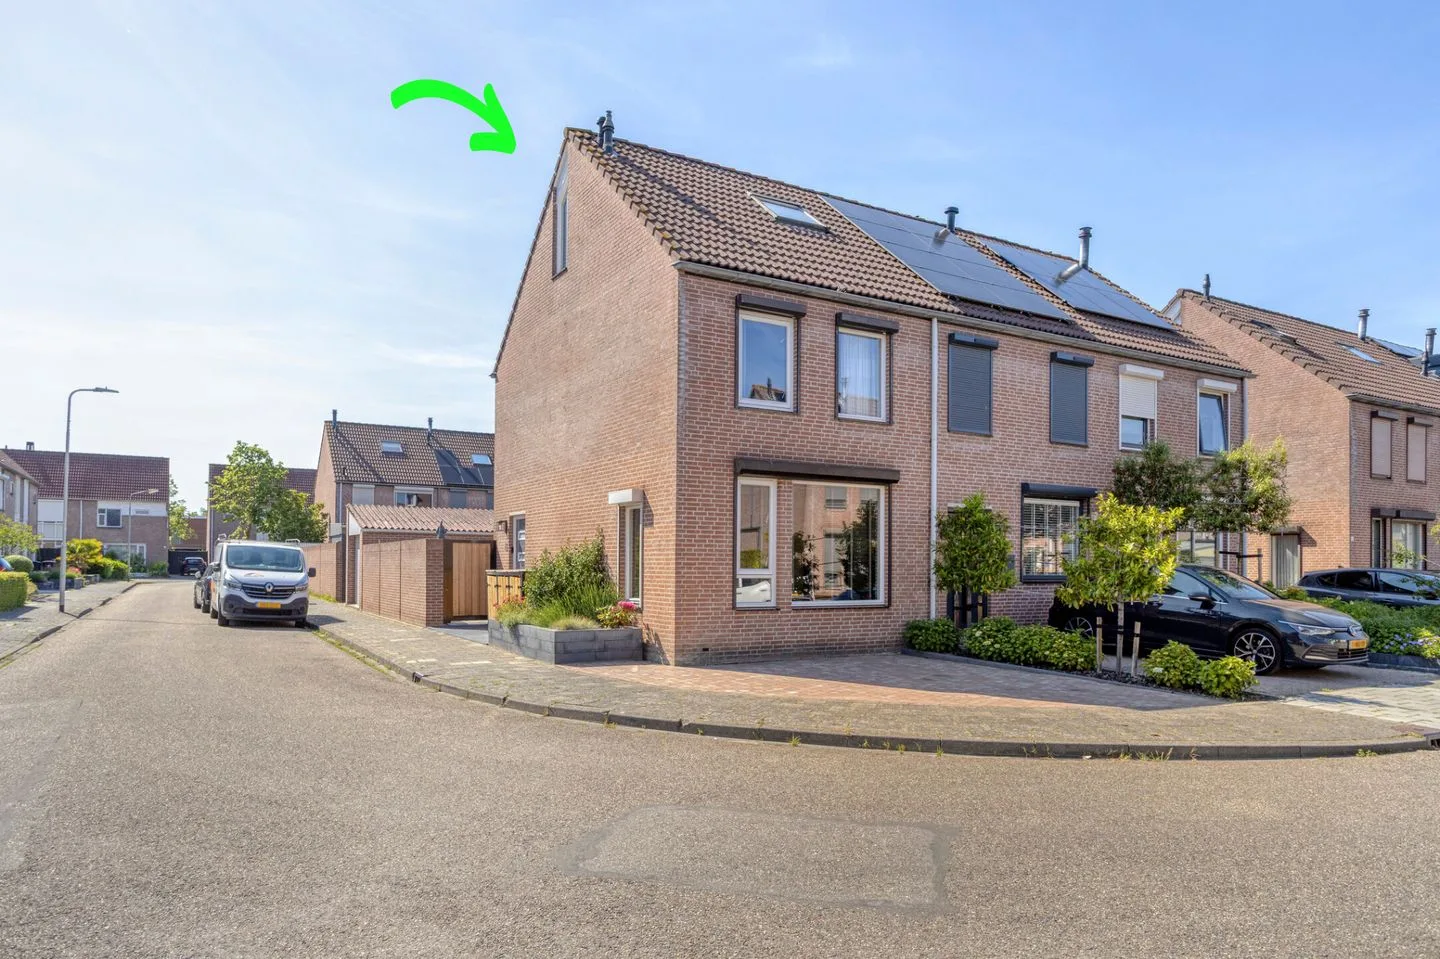
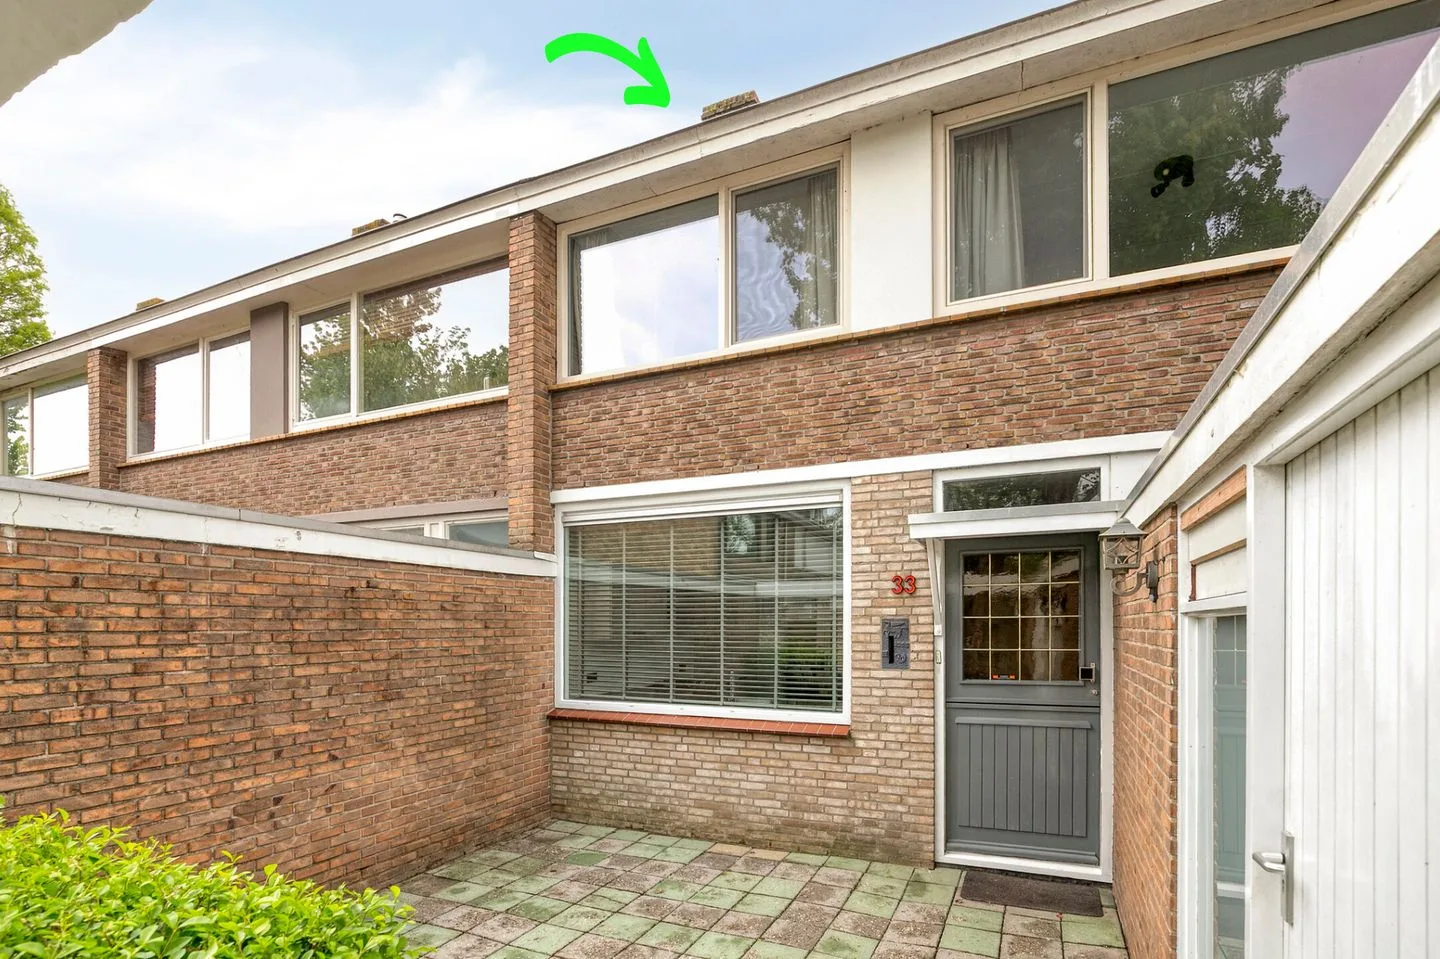
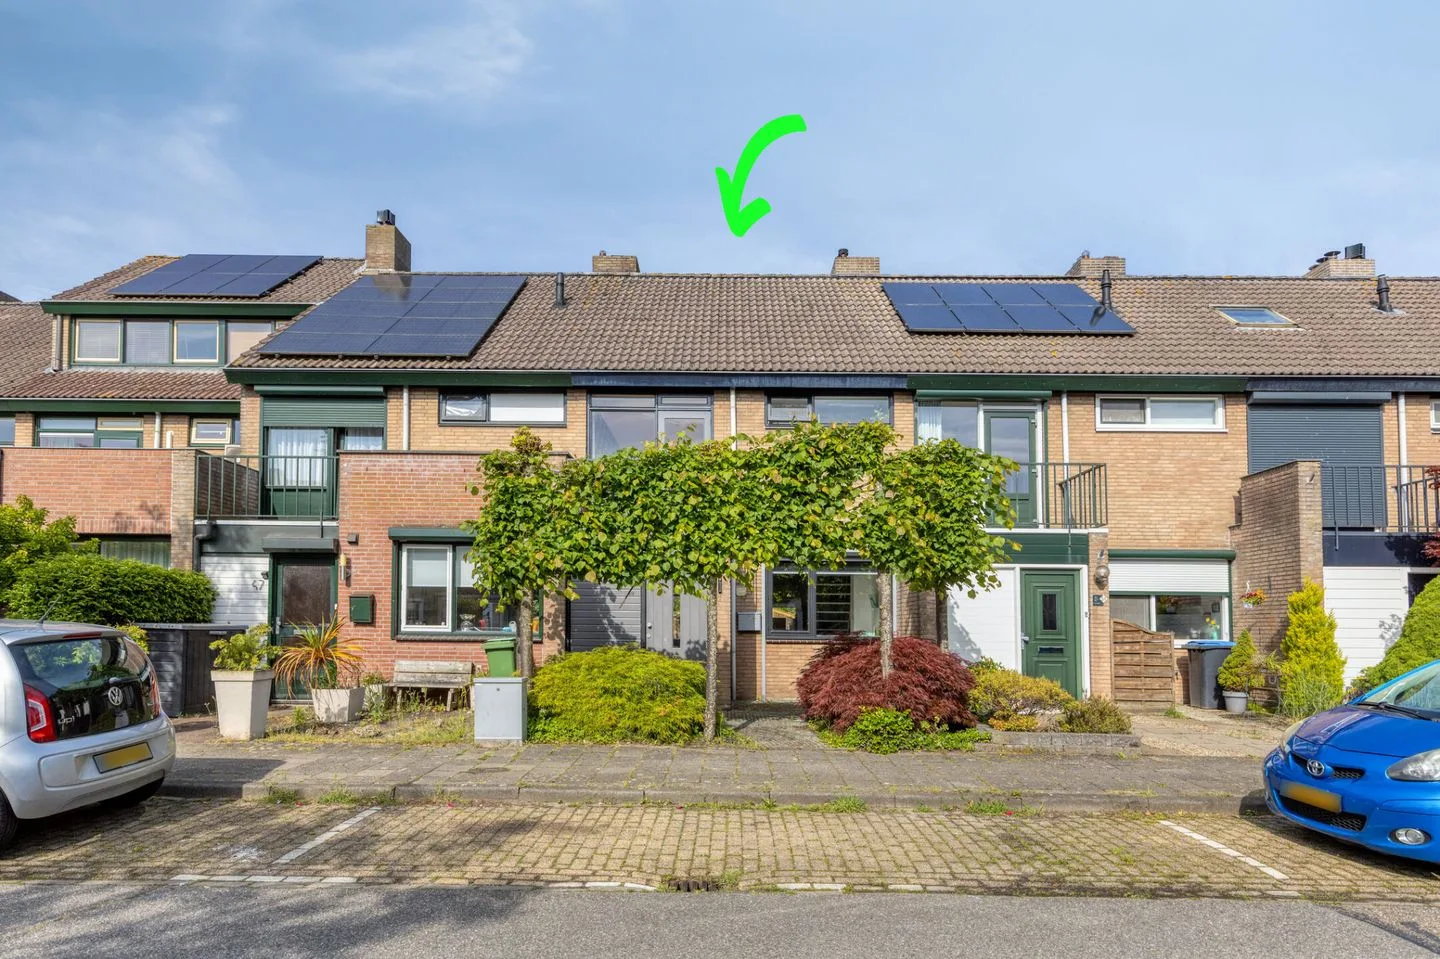
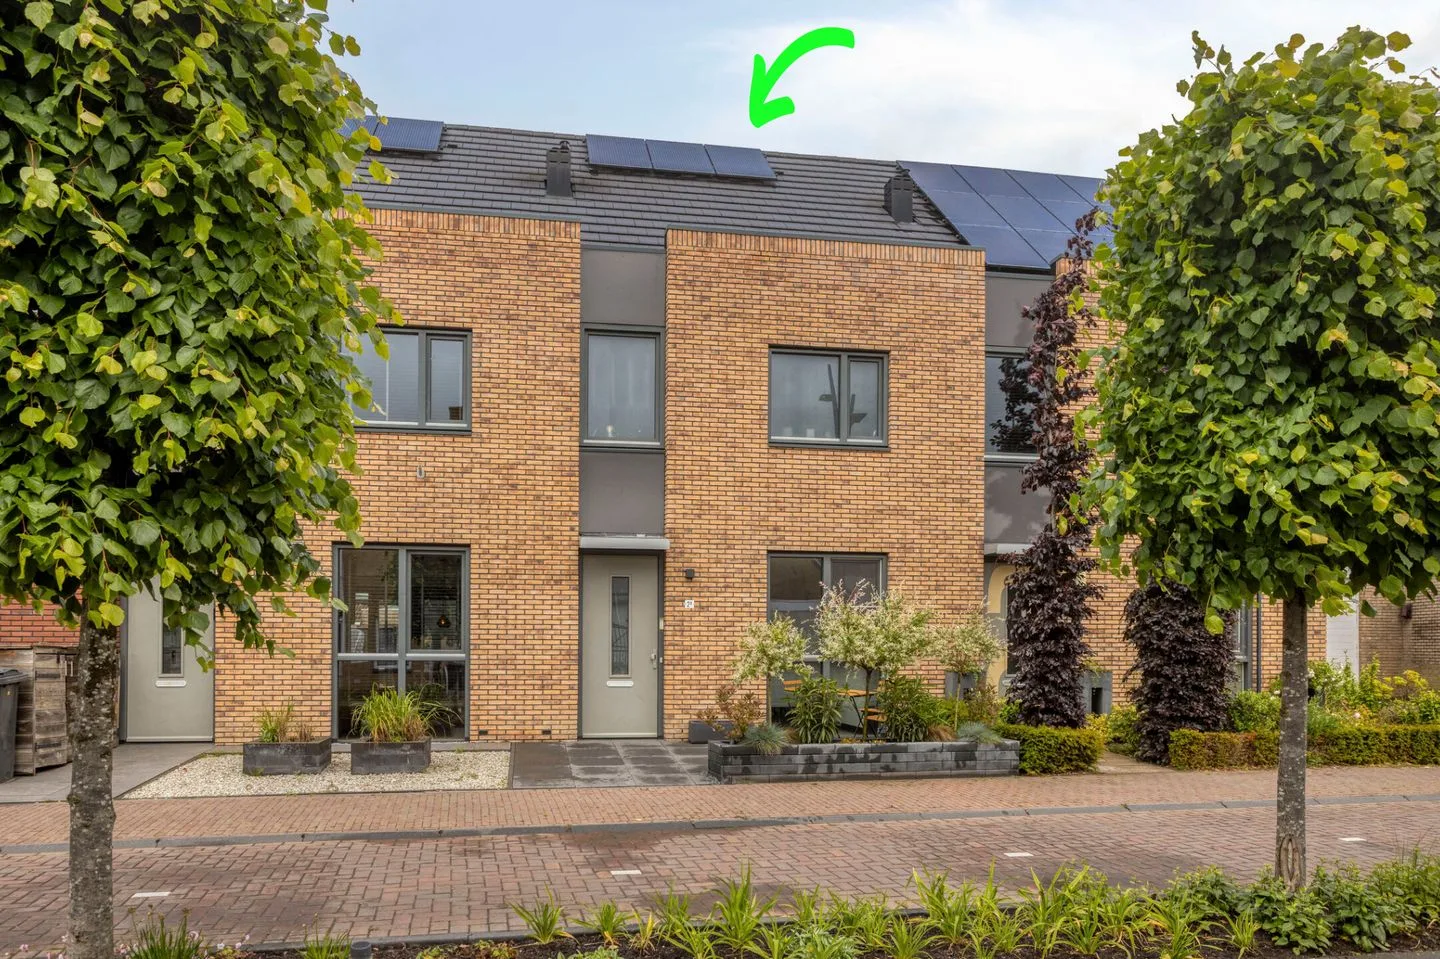
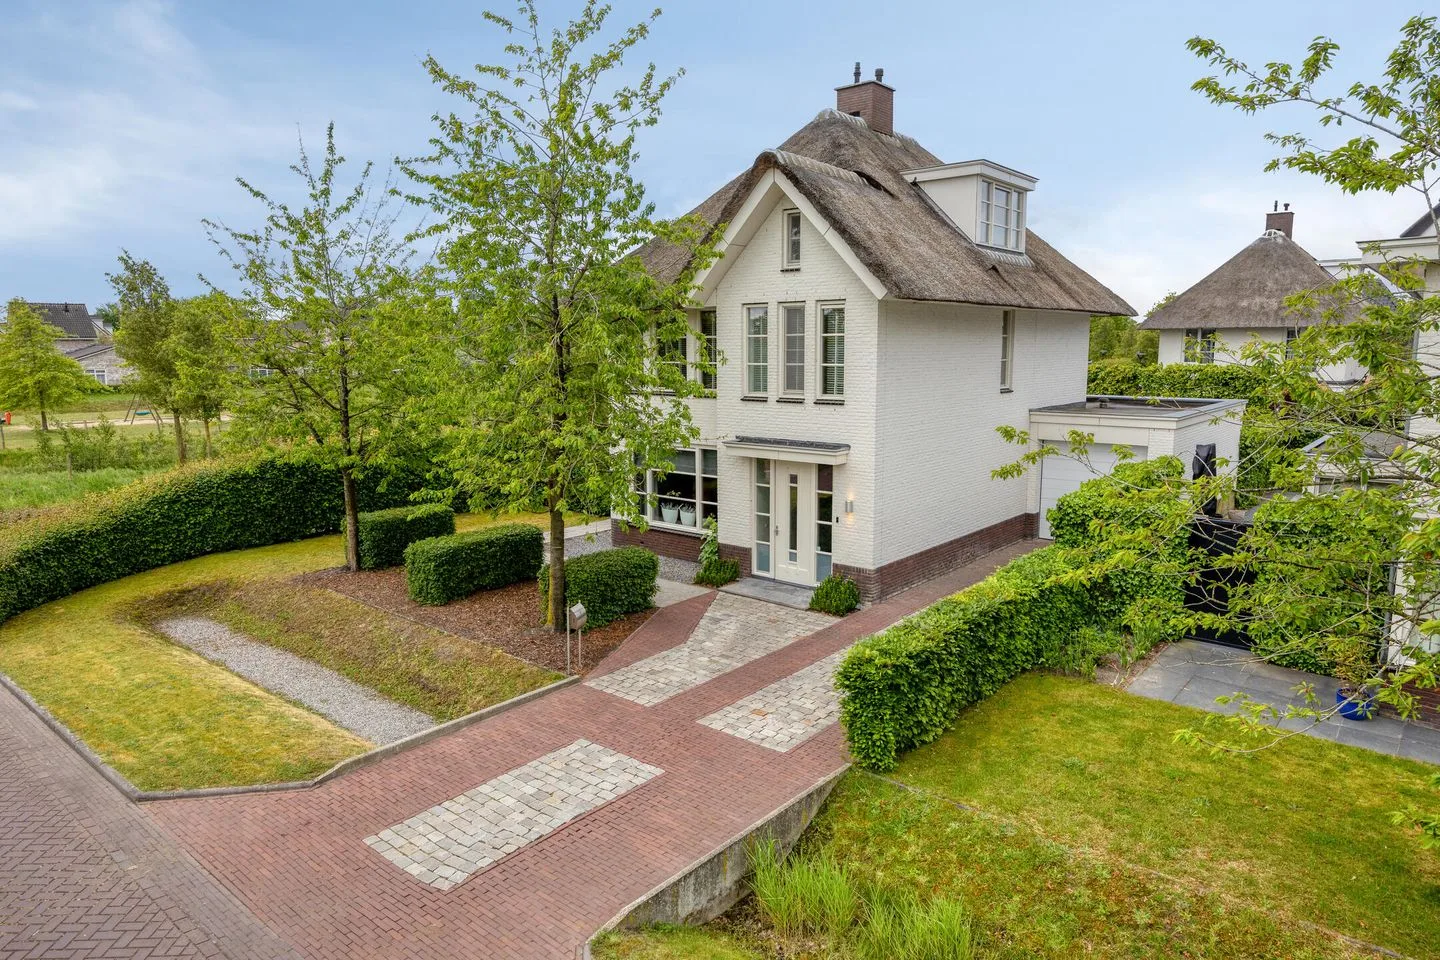
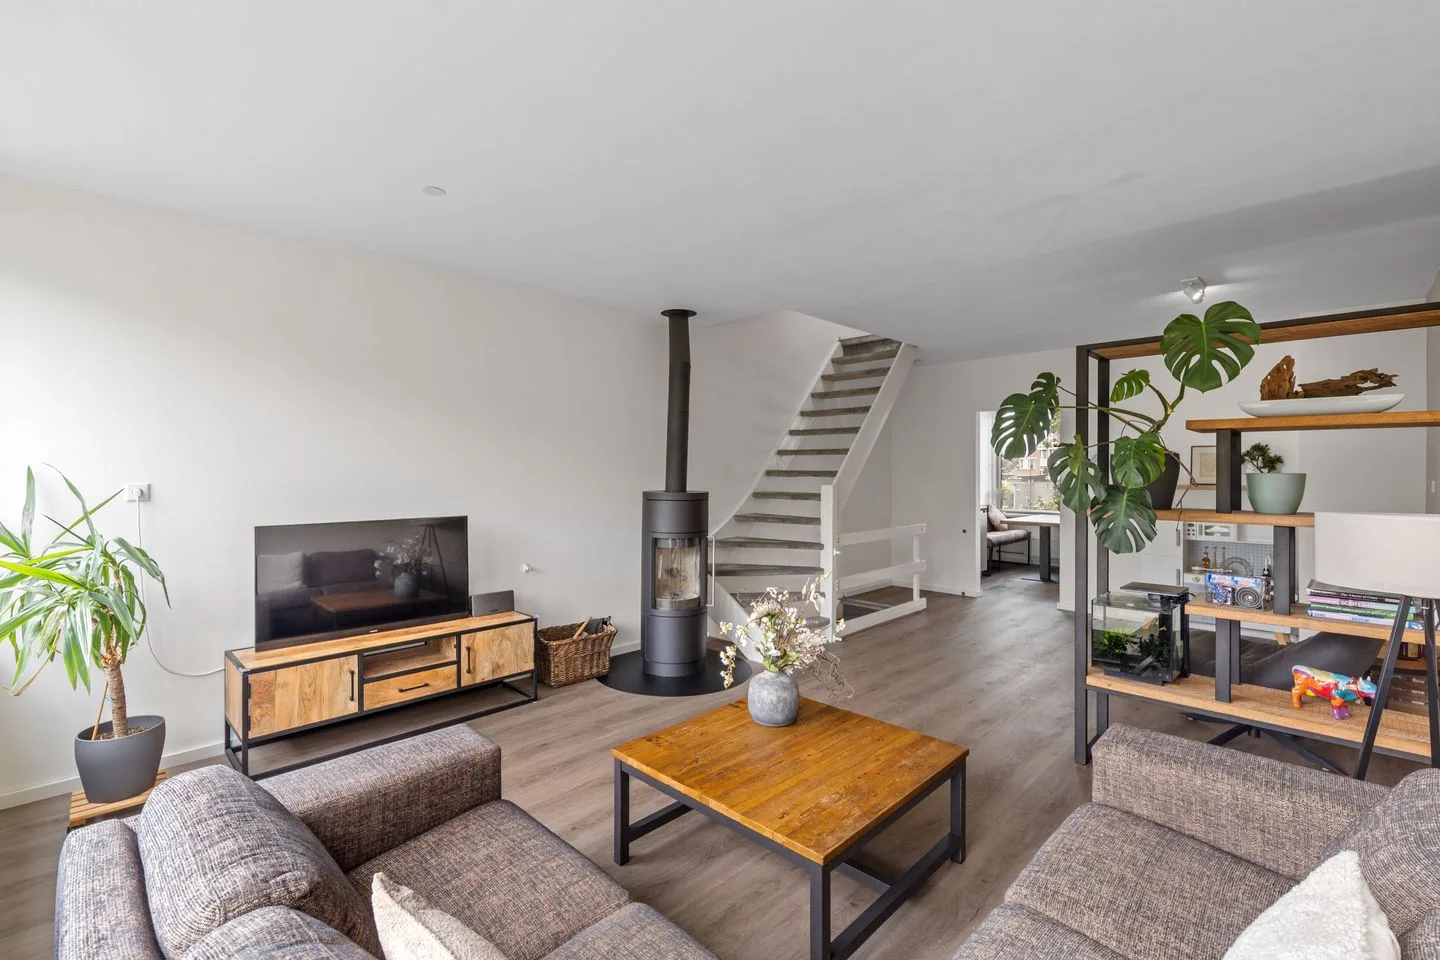
Tesselschadelaan 24
4707CK Roosendaal
€ 349.500 k.k.
€ 2.865/m²
B
Save as favorite
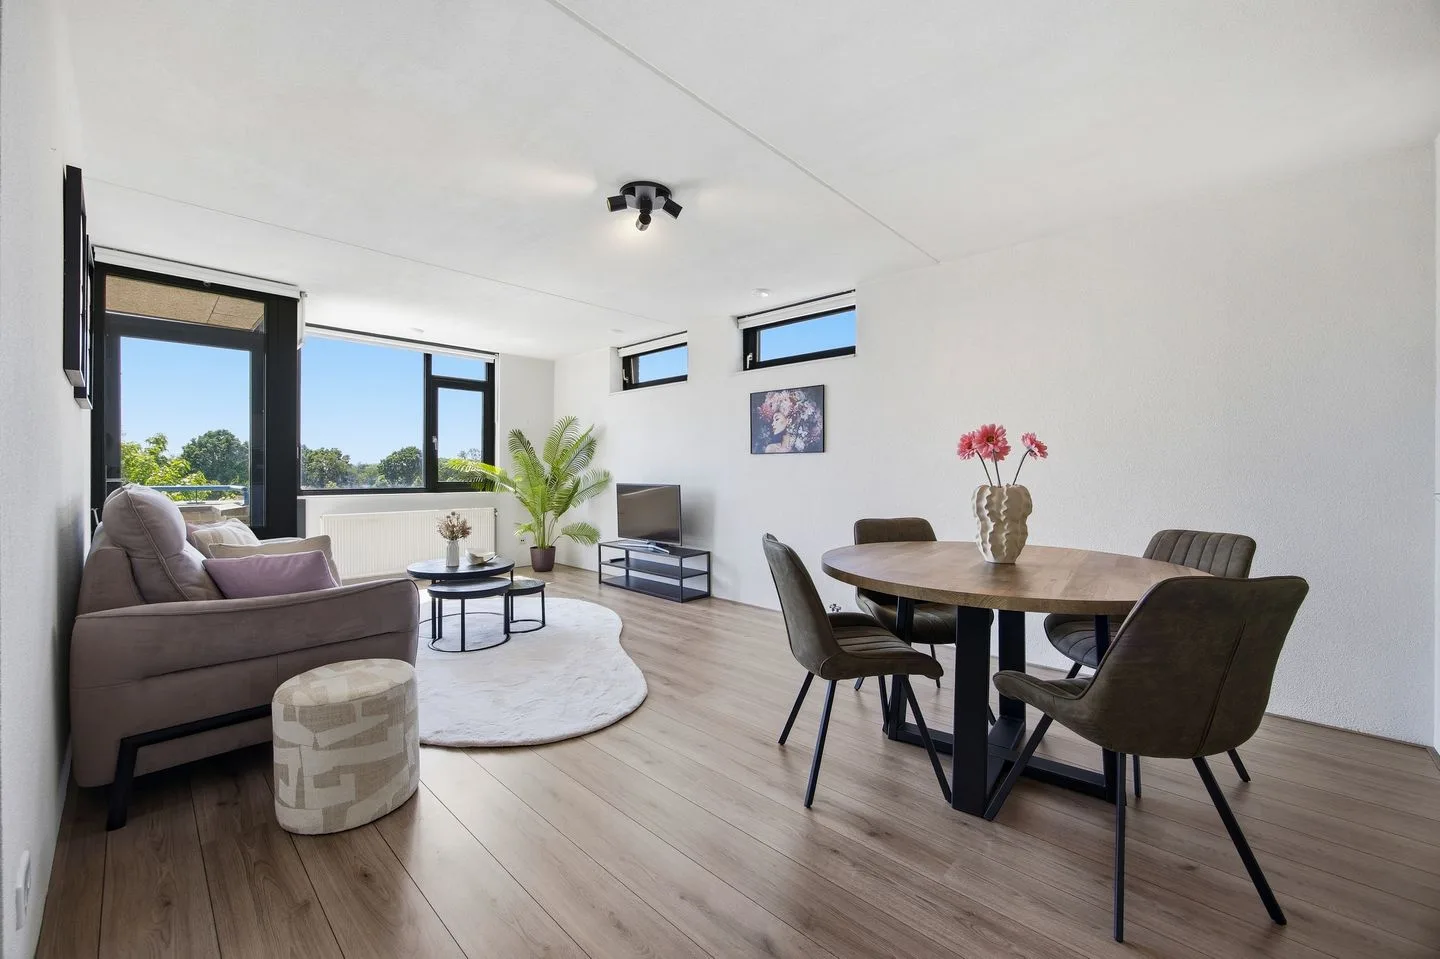
- Living area
- 122 m²
- Land area
- 124 m²
- Bedrooms
- 3