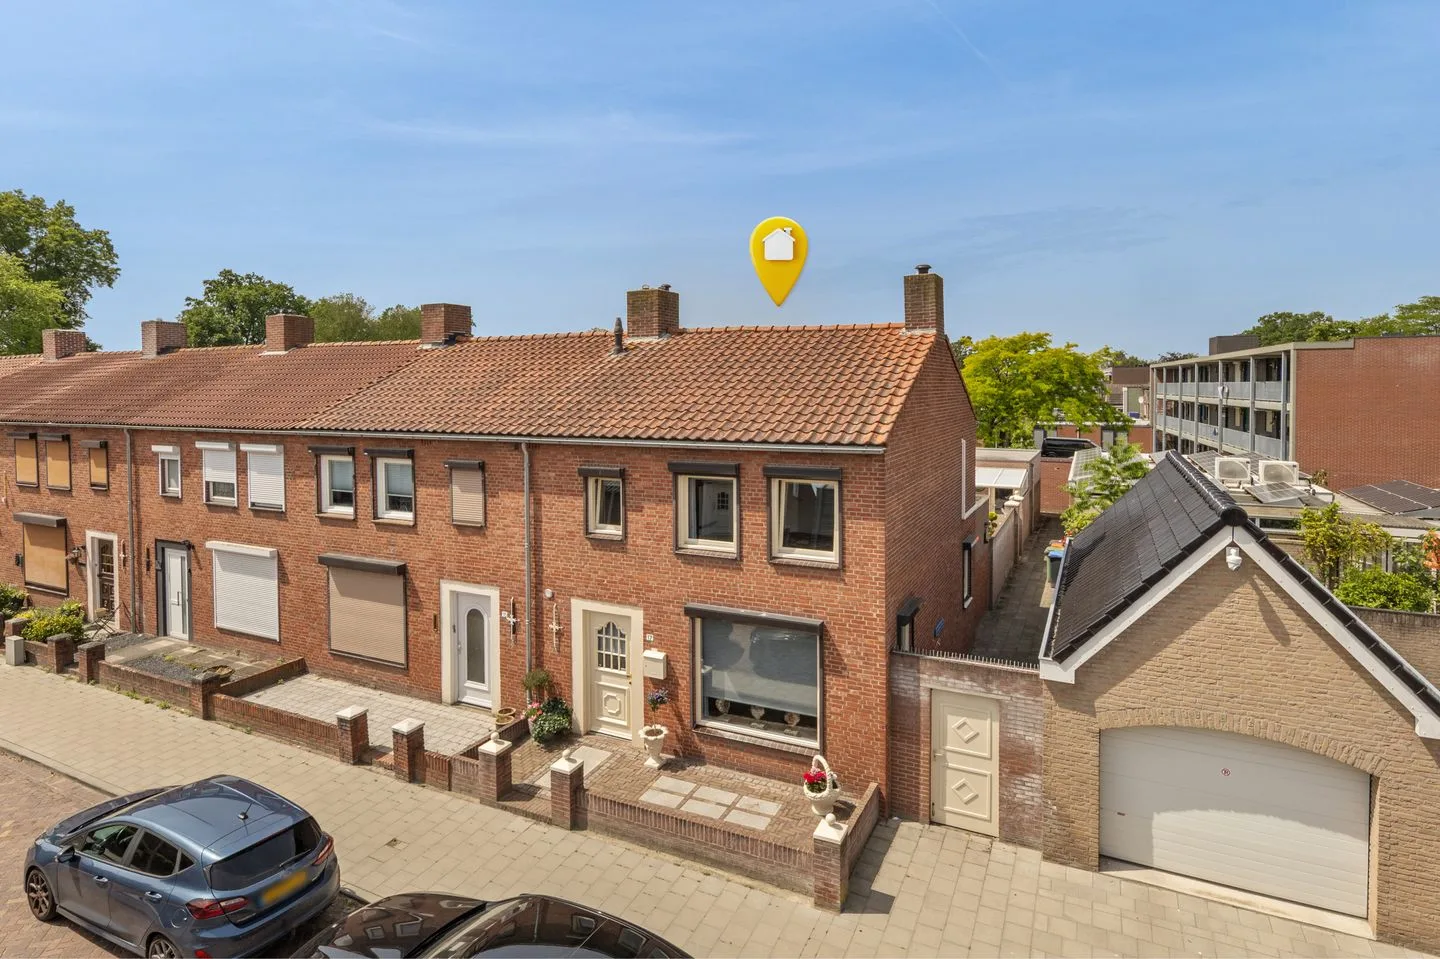
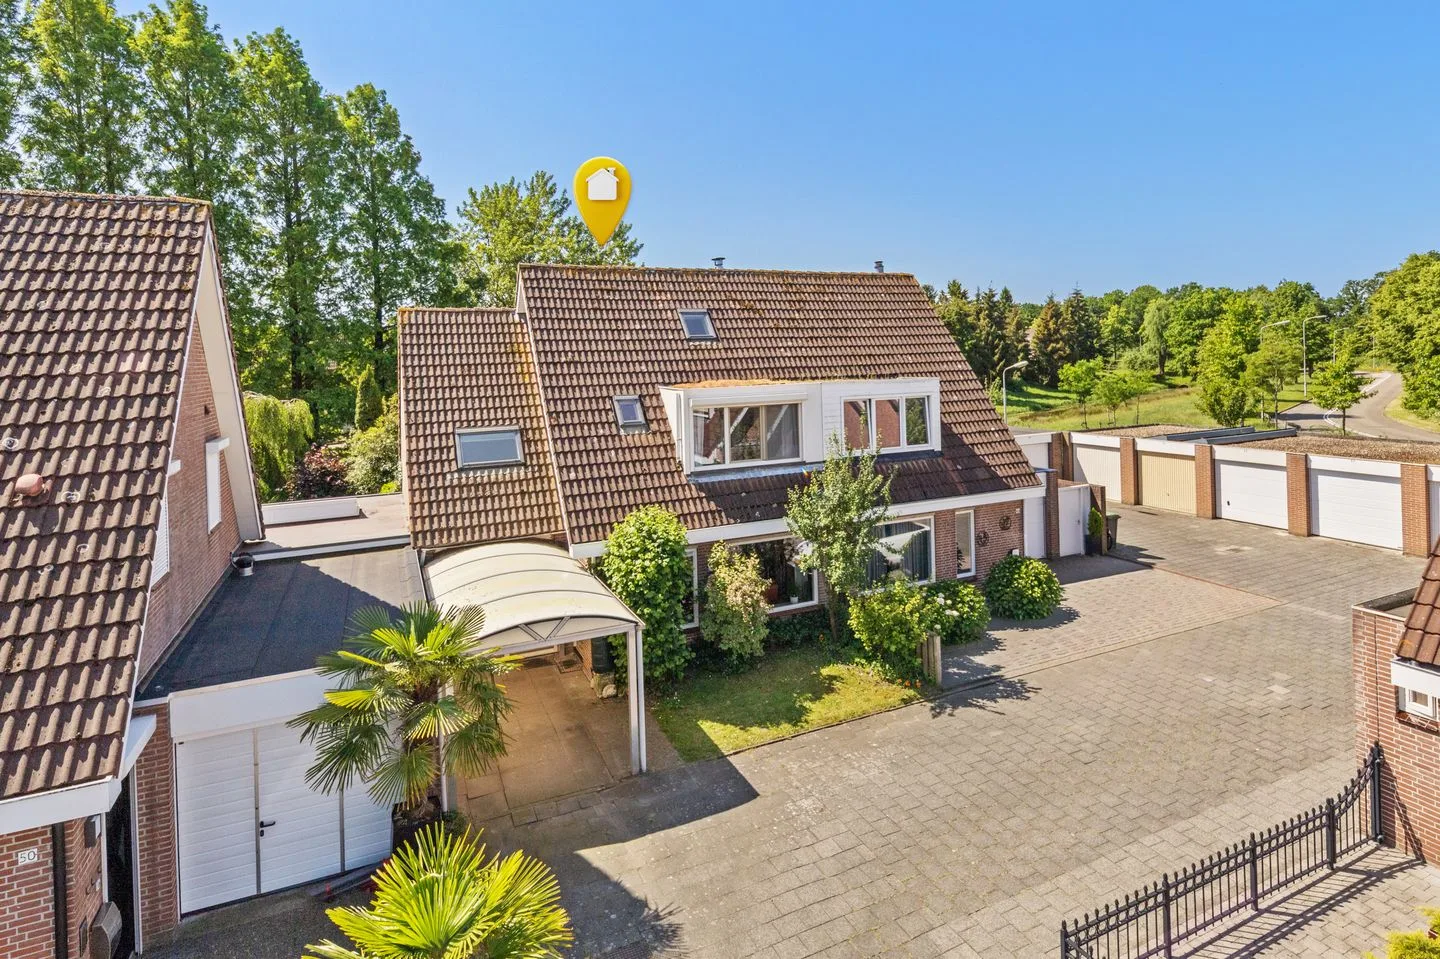
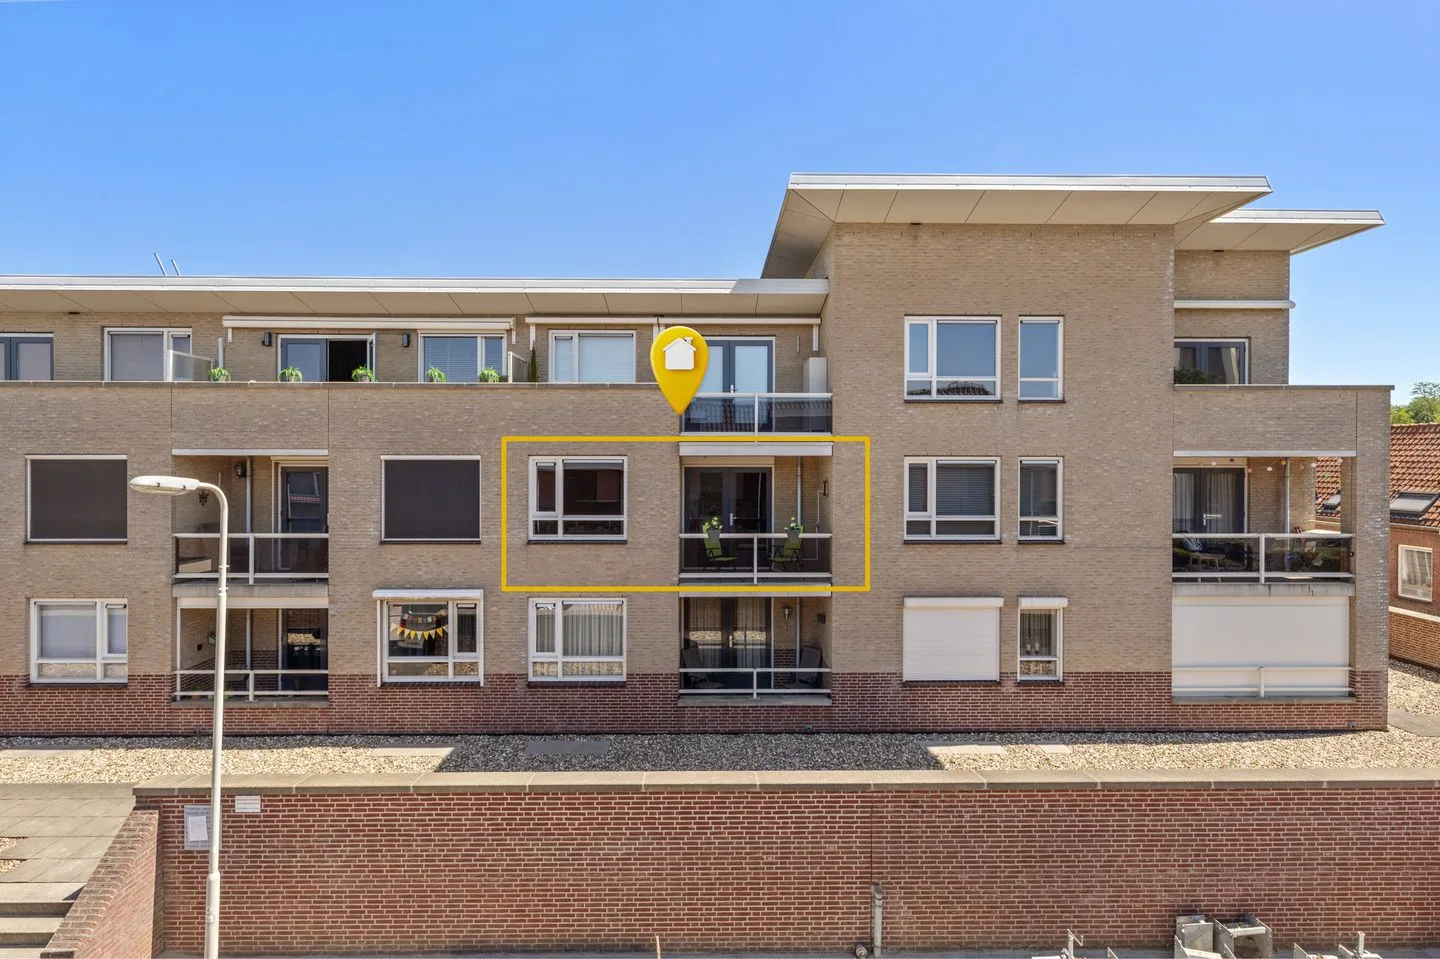
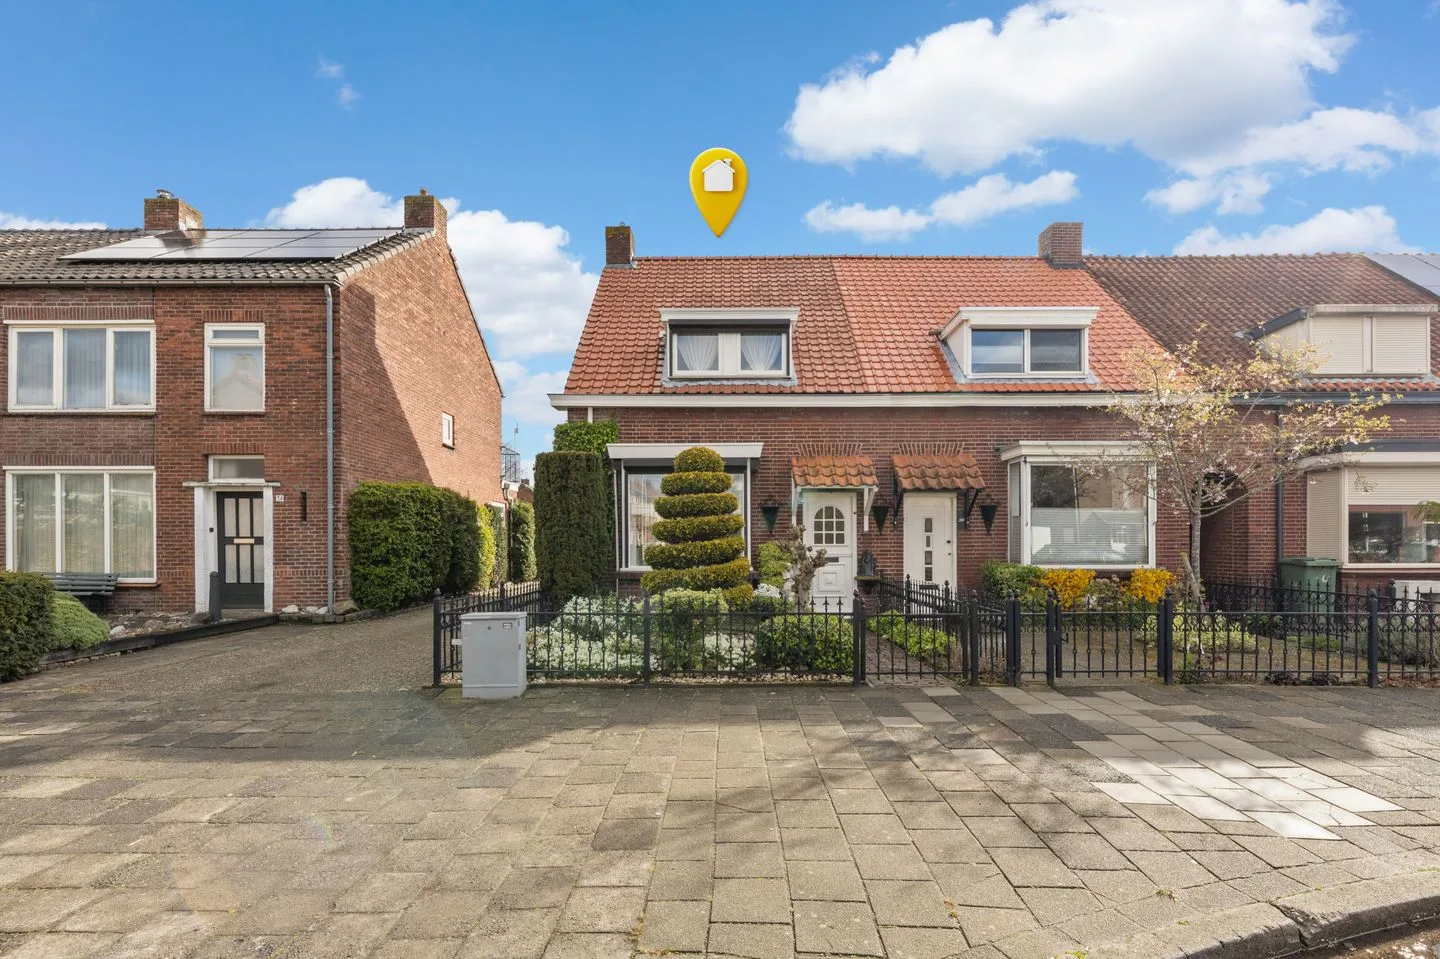
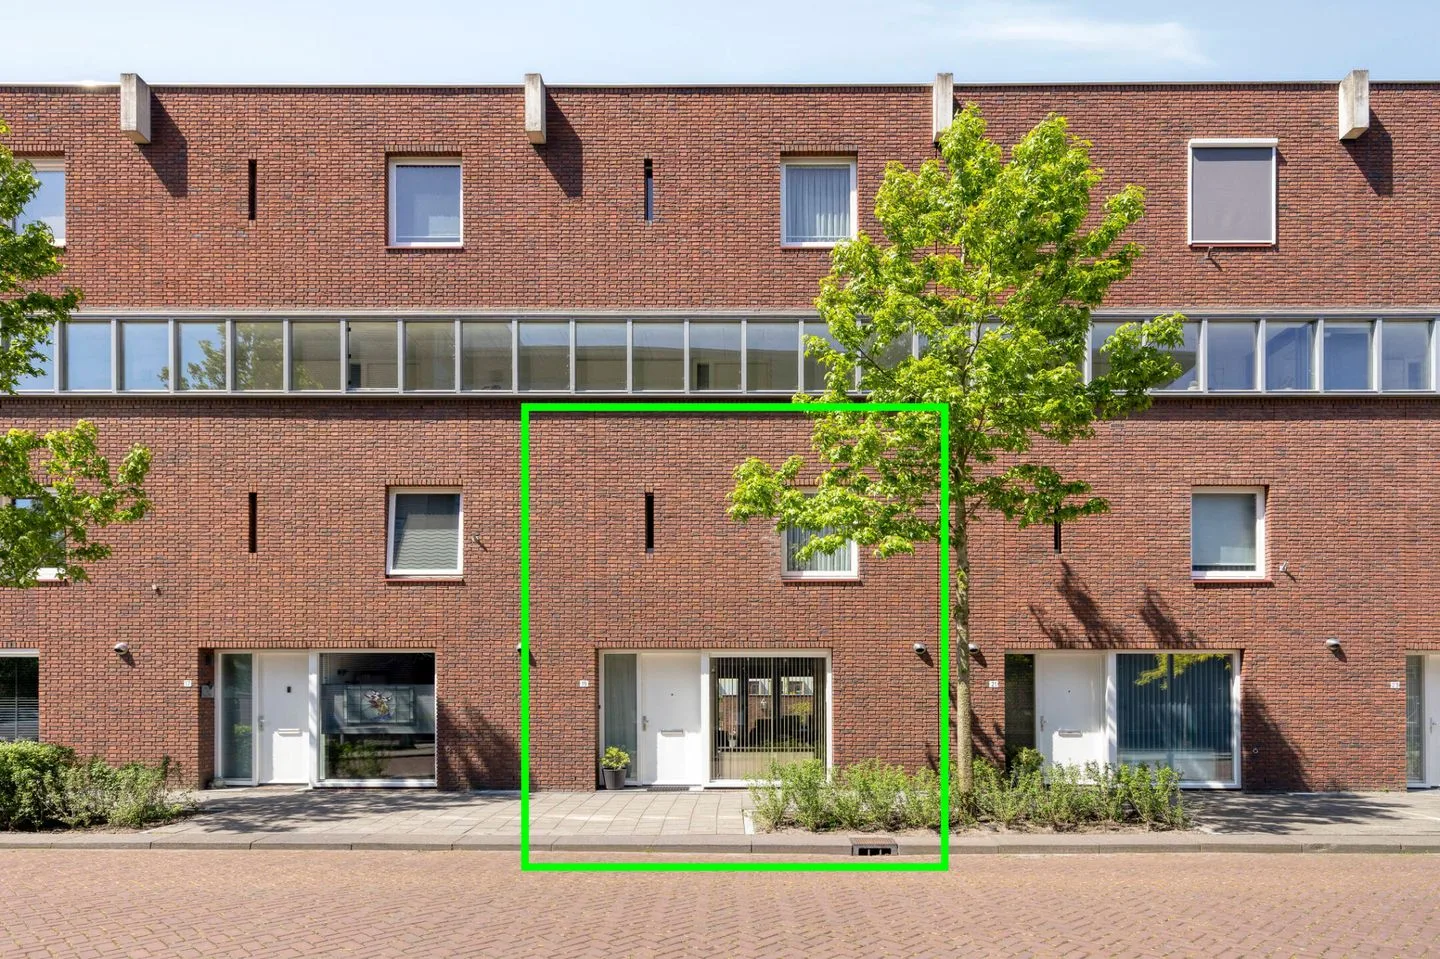
- Available
Uniestede 17
4701NR Roosendaal
€ 250.000 k.k.
€ 4.386/m²
- Living area
- 57 m²
- Land area
- —
- Bedrooms
- 2
Searching in 914 houses in Roosendaal
Type to search. Use arrow down and arrow up to navigate through results and press Enter to open.
Hidden search suggestions.
View current properties in Roosendaal or search targeted on street, postal code and property characteristics.
View the current housing stock in Roosendaal and quickly filter by price, living area, rooms and more. There are currently 914 houses in this place within our selection. View also 676 sold houses in Roosendaal for extra insight into the local housing market.
4701NR Roosendaal
€ 250.000 k.k.
€ 4.386/m²
4701AG Roosendaal
€ 988 p/m
€ 12/m²
4701PW Roosendaal
€ 232.500 k.k.
€ 3.059/m²
4702KT Roosendaal
€ 950.000 k.k.
€ 5.588/m²
4708LD Roosendaal
€ 545.000 k.k.
€ 3.323/m²
4701ET Roosendaal
€ 359.000 k.k.
€ 3.122/m²
4702JX Roosendaal
€ 359.000 k.k.
€ 3.294/m²
4706VE Roosendaal
€ 869.000 k.k.
€ 5.235/m²
4706CG Roosendaal
€ 525.000 k.k.
€ 3.571/m²
4708KS Roosendaal
€ 485.000 k.k.
€ 4.008/m²
4707DL Roosendaal
€ 475.000 k.k.
€ 3.467/m²
4703MC Roosendaal
€ 1.565 p/m
€ 24/m²
4706AN Roosendaal
€ 620.000 k.k.
€ 4.000/m²
4706TS Roosendaal
€ 347.500 k.k.
€ 3.904/m²
4701EA Roosendaal
€ 290.000 k.k.
€ 4.328/m²
4706LE Roosendaal
€ 345.000 k.k.
€ 3.670/m²
4706DC Roosendaal
€ 385.000 k.k.
€ 3.080/m²
4707HZ Roosendaal
€ 24.250 k.k.
4702XW Roosendaal
€ 26.950 k.k.
4708HR Roosendaal
€ 27.500 k.k.
4706TN Roosendaal
€ 1.085.000 k.k.
4707TA Roosendaal
€ 529.000 k.k.
€ 3.306/m²
4703GL Roosendaal
€ 315.000 k.k.
€ 3.621/m²
4708HM Roosendaal
€ 719.500 k.k.
€ 4.612/m²
4707MB Roosendaal
€ 389.000 k.k.
€ 3.242/m²
4703NN Roosendaal
€ 845 p/m
€ 26/m²
4706AD Roosendaal
€ 369.000 k.k.
€ 2.952/m²
4701DA Roosendaal
€ 350.000 k.k.
€ 3.365/m²
Get free quotes from real estate agents with local market knowledge. Compare more than 35 real estate agents in Roosendaal.
Selling a home in Roosendaal? View the sales-oriented guide sell a house in Roosendaal, compare all real estate agents in Roosendaal or view the top 10 real estate agents in Roosendaal for extra context to your choice.
Real estate agents make sharper offers when they know you're comparing — ask for quotes for sale or purchase.
Practical answers about housing supply, sales and comparing real estate agents in Roosendaal.
The costs of a real estate agent in Roosendaal depend on commission, setup costs, property presentation and the chosen service. Compare the 35 real estate agents in Roosendaal via the real estate agent page and request multiple quotes to compare rates and approach well.
Within our selection, we are currently showing 914 houses in Roosendaal. View also the sold houses in Roosendaal to compare the current offering with recent transactions.
Take into account not only price and living area but also maintenance, energy label, location, outdoor space and sales status. This way you compare houses in Roosendaal on more than just the asking price.
A local real estate agent knows the neighborhoods, recent transactions and demand in Roosendaal. By comparing 35 real estate agents in the region you get a better insight into prices, sales strategy and expected yield; the top 10 in Roosendaal provides a useful starting point.
Yes, when making a sales plan, a valuation in Roosendaal is wise. You gain insight into a realistic asking price and can then compare offers from real estate agents specifically.
View current location data on residents, WOZ development, housing stock, energy consumption, business activity and safety in Roosendaal. In 2025 were there 67.370 residents. The average WOZ value in 2025 is EUR 308.856.
These figures help to better assess and compare the housing stock in Roosendaal with recent sold homes. Orient yourself then on suitable top real estate agents in Roosendaal for sales advice in this region.
Residents
67.370
Last year: 2025
Average WOZ
EUR 308.856
Last year: 2025
Average income per person.
EUR 32.319
Source: AllNumbers
Crimes (current year)
3.924
Total registered
| Year | Residents |
|---|---|
| 2021 | 67.025 |
| 2022 | 67.000 |
| 2023 | 67.320 |
| 2024 | 67.235 |
| 2025 | 67.370 |
| Year | Average WOZ |
|---|---|
| 2021 | EUR 229.405 |
| 2022 | EUR 247.844 |
| 2023 | EUR 278.679 |
| 2024 | EUR 285.790 |
| 2025 | EUR 308.856 |
Hoger
13.720
Praktisch
15.300
Middelbaar
21.230
Europa
8.305
Nederland
45.380
Buiten Europa
13.685
Label C
9.297
Label A
6.760
Label B
5.831
Label D
3.028
Label G
2.019
Label E
2.016
Label F
1.491
Label A+
1.007
Label A++
484
Label A+++
378
Label A++++
183
Label A+++++
10
| Year | Gas (m3) | Electricity (kWh) |
|---|---|---|
| 2020 | 1.149 | 2.756 |
| 2021 | 1.287 | 2.777 |
| 2022 | 1.007 | 2.619 |
| 2023 | 870 | 2.482 |
| 2024 | 854 | 2.532 |
Hoekwoning
Gas: 999 • Electricity: 2.661
Huurwoning
Gas: 724 • Electricity: 1.964
Koopwoning
Gas: 973 • Electricity: 2.814
Appartement
Gas: 496 • Electricity: 1.732
Tussenwoning
Gas: 868 • Electricity: 2.461
Vrijstaande woning
Gas: 1.412 • Electricity: 3.648
Twee-onder-één-kap woning
Gas: 1.146 • Electricity: 2.964
Total number of company establishments: 8.175
| Period | Crimes |
|---|---|
| jan 2026 | 300 |
| jul 2025 | 315 |
| jun 2025 | 312 |
| mei 2025 | 297 |
| mrt 2025 | 342 |
| mrt 2026 | 339 |
| nov 2024 | 335 |
| nov 2025 | 394 |
| okt 2024 | 336 |
| okt 2025 | 364 |
| sep 2024 | 306 |
| sep 2025 | 279 |
These figures give an indicative picture of safety trends in the living environment of Roosendaal.
Short answers based on current local statistics, handy for a quick comparison of the living environment.
Roosendaal telt in 2025 ongeveer 67.370 inwoners.
De gemiddelde WOZ-waarde in Roosendaal is in 2025 circa € 308.856.
Het gemiddelde inkomen per inwoner in Roosendaal ligt rond € 32.319 per jaar.
Voor het huidige jaar gaat het om ongeveer 3.924 geregistreerde misdrijven. Gebruik deze cijfers als indicatie en vergelijk trends per periode.
In Roosendaal komt vooral "Tussenwoningen" veel voor, met ongeveer 12.036 woningen.