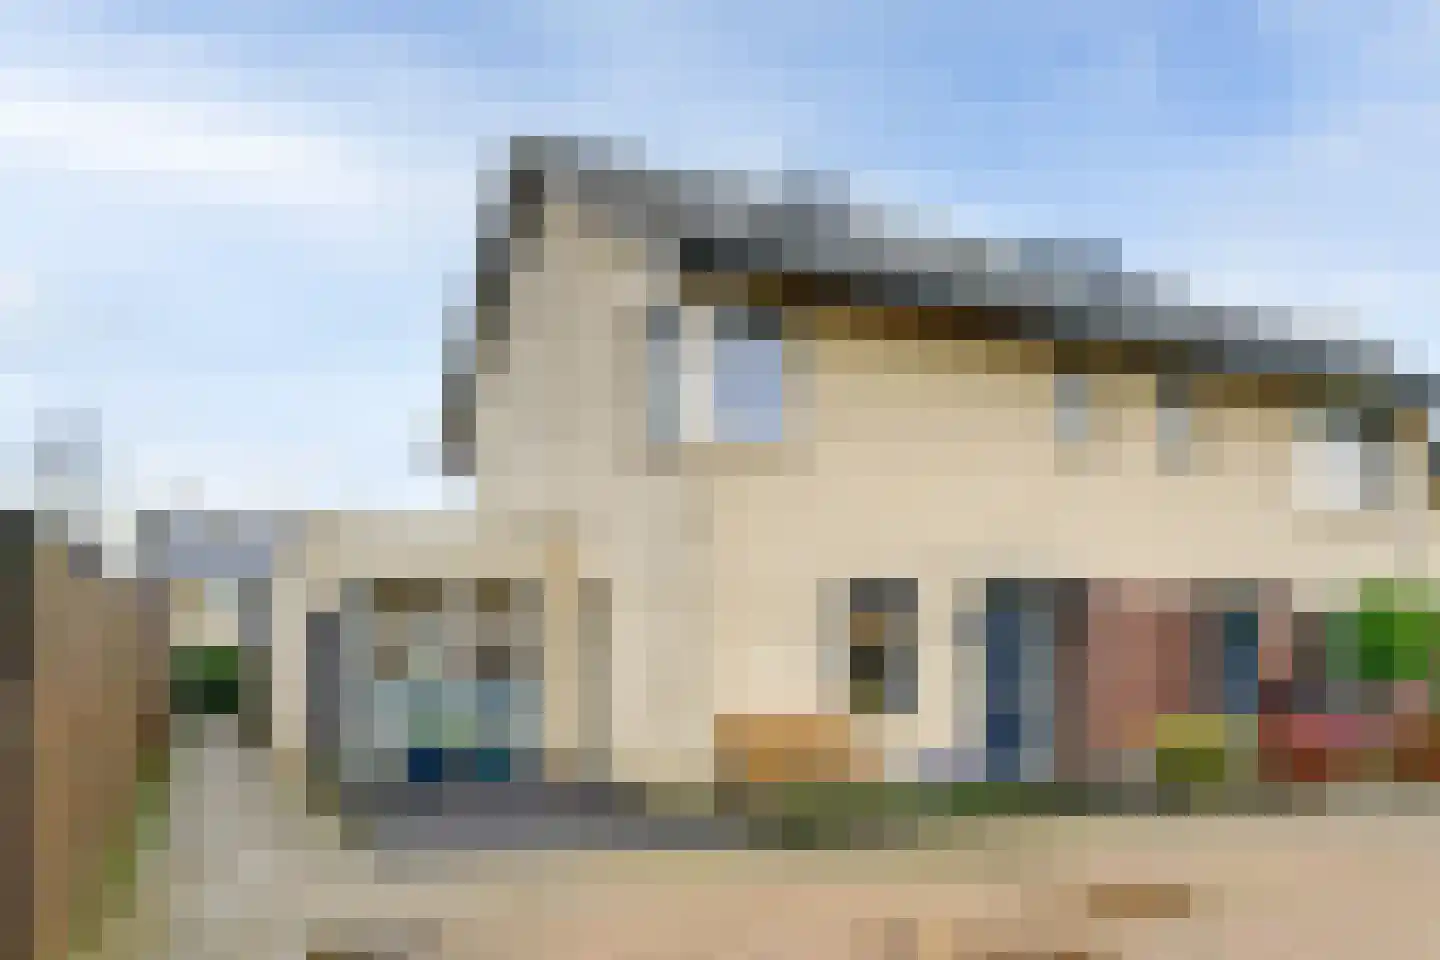
Houses sold in Sleeuwijk

View 64 sold houses in Sleeuwijk

Connected to: Vastgoed Nederland NVM Makelaars

On this page you will find recently sold homes in Sleeuwijk. Use this overview to better estimate selling prices, popular neighborhoods, and the local housing supply before you choose a real estate agent. Also view the current housing supply with 79 houses in Sleeuwijk.

Selection

Search and filter homes

Set your preferences and discover homes that suit you.

Total supply 243.262
Filters

Set price, area and other characteristics. Adjust a filter or click on Show homes. Location changes directly above.

Reset filters

You search for

  • Place Sleeuwijk
  • Status Sold

Huis verkopen in Sleeuwijk? Vergelijk verkoopmakelaars

Bekijk recente verkopen en ontvang gratis offertes van lokale makelaars. Vergelijk meer dan 23 makelaars in Sleeuwijk.

Free request a quote

  • Quotes in Sleeuwijk
  • Non-binding
  • Personal
  • Compare free rates

Zelf je woning verkopen in Sleeuwijk? Vergelijk verkoopmakelaars in Sleeuwijk of bekijk de beste verkoopmakelaars in Sleeuwijk als referentie bij jouw keuze.

Vergelijk meerdere offertes

Makelaars maken scherpere voorstellen als ze weten dat je vergelijkt — vraag offertes aan voor verkoop of aankoop.

Frequently asked questions about sold homes in Sleeuwijk

Short answers about housing prices, sold homes and comparing real estate agents in Sleeuwijk.

Residential and neighborhood statistics in Sleeuwijk

View current location data on residents, WOZ development, housing stock, energy consumption, business activity and safety in Sleeuwijk. In 2025 were there 6.150 residents. The average WOZ value in 2025 is EUR 423.000.

These figures help to better assess and compare the housing stock in Sleeuwijk with recent sold homes. Orient yourself then on suitable top real estate agents in Sleeuwijk for sales advice in this region.

Residents

6.150

Last year: 2025

Average WOZ

EUR 423.000

Last year: 2025

Average income per person.

EUR 36.300

Source: AllNumbers

Crimes (current year)

137

Total registered

Demographics and WOZ development

Inhabitants per year

Inhabitants per year in Sleeuwijk
Year Residents
2021 5.865
2022 6.005
2023 6.030
2024 6.120
2025 6.150

Annual WOZ value

WOZ value per year in Sleeuwijk
Year Average WOZ
2021 EUR 304.000
2022 EUR 338.000
2023 EUR 395.000
2024 EUR 416.000
2025 EUR 423.000

Composition of residents

Age build-up

65+: 1.420 0-15: 1.000 15-25: 730 25-45: 1.360 45-65: 1.650

Education level

Hoger

1.420

Praktisch

1.040

Middelbaar

2.010

Origin of residents (2025)

Europa

285

Nederland

5.475

Buiten Europa

385

Housing stock and construction periods

Types of homes

Hoekwoningen 481
Appartementen 422
Tussenwoningen 750
Vrijstaande woningen 646
Twee-onder-één-kap woningen 364

Construction period of buildings

Voor 1700 1
1700 tot 1900 30
1900 tot 1925 72
1925 tot 1950 195
1950 tot 1970 510
1970 tot 1980 672
1980 tot 1990 309
1990 tot 2000 230
2000 tot 2010 126
2010 tot 2020 242
2020 en later 151

Energy and sustainability

Energy label distribution

Label A

659

Label C

652

Label B

411

Label D

254

Label F

164

Label G

141

Label E

85

Label A+

55

Label A+++

45

Label A++

22

Label A++++

19

Label A+++++

0

Average energy consumption per year

Average energy consumption per year in Sleeuwijk
Year Gas (m3) Electricity (kWh)
2020 1.320 3.160
2021 1.480 3.220
2022 1.120 3.010
2023 920 2.850
2024 880 2.960

Consumption per house type

Hoekwoning

Gas: 910 • Electricity: 2.640

Huurwoning

Gas: 760 • Electricity: 1.880

Koopwoning

Gas: 970 • Electricity: 3.160

Appartement

Gas: 550 • Electricity: 1.720

Tussenwoning

Gas: 770 • Electricity: 2.440

Vrijstaande woning

Gas: 1.240 • Electricity: 3.960

Twee-onder-één-kap woning

Gas: 1.010 • Electricity: 3.090

Business activity in Sleeuwijk (2025)

Handel en HORECA 125
Nijverheid en energie 120
Zakelijke dienstverlening 195
Overheid, onderwijs en zorg 100
Landbouw, bosbouw en visserij 15
Vervoer, informatie en communicatie 50
Financiele diensten en onroerendgoed 35
Cultuur, recreatie en overige diensten 75

Total number of company establishments: 715

Recent crime statistics

Recent crime statistics in Sleeuwijk
Period Crimes
jan 2026 4
jul 2025 8
jun 2025 10
mei 2025 12
mrt 2025 11
mrt 2026 11
nov 2024 13
nov 2025 7
okt 2024 10
okt 2025 12
sep 2024 8
sep 2025 12

These figures give an indicative picture of safety trends in the living environment of Sleeuwijk.

Frequently asked questions about living in Sleeuwijk

Short answers based on current local statistics, handy for a quick comparison of the living environment.

Hoeveel inwoners heeft Sleeuwijk?

Sleeuwijk telt in 2025 ongeveer 6.150 inwoners.

Wat is de gemiddelde WOZ-waarde in Sleeuwijk?

De gemiddelde WOZ-waarde in Sleeuwijk is in 2025 circa € 423.000.

Wat is het gemiddelde inkomen per inwoner in Sleeuwijk?

Het gemiddelde inkomen per inwoner in Sleeuwijk ligt rond € 36.300 per jaar.

Hoe veilig is wonen in Sleeuwijk?

Voor het huidige jaar gaat het om ongeveer 137 geregistreerde misdrijven. Gebruik deze cijfers als indicatie en vergelijk trends per periode.

Welke woningtypen komen het meest voor in Sleeuwijk?

In Sleeuwijk komt vooral "Tussenwoningen" veel voor, met ongeveer 750 woningen.

Receive free, non-binding quotes

Compare multiple real estate agents and choose the best match.