- Available
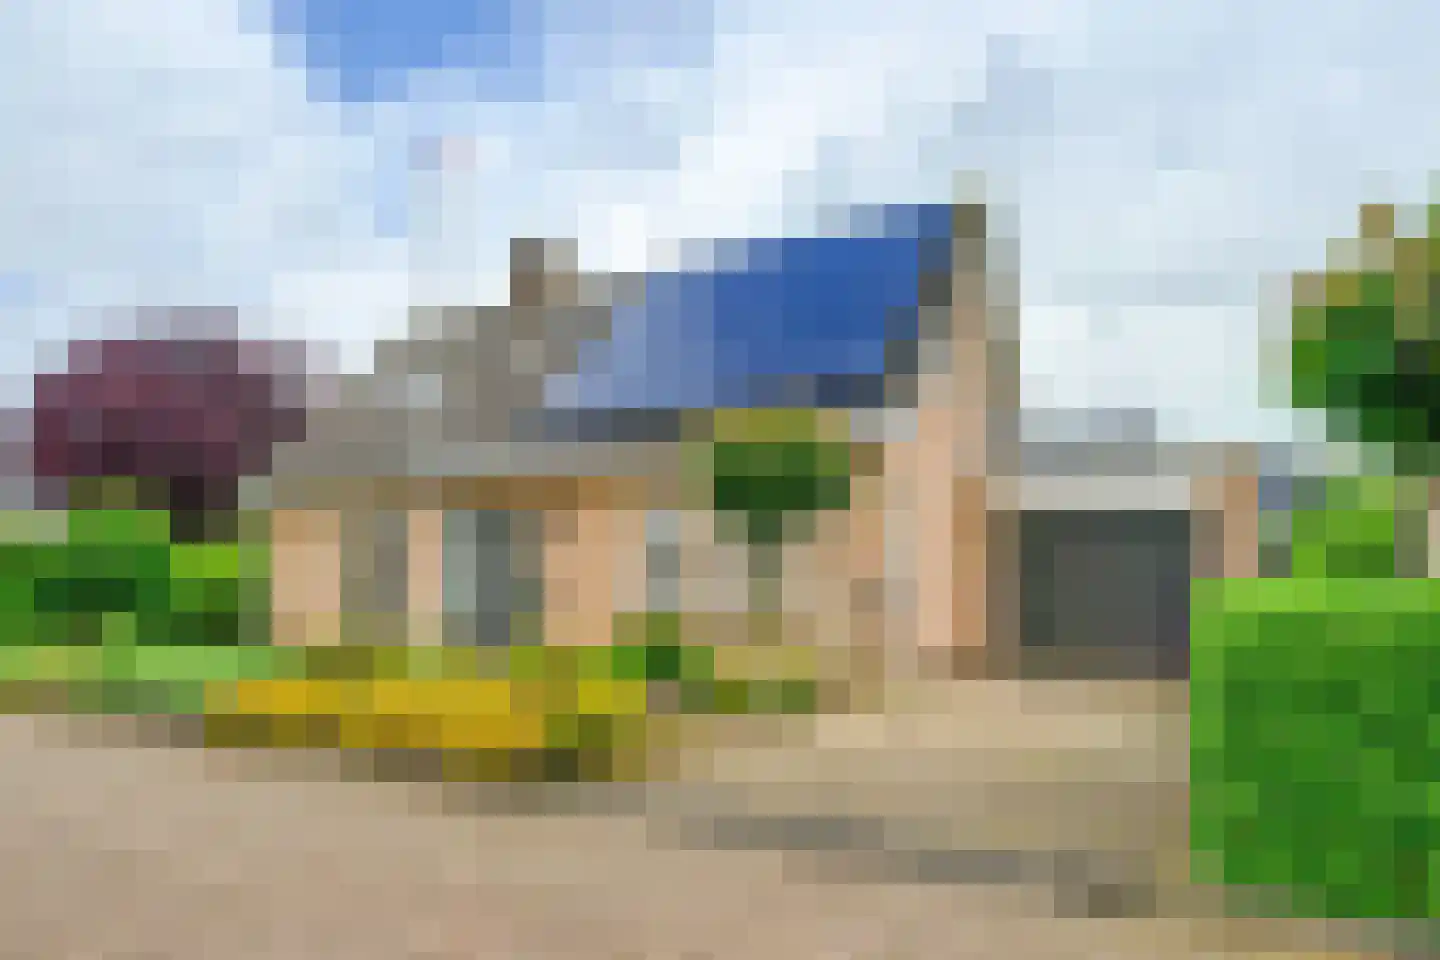
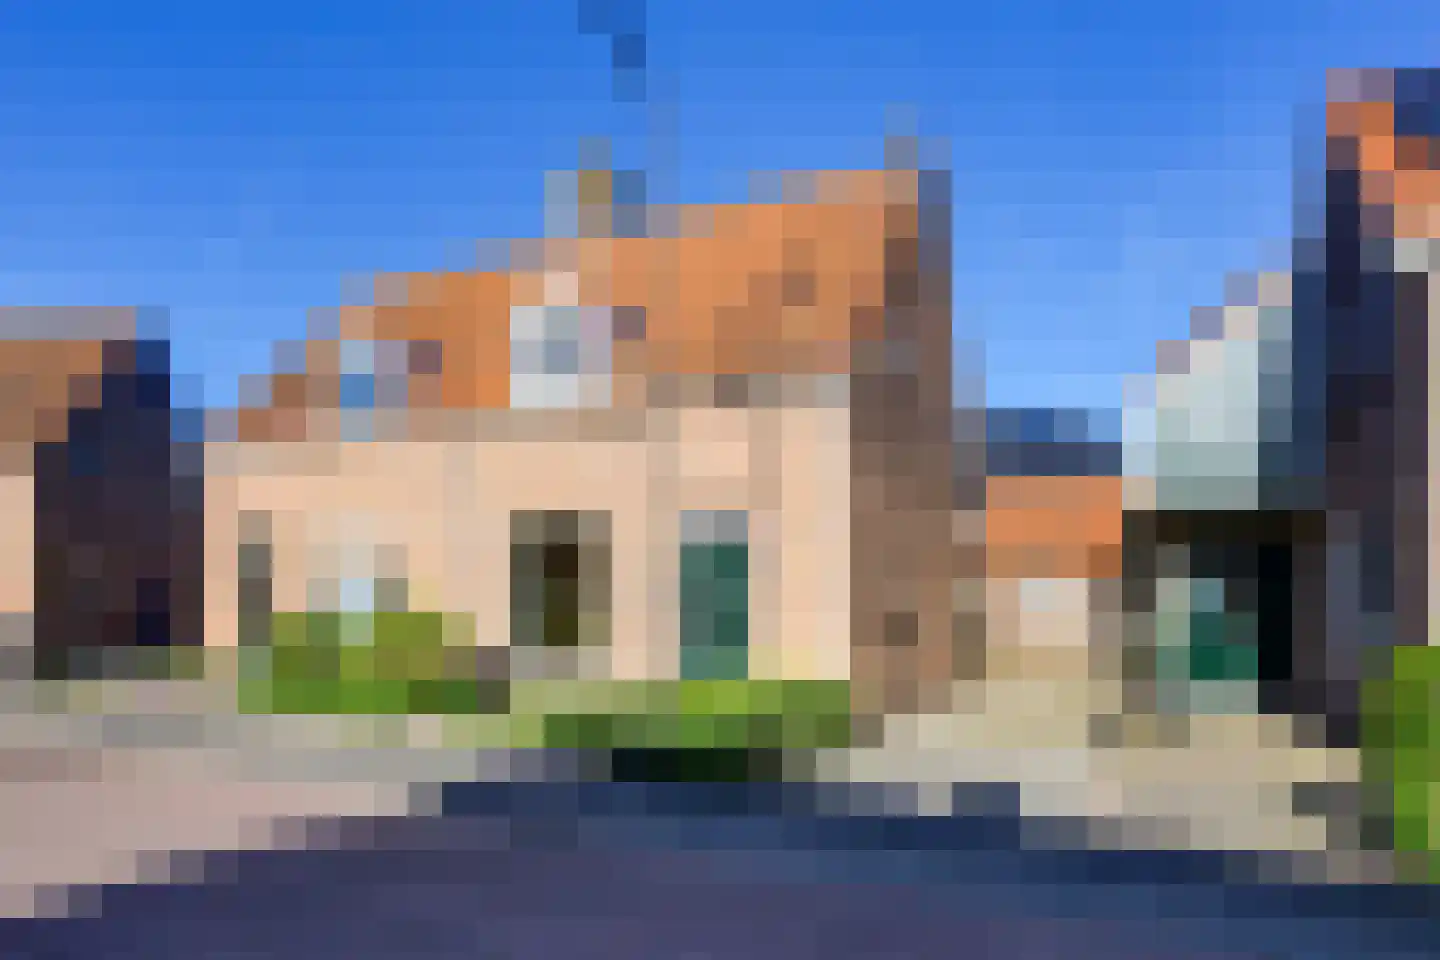
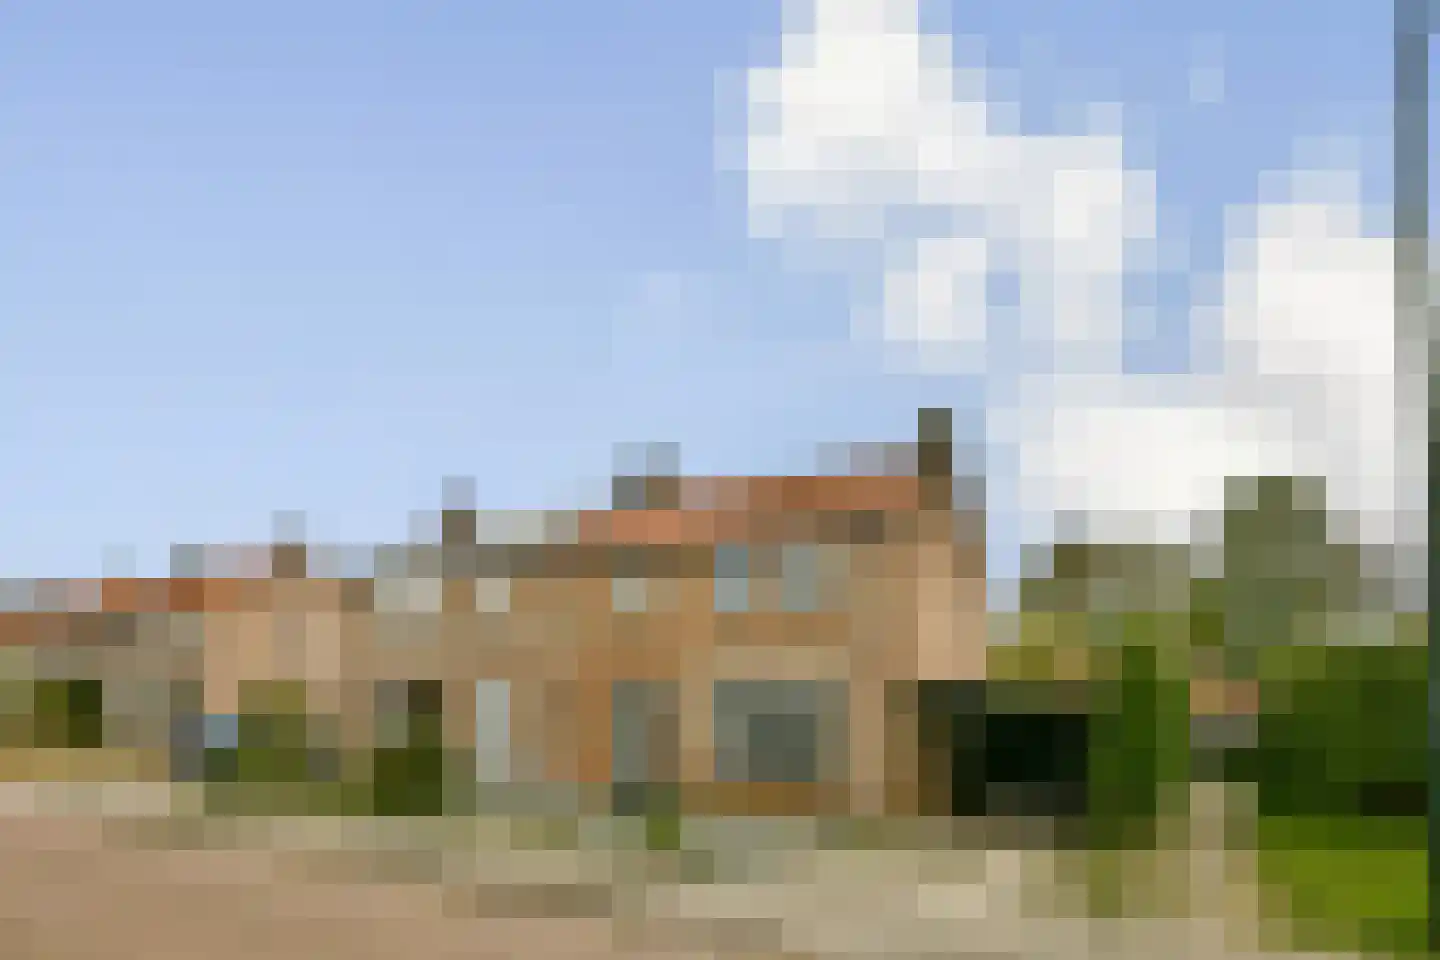
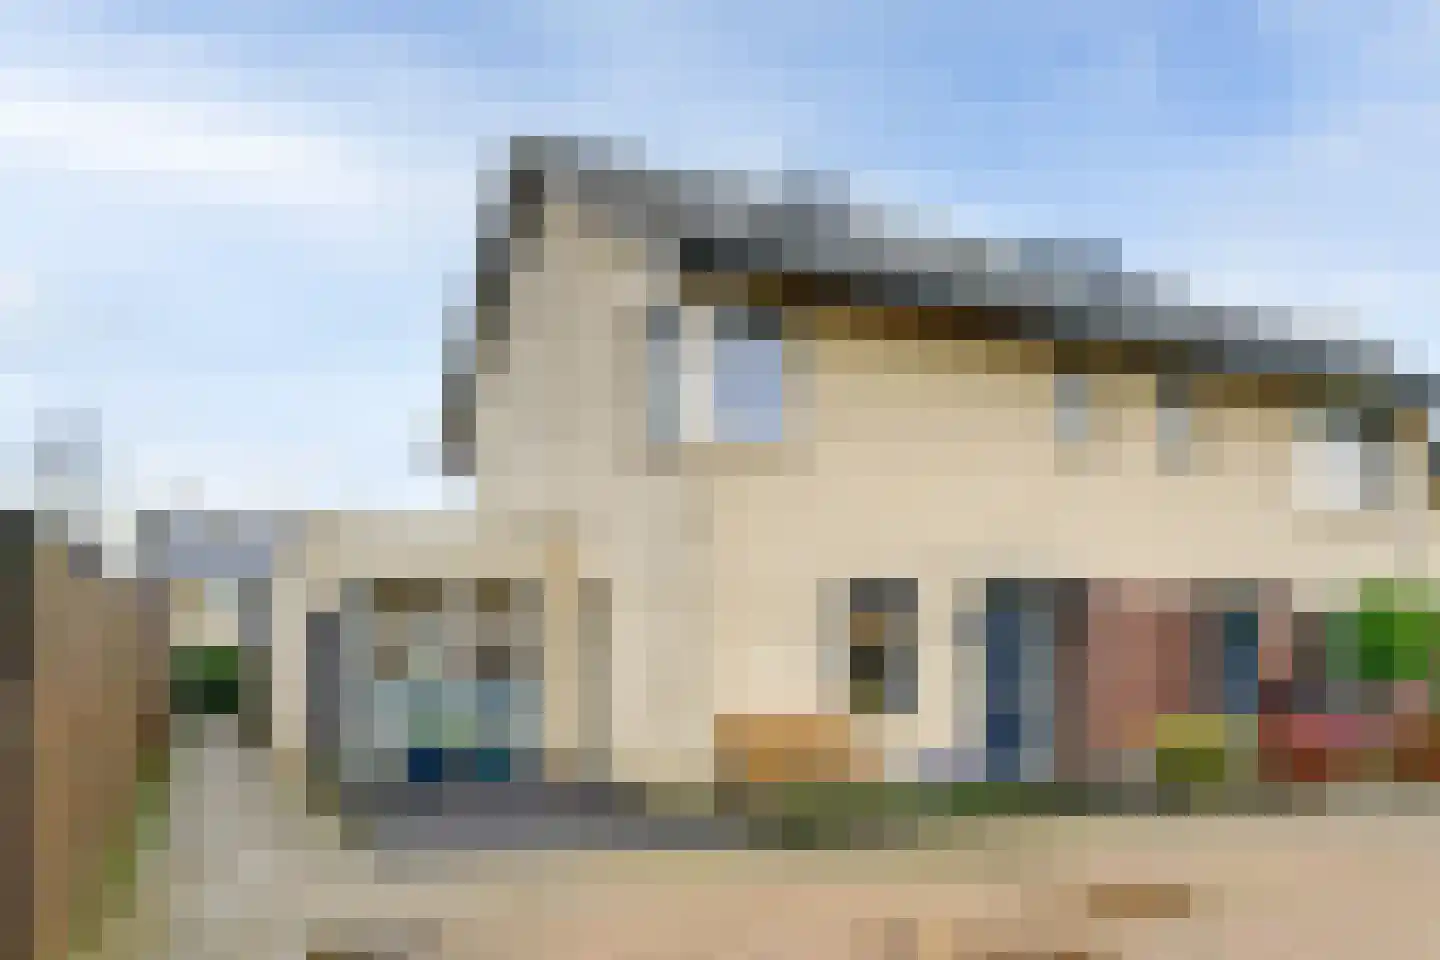
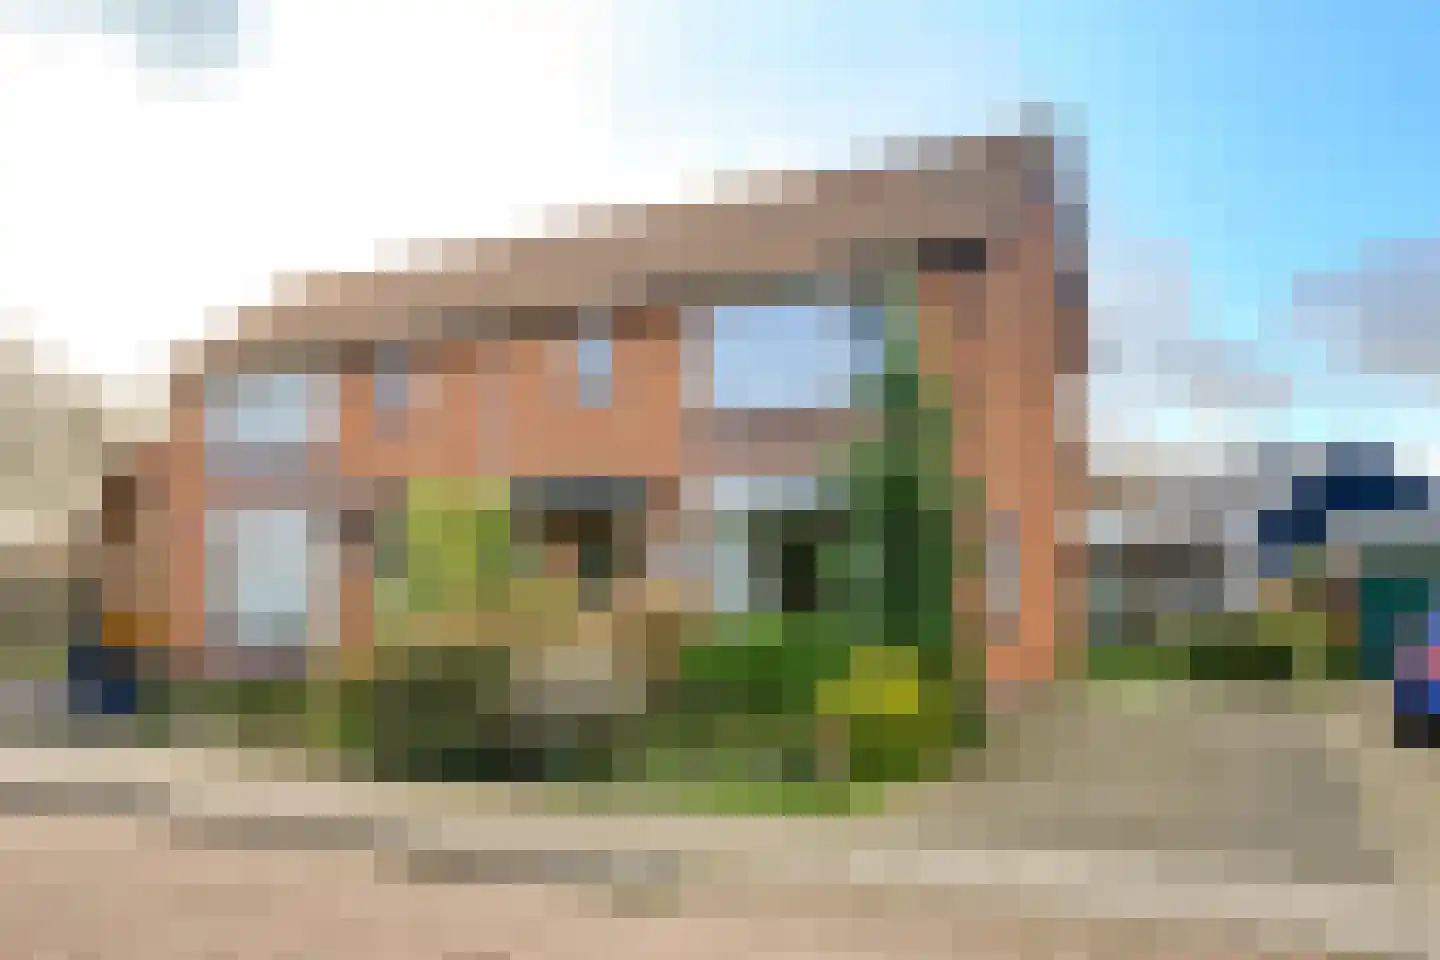
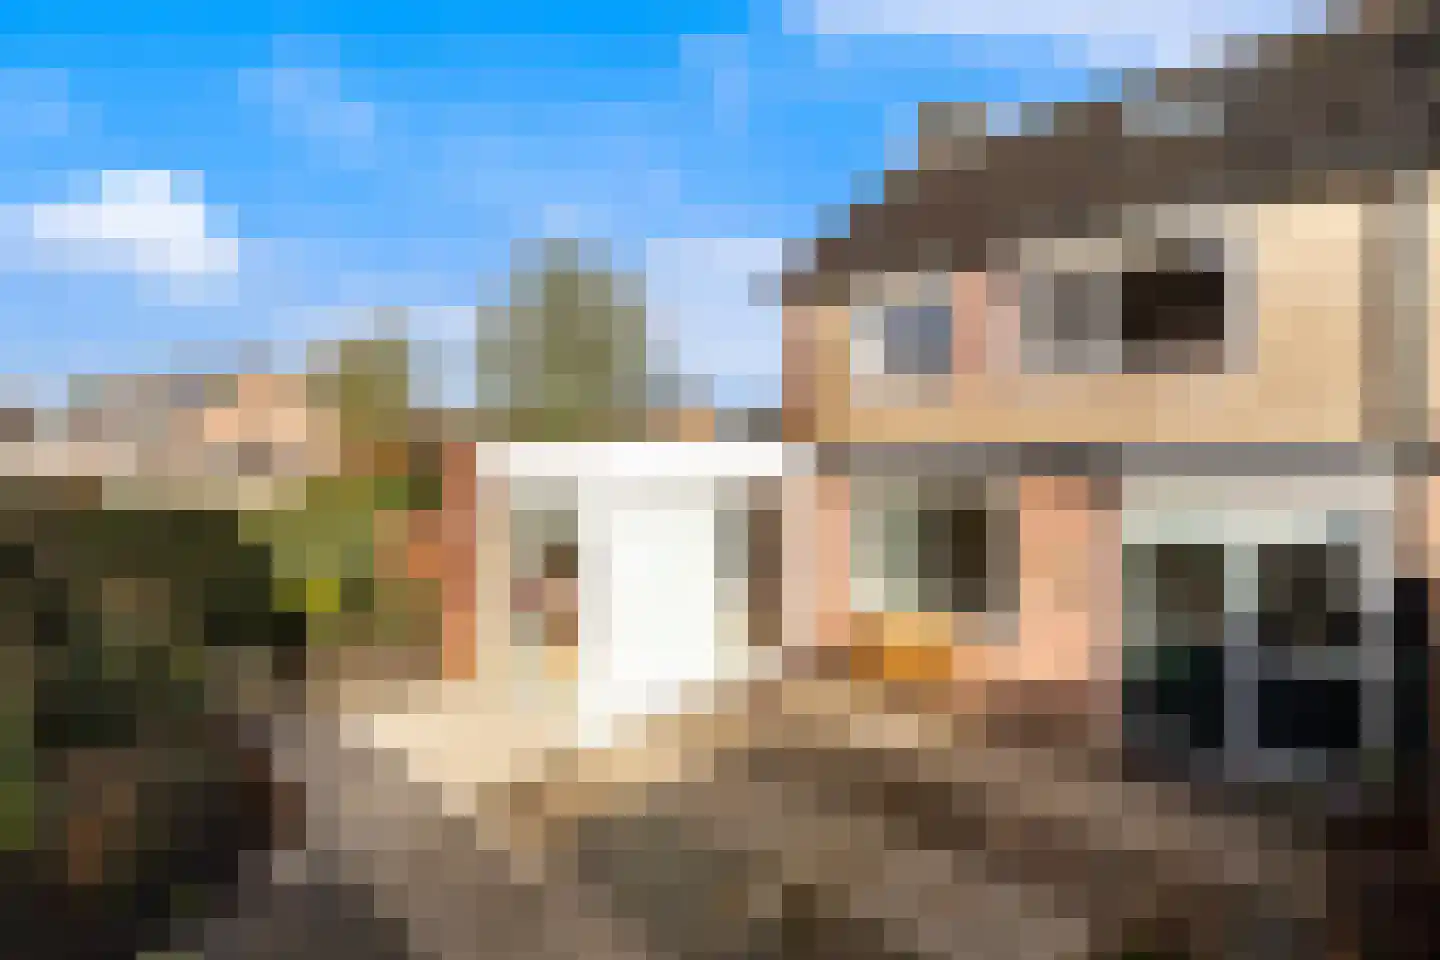
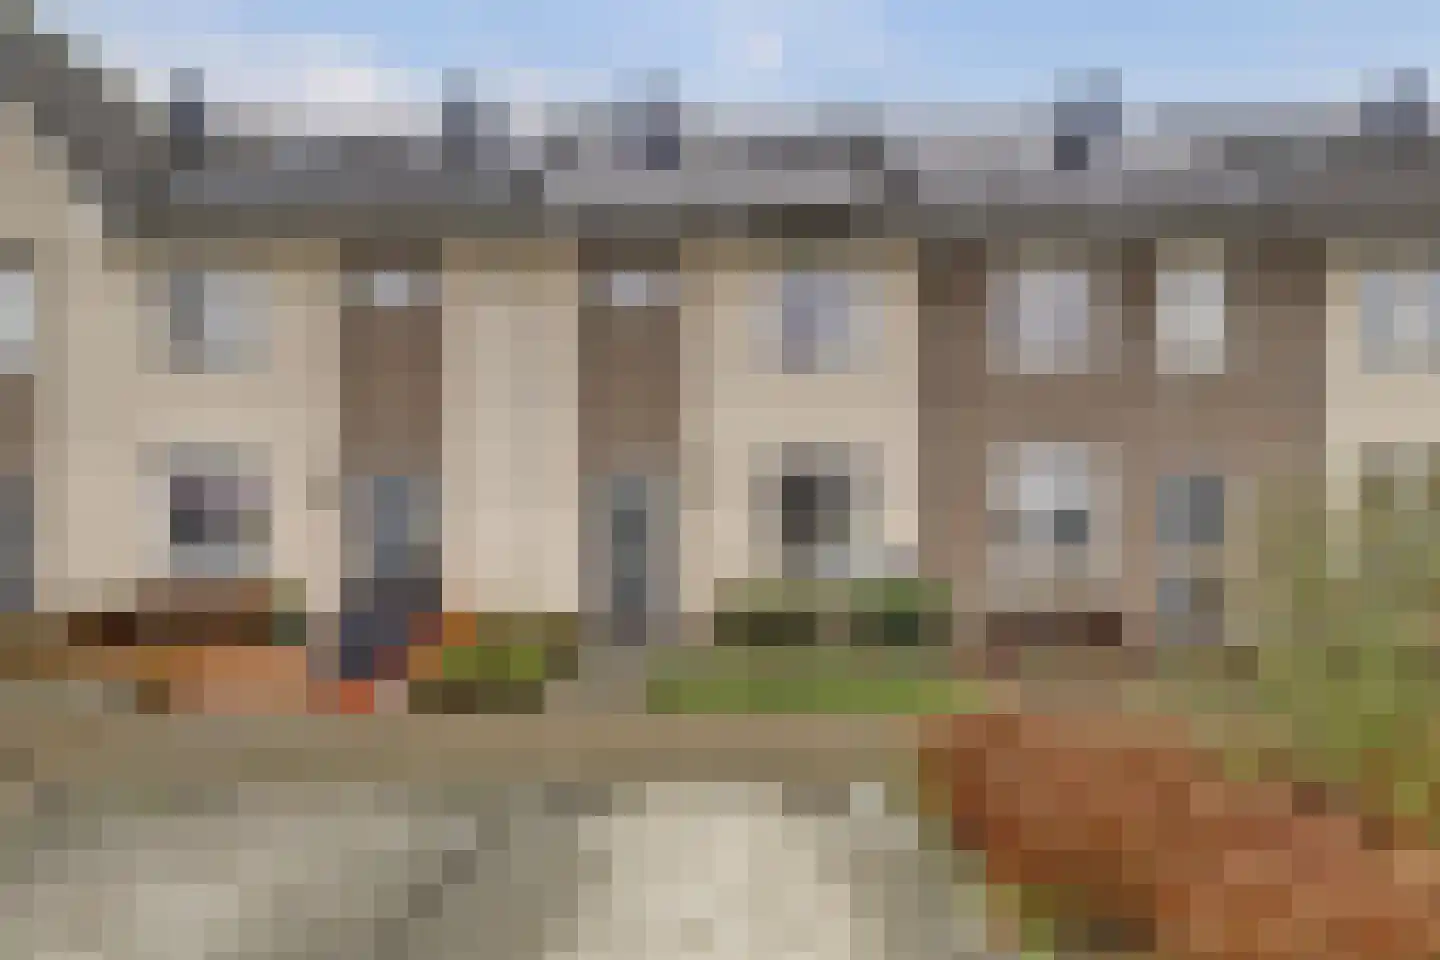
Nieuwe Es 42
4254AX Sleeuwijk
€ 450.000 k.k.
€ 4.018/m²
A
Save as favorite
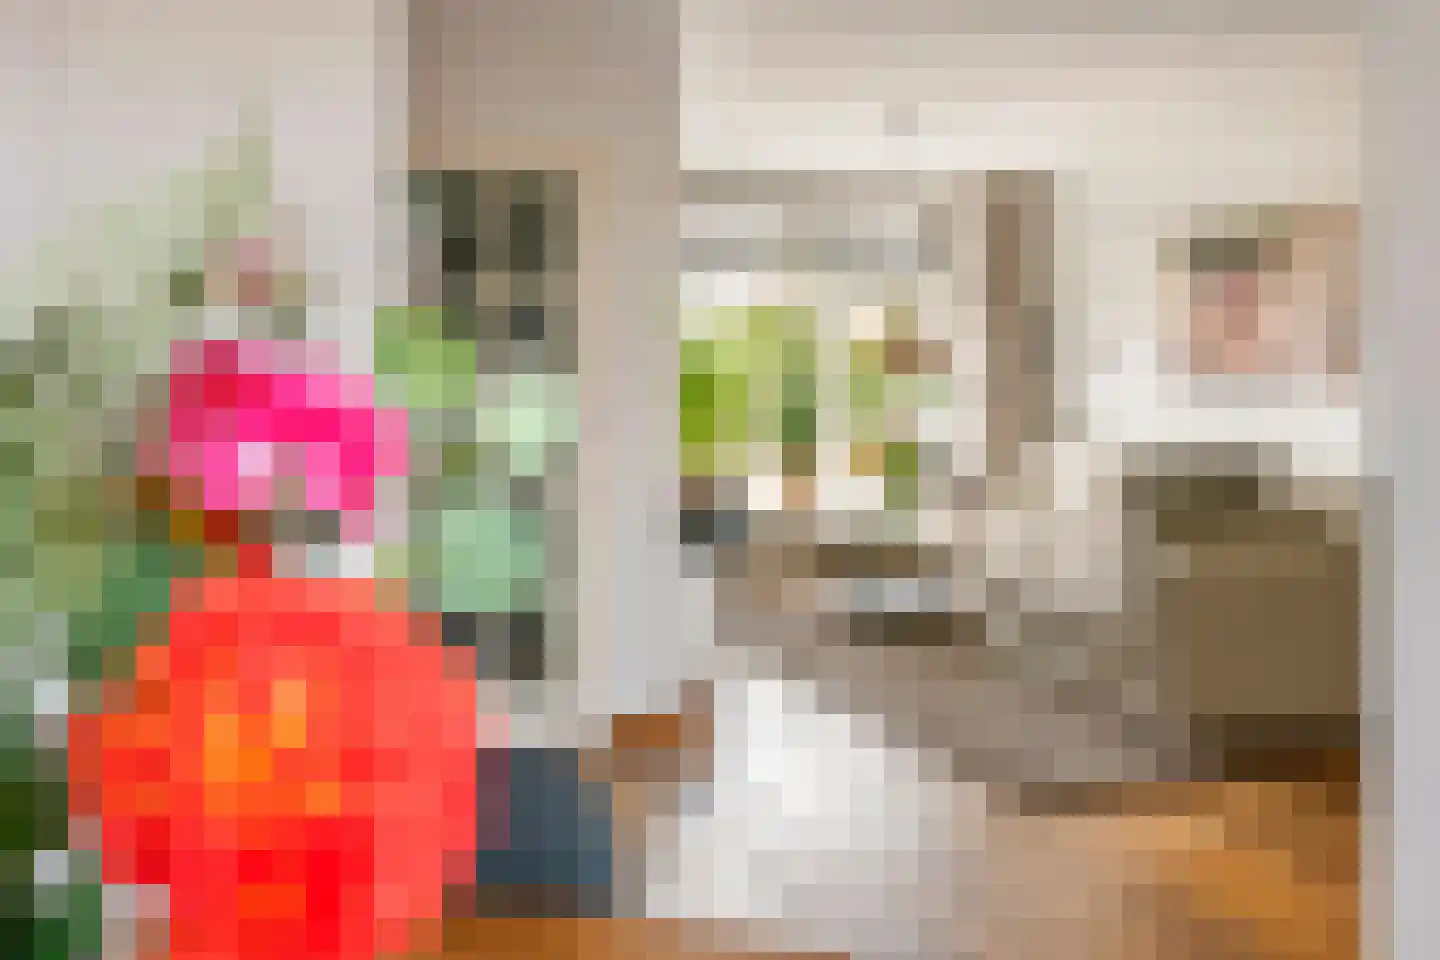
- Living area
- 112 m²
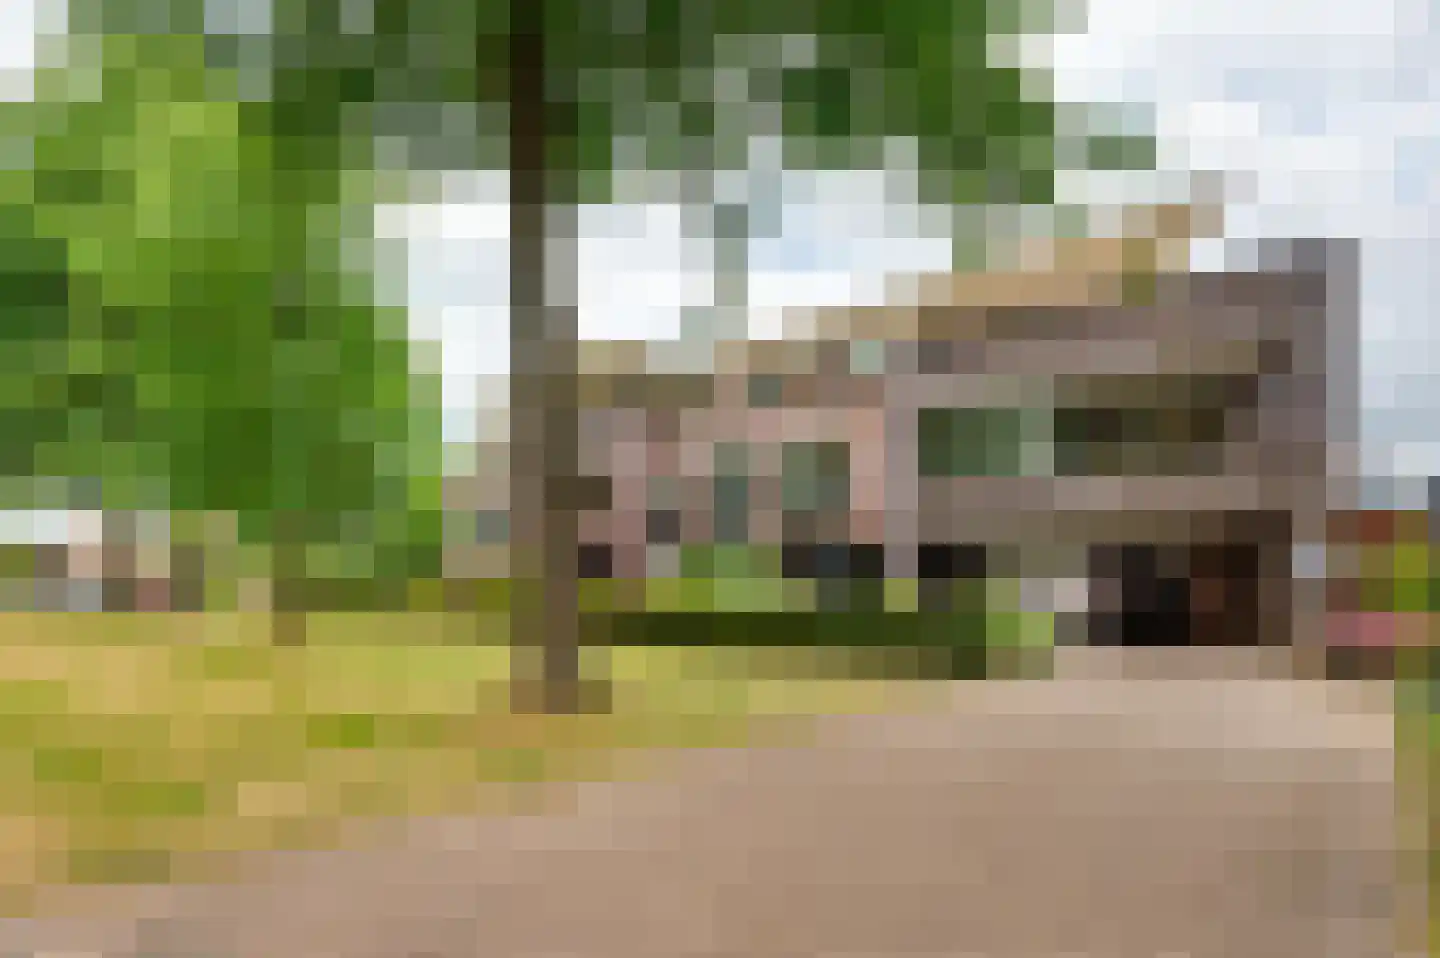
- Land area
- 107 m²
- Bedrooms
- 4